Abstract
Background
Routine assessment of photophobia in the clinical setting may underestimate the presence and severity of this condition. We aimed to develop and validate a questionnaire to improve evaluation of the impact of photophobia on activities of daily living, and to determine the relationship of this questionnaire to psychophysical assessment of light sensitivity thresholds.
Methods
We developed the 17-item Utah Photophobia Symptom Impact Scale (UPSIS-17) and compared its psychometric properties to the 8-item Korean Photophobia Questionnaire (KUMC-8). Ninety five subjects with or without light sensitivity completed both questionnaires; 72 also completed laboratory-based assessment of light sensitivity thresholds. We used Rasch analysis to evaluate instrument targeting, including internal consistency and reliability. Correlation analysis was used to assess the relationship between questionnaire scores and light sensitivity thresholds.
Results
We observed correlation between UPSIS-17 and KUMC-8, r = 0.72 (p < 0.0001). Higher UPSIS-17 scores correlated with light sensitivity thresholds, r = −0.42 (p < 0.0001), whereas KUMC-8 scores did not significantly correlate with light sensitivity thresholds, r = −0.21 (p = 0.072). UPSIS-17 showed better instrument targeting than KUMC-8 on Rasch analysis. Person-item maps allowed for identification of questions that could be removed without affecting questionnaire validity measures.
Conclusion
This study resulted in a shortened, 12-item questionnaire. The UPSIS-12 retained significant correlation with both the KUMC-8 and light sensitivity thresholds, yielding a simpler tool for symptom assessment, while retaining validity. This expanded tool may be useful in clinical, as well as research settings, for collection of data about disability due to photophobia.
Keywords: Photophobia, migraine, symptom assessment, questionnaire validation, light sensitivity
Introduction
A number of ophthalmic and neurologic conditions are associated with increased light sensitivity (“photophobia”), including benign essential blepharospasm, dry eye, traumatic brain injury, and various headache disorders, including migraine (1). Regarding the latter, photophobia is a prominent feature of migraine attack, present in up to 90% of migraineurs (2,3), and is a key criterion in the current clinical diagnostic criteria (4). A large proportion of migraineurs experience triggering and/or exacerbation of headache by light even when they do not have a headache (“interictal photophobia”), with lower light sensitivity thresholds compared to controls (3,5,6).
Photophobia assessment in the clinical setting may underestimate presence, severity, and impact (3). Choi et al. (3) recognized the need for more formalized assessment beyond the routine clinical interview and published an 8-item questionnaire ascertaining the presence of light sensitivity during the headache attack, with particular focus on validating an aid to improve diagnostic yield of migraine-related photophobia. Another recently published tool for assessment of “visual allodynia” aims to differentiate headache subtypes, including migraine with versus without aura, and chronic versus episodic migraine (7), though this tool predominately focuses on symptoms in response to patterns and glare. Currently, there are no tools available to assess the impact of light sensitivity on activities of daily living (ADLs). Thus, a standardized assessment of light sensitivity impact and symptom severity is needed in order to best assess effectiveness of various treatment interventions and clinical outcomes.
We developed a 17-item questionnaire to assess light sensitivity severity during and between headache attacks, light as a headache trigger, and impact of light sensitivity on ADLs. For the purposes of this report, we define photophobia as discomfort or pain induced by light, including exacerbation of either ocular or head pain (1). In order to validate our questionnaire’s ability to assess photophobia severity, we determined the relationship between symptom scores and quantitative light sensitivity thresholds.
Until recently, most questionnaires have been constructed and validated using classical test theory. This psychometric method has significant shortcomings and most biostatisticians are recommending the use of more contemporary psychometric methods including item-response theory and Rasch measurement theory (8). For a comparison of these three methods of evaluating questionnaire validity, and their strengths and weaknesses, see Petrillo et al. (9). Based on these recommendations, and to evaluate instrument targeting, we performed a Rasch analysis to evaluate the psychometric properties of our 17-item expanded instrument and of Choi’s previously validated, 8-item questionnaire. Additionally, the Rasch analysis allowed us to create person-item maps, which could then be used to determine if some questions could be removed from the questionnaire without affecting measures of validity.
Methods
Participants
University of Utah Institutional Review Board approval and written informed consent were obtained for this study (IRB_00085309). A total of 95 subjects were recruited, including those with and without light-sensitive conditions (e.g. episodic and chronic migraine and non-migraine headache disorders). Subjects were enrolled between June 2016 and December 2017 from the University of Utah Headache and Ophthalmology clinics.
Assessments
Questionnaires
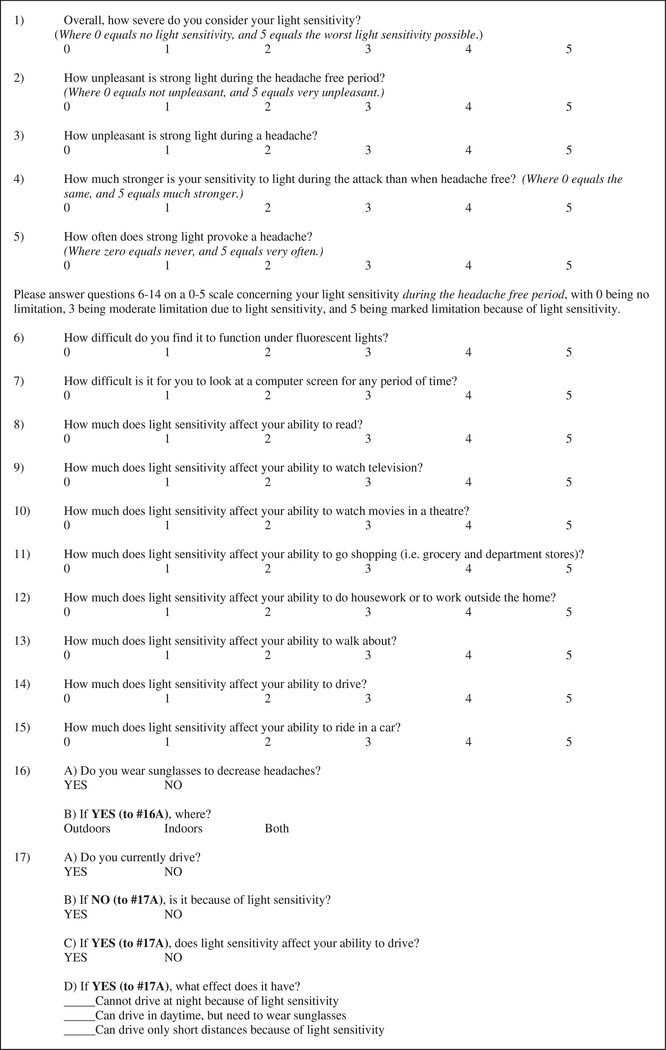
All 95 subjects completed a 17-item questionnaire developed at the University of Utah, the Utah Photophobia Symptom Impact Scale (UPSIS-17), as well as an 8-item photophobia questionnaire previously developed at the Korea University Medical Center (KUMC-8) (3). Subjects completed both instruments during the same session. The UPSIS-17 utilizes a combination of Likert scale and yes/no response items, with a total possible score range of 0–80. Items 1–15 were scored by calculating the sum of the subject’s responses on a 0–5 Likert scale. Items 16 and 17 were scored depending on whether the subject answered “yes” to previous questions that were applicable to them. For item 16, if the subject answered “yes”, she or he received 1 point if use of sunglasses indoors or outdoors was reported, and 2 points for an answer of “both.” For item 17, for a “yes” response, a subject received 1 point for each of the driving scenarios marked, for a maximum of 3 points. For the purposes of this preliminary validation, questions were intentionally constructed to be open-ended, so as to be as generalizable as possible. In contrast, the KUMC-8 utilizes yes/no answers, with a total possible score range of 0–8.
Light sensitivity testing
Using previously published methods (5,6,10), 72 of the 95 subjects completed psychophysical assessment of light sensitivity thresholds. Among those with headache disorders, participants were studied after being headache free for at least 48 hours, and were excluded from analysis if a migraine occurred within 24 hours of testing. Those with chronic migraine and/or chronic daily headache were assessed when they were free from their “migraine-type” headache attack for at least 48 hours, though testing during daily or non-migrainous headaches was permitted. Subjects had not used opiate medication or migraine-specific abortive medications during the 48 hours prior to testing and did not take any medications that could affect pupillary function, including eye drops (other than artificial tears), psychotropics, antihistamines, and benzodiazepines or their derivatives. The group of age and sex-matched non-headache (NH) control subjects reported no history of recurrent or disabling headaches and were studied in their usual state of health. Subjects were placed in a comfortable seated position facing two white-light 500-W halogen lamps (SL-1002; Bayco Products, Inc., Wylie, TX, USA). A 12 × 12 inch double-pane sheet of infrared-filtering glass (Solarban 60, ¼ inch Clear; Oldcastle, Atlanta, GA, USA) was mounted 20 cm from the lamps and 35 cm from the subjects to minimize heat exposure. Subjects underwent dark adaption for 3 minutes prior to testing. Using a calibrated rheostat, light intensity was increased in a fixed, stepwise fashion at 2-second intervals from 0.1 lux to light sensitivity threshold or a maximum of 16,450 lux (0.1, 0.2, 2.5, 10, 30, 73, 146, 242, 395, 591, 883, 1203, 1663, 2220, 2810, 3590, 4490, 5420, 6550, 7830, 9180, 1064, 12220, 13800, 15520, 16450). Luminance was measured with a digital lux meter (LX1010B, Shenzhen Bonad Instrument Co., Guangdong, China). Subjects were asked to look at a fixed point between the two light sources and to say, “stop” when the intensity of light became “uncomfortable” (defined as the level of stimulus that made the subject want to blink or turn away from the light source, and physiologically confirmed by video review of grimace). Testing was repeated three times with a three-minute dark adaptation between each trial; light intensity of the final position on the rheostat was considered the light sensitivity threshold for that trial and was reported in log(lux).
Statistical methods
Statistical analyses were performed using Winsteps v.3.93.2 and SPSS v.24 software packages. For all analyses, a p value of < 0.05 and an alpha of 0.05 (two-sided) were considered significant.
Questionnaire validation
As part of the validation process, UPSIS-17 scores were compared to KUMC-8 scores. Data distributions were visually inspected and tested for normality using the Shapiro-Wilk test and the normal Q-Q plot. Logistic transformation was performed on questionnaire scores, followed by Spearman’s rank correlation coefficient, to determine if there was a correlation between the two questionnaires.
Correlation between questionnaire scores and light sensitivity thresholds
Again, questionnaire scores underwent a logistic transformation, followed by calculation of Spearman’s rank correlation coefficients to determine the relationship between questionnaire scores and light sensitivity thresholds.
Targeting of the UPSIS-17 and KUMC-8
As above, the distribution of data was evaluated. A Rasch analysis of the UPSIS-17 and KUMC-8 questionnaires was conducted to determine if the instruments were consistent and reliable, and to assess instrument targeting. Targeting, which is an evaluation of instrument coverage, determines whether the instrument contains items that adequately cover the full range of abilities and function for the targeted population. A person-item map contains item and person distributions, separated from right to left. Higher function levels are shifted toward the top of the vertical graph and lower function toward the bottom. Items measuring varying levels of function (from low to high) are disbursed vertically across the full height of the graph; then, it is possible to calculate both ceiling and floor effects as indicators of instrument targeting. Ceiling and floor effects of less than 10% are generally considered to be satisfactory. This analysis also enabled us to determine if the number of questions in the UPSIS-17 could be reduced without affecting questionnaire validity.
In order to optimize the study population for Rasch analysis, we enrolled subjects with all levels of photophobia ranging from no photophobia to severe photophobia. The more heterogeneous the population being tested, the more useful the Rasch analysis becomes (8). For this reason, we enrolled subjects with a wide range of headache types and a wide range of light sensitivity. We did not attempt to categorize the headache type of the subjects.
Results
Demographics of the study subjects are summarized in Table 1. Mean scores for the UPSIS-17 and KUMC-8 questionnaires and average log(lux) of the study subjects who underwent light sensitivity threshold testing are presented in Table 2. Our visual inspection of the data and tests for normality indicated that the data from the two questionnaires were not normally distributed (data not shown).
Table 1.
Patient characteristics.
| Variables | n | Percent | Mean | SD | Range |
|---|---|---|---|---|---|
| Age (years) | 95 | 46.53 | 15.14 | 18–79 | |
| Gender | |||||
| Male | 23 | 24.2 | |||
| Female | 72 | 75.8 | |||
| Race | |||||
| White or Caucasian | 83 | 87.4 | |||
| Other | 7 | 7.4 | |||
| Not provided | 5 | 5.3 | |||
| Ethnicity | |||||
| Not Hispanic/Latino | 83 | 87.4 | |||
| Hispanic/Latino | 3 | 3.2 | |||
| Other/multiracial | 2 | 2.1 | |||
| Not provided | 7 | 7.4 |
Table 2.
Assessment results.
| Assessment | n | Mean | SD | Range | Median | Interquartile range |
|---|---|---|---|---|---|---|
| 17-item Utah Photophobia Symptom | 95 | 36.21 | 18.99 | 0–74 | 38 | 29 |
| Impact Scale (UPSIS-17) | ||||||
| Korean 8-item questionnaire (KUMC-8) | 95 | 5.55 | 2.52 | 0–8 | 6 | 4 |
| Photophobia threshold (average loglux) | 72 | 2.44 | 1.00 | 0–4 | 2.50 | 1.4 |
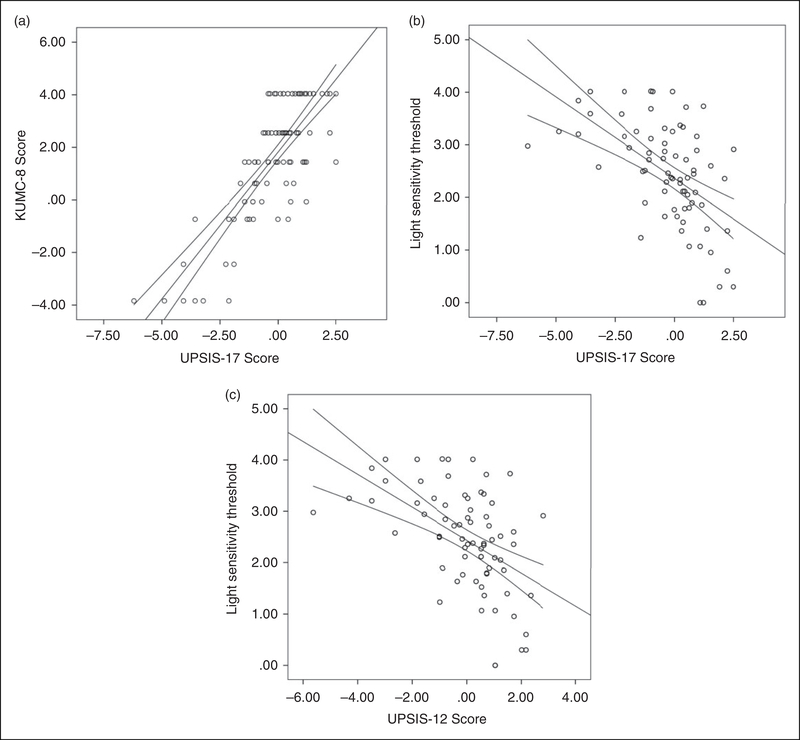
We found that the Spearman correlation between the UPSIS-17 and KUMC-8 questionnaires was 0.72 (Figure 1a; p < 0.0001). The correlation between the UPSIS-17 and the light sensitivity thresholds was −0.42 (Figure 1b; p < 0.0001) and the correlation between the KUMC-8 and the light sensitivity thresholds was −0.21 (data not shown; p = 0.072).
Figure 1.
Scatter plots of questionnaire scores and light sensitivity thresholds. Following logistic transformation, Spearman’s correlation show that high UPSIS-17 scores significantly correlate with high KUMC8 scores (a: UPSIS-17 r = 0.72, p < 0.0001) and low light sensitivity thresholds (b: r = −0.42, p < 0.0001). Similarly, UPSIS-12 scores (the shortened version), also significantly correlate with KUMC8 scores (not shown; r = 0.56, p < 0.0001) and low light sensitivity thresholds (c: r = −0.51, p < 0.0001).
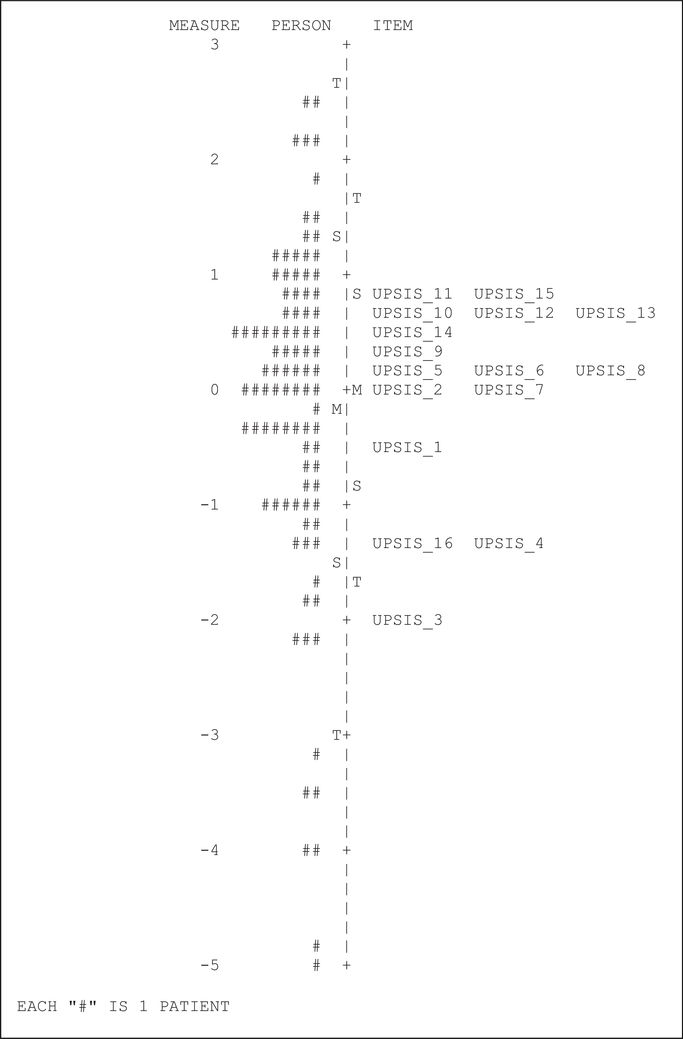
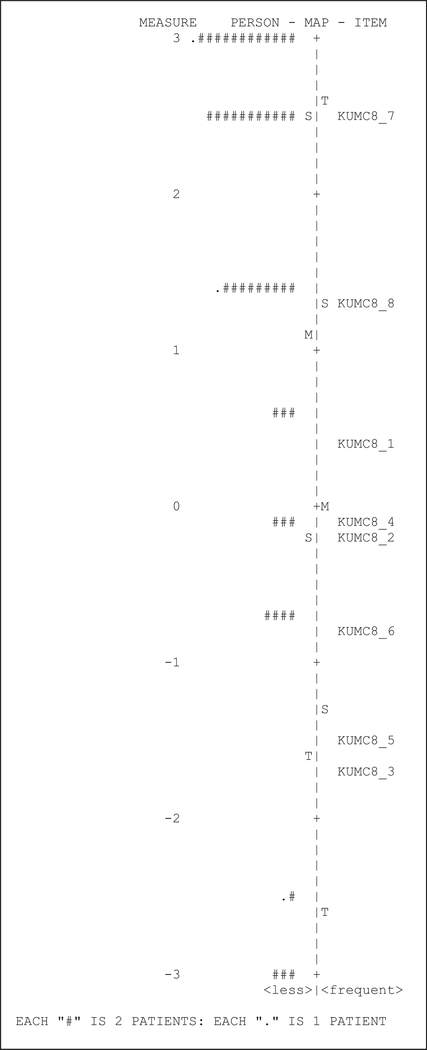
Results of the Rasch analysis for the UPSIS-17 and KUMC-8 are shown in person-item maps (Figure 2 and Figure 3, respectively), where subjects are denoted by number signs. Our data was non-parametrically distributed, and thus we used a nonparametric Bayesian approach to fit the Rasch model. With both questionnaires, we observed large ceiling effects as noted by a clustering of data toward the top of the figures. For the UPSIS-17, we calculated Cronbach alpha to be 0.95, with a ceiling effect of 23.2% and a floor effect of 10.5%. For the KUMC-8, we calculated Cronbach alpha to be 0.83, with a ceiling effect of 49.5% and a floor effect of 9.5%.
Figure 2.
UPSIS-17 Person-Item map.
Figure 3.
KUMC8 Person-Item map.
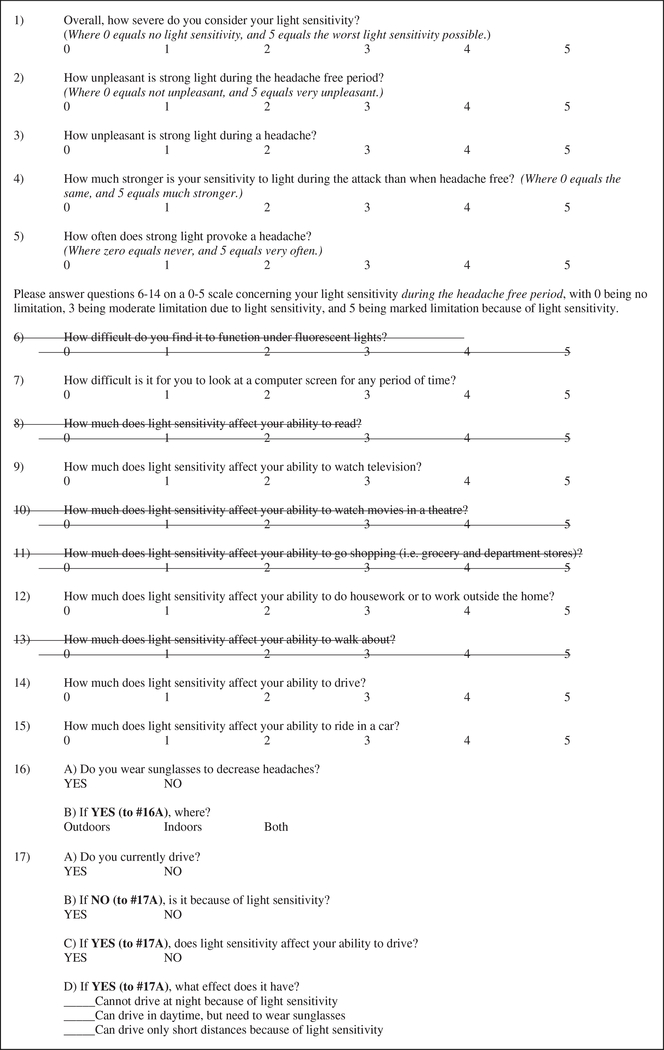
We used the Rasch analysis to determine whether the UPSIS-17 (Figure 4) could be shortened without a significant effect. Guided by the results of the Rasch analysis, we eliminated questions 6, 8, 10, 11 and 13 from the UPSIS-17, thereby creating the UPSIS-12 (Figure 5). After recalculating the Spearman correlations, we found that correlation between the UPSIS-12 and KUMC-8 was 0.561 (p < 0.0001), and correlation between the UPSIS-12 and the light sensitivity thresholds was −0.510 (Figure 1c; p < 0.0001). Finally, for the UPSIS-12, we calculated Cronbach alpha to be 0.95, with a ceiling effect of 22.1% and a floor effect of 9.5%.
Figure 4.
UPSIS-17 questionnaire.
Figure 5.
UPSIS-12 questionnaire.
Items removed from UPSIS-17 are shown in “strike-through” as an aid to readers comparing UPSIS-12 to UPSIS-17.
Discussion
We found that increasing scores on the newly developed UPSIS-17 and UPSIS-12 questionnaires were significantly correlated with increasing scores on the previously validated KUMC-8 (Figure 1). The Rasch analysis indicated that item targeting was stronger for both the UPSIS-17 and UPSIS-12 compared to the KUMC-8 (Figures 2 and 3). These findings help support the validity of both UPSIS tools, which use an expanded set of factors to assess interictal light sensitivity, including aspects of symptom impact on ADLs.
We also found that high UPSIS scores were associated with reduced thresholds for light-induced discomfort (Figure 1), further supporting the tool’s correlation with interictal photophobia in our study population. In contrast, the correlation between the KUMC-8 and the laboratory measurements of light sensitivity was relatively weak. Most likely, this result is related to questionnaire content. Fourteen of the UPSIS-17 questions and nine of the UPSIS-12 questions ask about photophobia during the headache-free period (interictal photophobia), compared to seven of the eight KUMC-8 questions that ask about photophobia during a headache (ictal photophobia). This observation is expected, given that our laboratory measurements of photophobia were performed during headache-free periods.
With the Rasch analysis, we observed better instrument targeting for the UPSIS compared to the KUMC-8, based on a much smaller ceiling effect (23.2 for UPSIS-17and 22.1 for UPSIS-12, compared to 49.5 for KUMC-8). These findings indicate that our tool can be used to measure a wider range of light sensitivity-related factors. The shorter KUMC-8 may lack the range of items needed to target higher function, resulting in the larger ceiling effect. However, we noted that the UPSIS-17 appeared to have 12 items that clustered together, suggesting that we could shorten our questionnaire without affecting item targeting, ceiling effects or floor effects. As a result, we reduce the number of questions in order to create the UPSIS-12. Although the correlation between the UPSIS-12 and KUMC-8 was slightly weaker than that observed with the UPSIS-17, it retained statistical significance; furthermore, the correlation between the UPSIS-12 and quantitative light sensitivity thresholds was improved. On balance, we believe that the UPSIS-12 is as useful as the UPSIS-17, with the benefit of being faster and easier for patients to complete. Both instruments had floor effects near the 10% range, which we consider acceptable.
Potential limitations
The purpose of this study was to validate the UPSIS and to evaluate it for item targeting. For this reason, we needed a heterogeneous population of patients with different headache types and different levels of light sensitivity. We did not collect data about specific headache types (e.g. episodic migraine, chronic migraine, migraine with aura). Future studies will be needed to address the disease-specific validation of the UPSIS in migraine patients, and in those with different ICHD diagnoses. These data will provide further validation within clinically well-defined disease groups. Accordingly, future studies would benefit from the addition of a pre-defined recall period (e.g. within the past 3 months), such as the item included in the Migraine Disability Assessment (MIDAS) (11).
Above, we have provided a detailed explanation as to why we selected a heterogeneous group of study subjects, with a wide range of UPSIS-17 scores, in order to optimize the results for item-targeting and Rasch analysis. However, our study lacks a detailed breakdown of the headache diagnoses among the 95 patients and does not capture headache frequency data with which to confirm ictal status. This is a significant weakness of our study design. Specifically, recall bias may have influenced the responses to questionnaire items that assessed ictal symptoms. Furthermore, we did not directly differentiate patients with chronic daily headache, where their last true interictal phase is likely beyond the scope of their recall. Given this, there is a risk that these subjects might have mistakenly scored their responses relative to their ictal symptoms and related disabilities, rather than the intended interictal phase.
Similarly, differences in the correlation of questionnaire scores and light sensitivity thresholds between the UPSIS and KUMC-8 may reflect differences in the phase of headache state (e.g. ictal versus interictal), rather than in sensitivity of the scales. We have attempted to address this difference by standardizing the testing session and limiting testing to the interictal phase (greater than 48 hours from last migraine attack). While this approach cannot account for inherent difference in question construct (KUMC focuses on ictal, and UPSIS focuses on both, as noted above), we feel this approach was sufficient for the purposes of this preliminary validation.
Conclusions
By including subjects with a wide range of photophobia (from no photophobia to severe photophobia), we were able to rigorously evaluate the item targeting, internal consistency, and reliability of the UPSIS-17. Inclusion of assessments of photophobia during and between headache attacks, the effect of light as a trigger for other symptoms, and the effect of photophobia on ADLs gave us the opportunity to expand upon previously available instruments and fill a void for evaluating the impact of photophobia on ADLs. This expanded tool has the potential for application in both clinical and research settings and can provide important data regarding the role of photophobia in patient-related disability in headache disorders.
Article highlights.
The Utah Photophobia Symptom Impact Scale (UPSIS) is a reliable new tool for the clinical assessment of photophobia-related disability.
High UPSIS scores were significantly associated with low light sensitivity thresholds in our study of subjects with photophobia.
Acknowledgments
Funding
The authors disclosed receipt of the following financial support for the research, authorship, and/or publication of this article: This study was supported by the University of Utah Department of Orthopedics Quality Outcomes Research and Assessment (https://medicine.utah.edu/orthopaedics/research/divisions/qora/); the Population Health Research Foundation; the National Center for Research Resources; and the National Center for Advancing Translational Sciences, National Institutes of Health [5UL1TR001067]; and a grant to the Department of Ophthalmology and Visual Sciences from Research to Prevent Blindness, Inc., New York, NY, USA. DU was supported by the University of Utah School of Medicine Medical Student Research Program in Eye Health and Disease (PI ME Hartnett) [NIH/NEI 5T35EY026511-02].
Footnotes
Declaration of conflicting interests
The authors declared no potential conflicts of interest with respect to the research, authorship, and/or publication of this article.
References
- 1.Digre KB and Brennan KC. Shedding light on photophobia. J Neuro-ophthalmol 2012; 32: 68–81. [DOI] [PMC free article] [PubMed] [Google Scholar]
- 2.Rasmussen BK, Jensen R and Olesen J. A population-based analysis of the diagnostic criteria of the International Headache Society. Cephalalgia 1991; 11: 129–134. [DOI] [PubMed] [Google Scholar]
- 3.Choi JY, Oh K, Kim BJ, et al. Usefulness of a photophobia questionnaire in patients with migraine. Cephalalgia 2009; 29: 953–959. [DOI] [PubMed] [Google Scholar]
- 4.The International Classification of Headache Disorders,3rd edition (beta version). Cephalalgia 2013; 33: 629–808. [DOI] [PubMed] [Google Scholar]
- 5.Vanagaite J, Pareja JA, Storen O, et al. Light-induced discomfort and pain in migraine. Cephalalgia 1997; 17: 733–741. [DOI] [PubMed] [Google Scholar]
- 6.Cortez MM, Rea NA, Hunter LA, et al. Altered pupillary light response scales with disease severity in migrainous photophobia. Cephalalgia 2017; 37: 801–811. [DOI] [PMC free article] [PubMed] [Google Scholar]
- 7.Perenboom MJL, Zamanipoor Najafabadi AH, Zielman R, et al. Quantifying visual allodynia across migraine subtypes: The Leiden Visual Sensitivity Scale. Pain 2018; 159: 2375–2382. [DOI] [PMC free article] [PubMed] [Google Scholar]
- 8.Hobart JC, Cano SJ, Zajicek JP, et al. Rating scales as outcome measures for clinical trials in neurology: Problems, solutions, and recommendations. Lancet Neurol 2007; 6: 1094–1105. [DOI] [PubMed] [Google Scholar]
- 9.Petrillo J, Cano SJ, McLeod LD, et al. Using classical test theory, item response theory, and Rasch measurement theory to evaluate patient-reported outcome measures: A comparison of worked examples. Value Health 2015; 18: 25–34. [DOI] [PubMed] [Google Scholar]
- 10.Adams WH, Digre KB, Patel BC, et al. The evaluation of light sensitivity in benign essential blepharospasm. Am J Ophthalmol 2006; 142: 82–87. [DOI] [PubMed] [Google Scholar]
- 11.Stewart WF, Lipton RB, Dowson AJ, et al. Development and testing of the Migraine Disability Assessment (MIDAS) Questionnaire to assess headache-related disability. Neurology 2001; 56: S20–S28. [DOI] [PubMed] [Google Scholar]


