Abstract
Detection of food toxins with high sensitivity is very important and challenging. Ochratoxin A (OTA) is frequently present as food contaminant in contaminated grains and grain derivatives such as bread and beer. In this work, a target‐induced dissociation (TID) based aptamer‐assisted real‐time PCR‐based assay (apta‐qPCR) is developed that features effective detection of OTA. Apta‐qPCR effectively combines the capabilities of aptamer to be amplified, being a nucleotide sequence, with its specific interaction with the corresponding target molecule. Compared to commonly used fluorescence‐based and colorimetric methods, the sensitivity of qPCR to detect a nucleotide sequence (aptamer) has ameliorated the sensitivity of the aptamer‐based detection of OTA. Here, the OTA aptamer was immobilized on the magnetic beads coated with d(T)25 (dT beads). A sequence complementary to the OTA‐binding portion of the aptamer was used as a linker between dT beads and the aptamer sequence. When OTA was added, the aptamer was released from the dT beads due to TID. The resulting assay was able to detect 0.009 ng/mL OTA with a wide dynamic range of 0.039–1000 ng/mL. Apta‐qPCR can be easily transferred to other small molecules for highly sensitive detection using corresponding aptamers.
Keywords: Apta‐qPCR, Aptamer, Food toxin, Ochratoxin A, Target‐induced dissociation
Abbreviations
- Apta‐qPCR
aptamer‐assisted real‐time PCR‐based assay
- Apta‐beads complex
aptamer:dA‐cOligo:dT beads
- dA‐cOligo
d(A)25‐complementary oligonucleotide
- dT
d(T)25
- dT beads
dT‐modified magnetic microparticles
- EDC
1‐ethyl‐3‐(3‐dimethyl‐aminopropyl) carbodiimide
- OTA
ochratoxin A
- TID
target‐induced dissociation
1. Introduction
Food safety for humans and animals is a global health objective, and foodborne diseases caused by the consumption of contaminated food represents a major health risk 1. Mycotoxins are biologically active fungal secondary metabolites often found in a variety of crops, including commodities largely consumed by humans and animals 2, 3. Ochratoxin A (OTA) is a ubiquitous mycotoxin produced by Aspergillus and Penicillium genera, in particular by Aspergillus ochraceus and Penicillium viridicatum. OTA is highly nephrotoxic and is suspected to be the main etiological agent responsible for human Balkan endemic nephropathy and associated urinary tract tumors 4, 5. According to International Agency for Research on Cancer (IARC), OTA is a "possible carcinogen to humans" (group 2B) 6. Considering these adverse effects, regulation of OTA content in food products is regulated by international and governmental agencies. The European Commission Regulation (EC) has established a maximum level of OTA at 5 mg/kg for raw cereal grains, 3 mg/kg for all cereal‐derived products, and 10 mg/kg for soluble coffee. In addition, OTA in grape juices, wines (red, white, and rose) should be less than 2 ng/mL 7, 8.
The design of highly sensitive, more convenient, rapid and robust assays for the detection of OTA in food products and serum are in great demand. Standardized methods for OTA detection include chromatographic methods where TLC, HPLC, or GC coupled to fluorescence detection 9, 10. During the last decade, various assays including ELISA, lateral flow immunoassay, flow‐through immunoassay, SPR assays, and electrochemical immunosensors have been developed for the detection of OTA in order to improve the detection 11. However, antibody‐based detection systems are hindered by the time required for antibody preparation, the effect of modification on antibodies, solvent effects, and the thermal instability of antibodies 12. Multiple strategies have been used to overcome the drawbacks of antibody‐based detection systems including molecular imprinted polymers 13, aptamers 14, 15, and phage display libraries 16. Among these, DNA aptamers have been widely and successfully used for the detection of small molecules including OTA 17.
DNA aptamers are single‐stranded oligonucleotides selected in vitro from combinatorial oligonucleotide libraries by the systematic evolution of ligands by the exponential enrichment process. Aptamers are highly specific to the target molecule and high‐purity aptamers can be synthesized chemically at low cost. Aptamers are thermostable and can be modified chemically to enhance stability, and to enable detection. Due to these advantages, aptamers have been used in various applications including biosensor development 18, purification using affinity separation 19, 20, and medical applications, including diagnostics 21 as well as drug delivery approaches 22. Particularly in diagnostic applications, aptamers have been used in various detection techniques, including photometric, electrochemical, mass, and SPR 23.
Aptamers against OTA (OTA aptamer) were selected by Cruz‐Aguado et al. in 2008. The specificity of the OTA aptamer was confirmed using warfarin, a structure analogue of OTA 24. Considering the importance of OTA detection, various assays have been recently developed to detect OTA using aptamer. These assays mainly involve fluorescence 25, 26, electrochemical 27, gold nanoparticle based colorimetric assays 28, SPR 29, filtration 30, and chemiluminescence 11, 31. In these assays, the measurement is limited to the aptamer‐target binding and the changes due to the interactions in a 1:1 ratio. Being an oligonucleotide, the aptamer can be easily amplified and quantified using qPCR. Recently, various assays including rolling circle amplification 32, isothermal signal amplification 33, split aptamer assay 34, proximity ligation assay 35, nuclease protection assay 36, and the use of modified magnetic microparticles 37 have utilized amplification‐based aptasensing strategies. The strategy to amplify offers a major advantage because the release of a single sequence can be monitored with high sensitivity in a robust way using qPCR.
In this work, dT‐modified (where dT is d(T)25) magnetic microparticles (dT beads) were used for aptamer‐assisted real‐time PCR‐based assay (Apta‐qPCR). Aptamers were immobilized on the dT beads using a sequence complementary to the target‐binding portion of the aptamer. Addition of OTA resulted in the release of aptamer from the dT‐beads and the released aptamers were amplified and quantified using qPCR. The assay resulted in 0.009 ng/mL sensitivity for OTA detection. Additionally, the assay is able to detect a broad range of OTA concentration from 0.039 to 1000 ng/mL.
2. Materials and Methods
2.1. Chemicals and materials
The DNA sequences used in this work were all synthesized by Integrated DNA Technologies, Inc. (Coralville, IA) (Table 1). The oligonucleotide concentrations were determined with NanoDrop 1000 Spectrophotometer (Thermo Scientific, Wilmington, DE, USA) using the extinction coefficients of the respective oligonucleotide. OTA was purchased from Sigma‐Aldrich Chemie GmbH (Munich, Germany). The magnetic beads (Dynabeads® MyOne™ Carboxylic acid) were purchased from Life Technologies GmbH (Darmstadt, Germany). MES was purchased from AppliChem GmbH (Darmstadt, Germany). 1‐Ethyl‐3‐(3‐dimethyl‐aminopropyl) carbodiimide (EDC) was purchased from Sigma‐Aldrich Chemie GmbH (Munich, Germany). SYBR Green Real‐Time PCR Master Mix was purchased from Promega GmbH (Mannheim, Germany). Herrenhäuser premium pilsener beer was used as a complex sample matrix. All chemicals were of analytical grade. All stock solutions and buffers were prepared with deionized water (arium 611, Sartorius AG, Göttingen, DE).
Table 1.
List of oligonucleotides used in this work
| Name of the sequence | Sequence (5′ to 3′)a) |
|---|---|
| Ochratoxin A aptamer | TGGTGGCTGTAGGTCAGCATCTGATCGGGTGTGGGTGGCGTAAAGGGAG CATCGGACA ACG |
| dA‐Complementary sequence (dA‐cOligo) | AAAAAAAAAAAAAAAAAAAAAAAAA‐TA‐TGTCCGATGC |
| Random sequence | NH2‐C12‐TGGACCCCCTC |
| Forward primer | TGGTGGCTGTAGGTCA |
| Reverse primer | CGTTGTCCGATGCTC |
| dT | TTTTTTTTTTTTTTTTTTTTTTTTT‐C6‐dT‐NH2 |
Underlined bases correspond to primer binding regions. Italics bases indicate complementary sequences within the aptamer and oligonucleotides. In dA‐cOligo, TA was used as a spacer between d(A)25 region and complementary sequence.
2.2. Preparation of dT‐beads
Here, 3′‐amino‐modified dT was conjugated to the magnetic beads (7–12 × 109 beads/mL, Dynabeads® MyOne™ Carboxylic acid, Invitrogen) of about 1.05 μm diameter with carboxyl groups on the surface. The conventional EDC coupling reaction was used to form amide bond between the carboxyl group on the magnetic beads and a primary amine group at the 3′‐end of dT. In brief, 100 μL suspension of magnetic beads (10 mg/mL) was dispensed to a microtube and washed with 500 μL MES buffer (25 mM MES, pH 4.5) three times. The carboxyl groups on the magnetic beads were activated using 500 μL 50 mM EDC in MES buffer for 30 min. Hundred microliters of 3′‐amino‐modified dT in MES buffer was added to the microtube after removing unreacted EDC. Immobilization was carried out by incubation of dT and magnetic beads at room temperature for 2 h with slow tilt rotation to prevent sedimentation of the magnetic beads. Magnetic beads were washed three times with 200 μL MES buffer to remove nonimmobilized dT. In order to quench the nonreacted carboxylic acid groups on the magnetic beads, the magnetic beads were incubated with 200 μL 50 mM Tris, pH 7.5 for 15 min. The dT‐beads were washed with 200 μL of the aptamer selection buffer (20 mM Tris‐HCl buffer containing 150 mM NaCl, 5 mM MgCl2, pH 8.2) twice and then stored in 200 μL selection buffer at 4°C. In order to confirm the immobilization of dT on the magnetic beads, all washing fractions were collected and dT was quantified using NanoDrop ND 1000.
2.3. Hybridization of aptamer to dT‐beads using a complementary sequence
In total, 6.25 μL 100 nM aptamer was mixed with 6.25 μL 100 nM d(A)25‐complementary oligonucleotides (dA‐cOligo) in a microtube containing 6.25 μL selection buffer. The complementary oligonucleotide was adapted from Chen et al. 38. During the incubation, the mixture was heated up to 90°C for 5 min and cooled to room temperature for 20 min to ensure proper hybridization. dT‐beads suspension (6.25 μL) was added to the reaction mixture at room temperature and incubated for 20 min with slow tilt rotation. The microtube was then placed under magnetic field using DynaMag™‐2 magnet for 5 min. The unbound aptamers, remaining in the supernatant, were removed. The complex was washed 10 times (20 min of incubation each time) with 25 μL selection buffer and the presence of aptamer in each washing fraction was checked using qPCR. Magnetic beads without immobilization, magnetic beads immobilized with a random sequence, and the reaction mixture without addition of dA‐cOligo were used as negative controls.
2.4. qPCR‐based detection of released aptamer
One microliter aliquot of aptamer‐containing solution was mixed with 12.5 μL of GoTaq® qPCR Master mix (2×), 0.5 μL of 10 μM forward primer, 0.5 μL of 10 μM reverse primer, and 10.5 μL of nuclease‐free water to make a total volume of 25 μL. The final PCR mixture contained 200 nM forward primer, 200 nM reverse primer, and 1 μL aliquot of aptamer in 1 × GoTaq® qPCR master mix. qPCR was carried out in a 96‐well PCR plate (Sarstedt) covered with strip caps. A melting curve analysis was performed from 55°C to 85°C to detect potential nonspecific products. The thermal cycling regime was as follows: initial denaturation for 2 min at 95°C, cycling for 30 s at 95°C, 15 s at 46°C, and 15 s at 72°C, repeated 40 times on the Bio‐Rad iCycler real‐time PCR machine.
2.5. Detection of OTA using Apta‐qPCR
In total, 6.25 μL 100 nM aptamer was mixed with 6.25 μL 100 nM dA‐cOligo in a microtube containing 6.25 μL selection buffer. During the incubation, the mixture was heated up to 90°C for 5 min and then cooled to room temperature for 20 min to ensure hybridization. dT‐beads (6.25 μL), with 7.5 pmol dT immobilized on the beads surface, were added to the reaction mixture at room temperature for 20 min. The microtube was placed under magnetic field using DynaMag™‐2 magnet for 5 min. The unbound aptamers were removed by washing with selection buffer two times (20 min each). After washing, 25 μL of selection buffer containing different concentrations of OTA were added to the microtube and incubated for 20 min. The aptamer released by target‐induced dissociation (TID) was collected in the supernatant and quantified using qPCR. To test the Apta‐qPCR assay in complex samples, different OTA concentrations were spiked in Herrenhäuser premium pilsener beer purchased from a local market in Hannover, Germany. The LOD was calculated by 3σ/slope method, where σ is the SD of the blank samples of three Apta‐qPCR assays.
3. Results and discussion
3.1 Principle. of the Apta‐qPCR assay
The principle of Apta‐qPCR assay is depicted in Fig. 1. The envisaged assay relies on TID of OTA aptamer from a complementary oligonucleotide. The complementary oligonucleotide was designed to bind to the target‐binding portion of the aptamer and additionally contains a dA tail to ensure hybridization with dT immobilized on the magnetic beads. Addition of OTA results in dissociation of the aptamer from the complementary oligonucleotide, and thus release of the aptamer from the magnetic beads. The magnetic beads were separated with a magnetic stand and the dissociated aptamer present in the supernatant was quantified by qPCR.
Figure 1.
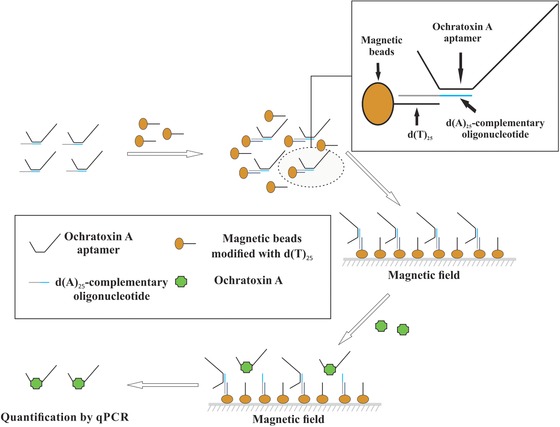
Schematic illustration of Apta‐qPCR for ochratoxin A (OTA) detection. Binding of OTA results in dissociation of the aptamer from the dT beads. The dissociated aptamer was separated from the dT beads using a magnetic stand and was quantified using real‐time PCR.
3.2. Preparation of dT‐beads
In the developed assay, dT was immobilized on the magnetic beads in order to immobilize the aptamers on the magnetic beads. One‐step EDC coupling was used for immobilization. Six different amounts of dT/mg magnetic beads (100, 150, 25, 2000 pmol/mg magnetic beads) were used to optimize the Apta‐qPCR assay as the density of dT on the magnetic beads can affect the immobilization of aptamer on the magnetic beads. Nonreacted activated carboxyl groups were blocked with 50 mM Tris buffer and beads were then washed with selection buffer two times. Using higher concentrations of oligo dT resulted in higher immobilization densities. Yet, a decrease in the immobilization efficiency was observed at high dT concentrations (Fig. 2).
Figure 2.
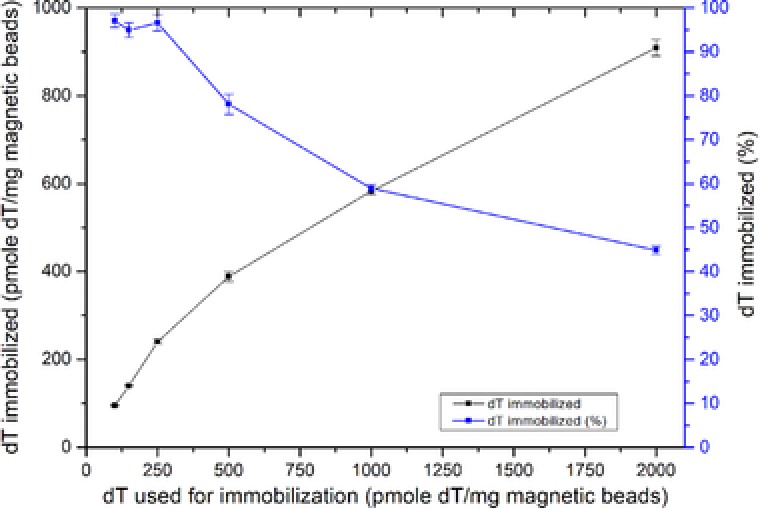
Immobilization of amino‐modified dT on carboxyl magnetic beads using EDC coupling. Y‐axis, in black, shows the amount of immobilized dT; y‐axis, in blue, shows percentage of immobilized dT in respect to amount of dT used for immobilization.
3.3. Optimization of aptamer dissociation from dT‐beads
As shown in Fig. 1, the aptamer is in contact with the magnetic beads with the help of a complementary oligonucleotide. The complementary oligonucleotide was adapted from Chen et al. as the described 10‐nucleotide long complementary oligonucleotide provided a stable duplex with the aptamer and the highest TID in response to OTA 38. On 5′‐terminus, the complementary oligonucleotide was extended with d(A)25 (dA) and two nucleotides (T and A, from 5′ to 3′) as an additional spacer to get efficient hybridization between the OTA aptamer and the complementary oligonucleotide 37.
To optimize the hybridization between dA‐cOligo and dT‐beads, dT beads with different dT oligo densities on magnetic beads were incubated with 1:1 ratio of aptamer to dA‐cOligo. The higher density of dT resulted in reduced hybridization of aptamer (Fig. 3). This can be ascribed to electrostatic repulsion as a result of higher density of dT decoration on the magnetic beads. This repulsion interferes with the interaction of the dA‐tail of dA‐cOligo with dT‐modified beads. Optimal hybridization was observed using a 1:1:12 ratio of Aptamer:dA‐cOligo:dT (immobilized on the magnetic beads).
Figure 3.
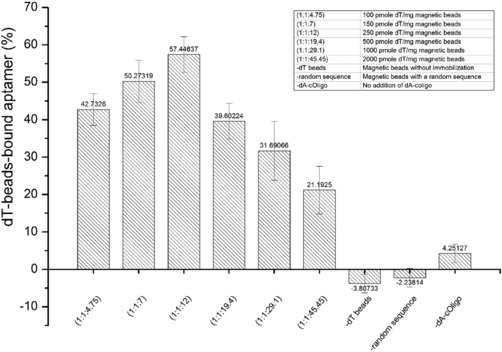
Characterization of the apta‐beads complex. dT beads with different dT oligo densities on the magnetic beads were incubated with 1:1 ratio of aptamer to dA‐cOligo. Maximum hybridization was observed with 1:1:12 of aptamer:dA‐cOligo:dT.
The stability of aptamer/dA‐cOligo/dT‐beads complex (hereinafter, aptamer/dA‐cOligo/dT‐beads is mentioned as "apta‐beads complex") was investigated by 10 subsequent washing steps. The washing steps were analyzed for the presence of aptamer. Release of aptamer was only observed in the first two washing steps (Fig. 4). In 10 washing steps, 35% aptamer‐release was observed in first washing step and 7% aptamer‐release was observed in second washing step. In further washing steps, no release of the aptamer from the apta‐beads complex was detected.
Figure 4.
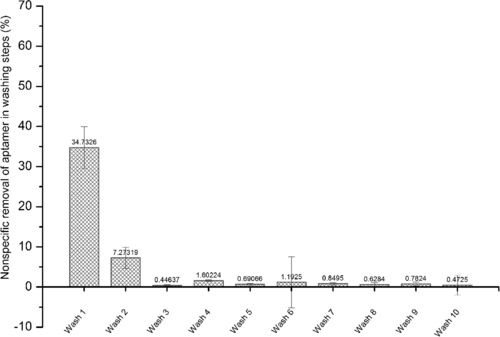
Release of aptamer in the washing steps using selection buffer. Here, 1 nM aptamer was immobilized in the apta‐beads complex. Release of aptamer was only observed in first two washing steps. The apta‐beads complex remained stable after wash 2.
3.4. Detection of OTA using Apta‐qPCR
The scheme of Apta‐qPCR assay is shown in Fig. 1. When an OTA containing sample is added to the apta‐beads complex, the OTA aptamer binds to OTA and is released from the complex. The magnetic beads were separated from the OTA‐bound aptamers using a magnetic stand. The supernatant containing OTA‐bound aptamers were subjected to qPCR.
As discussed in Section 3.3, the complementary oligonucleotide was adapted from a previous work and the apta‐beads complex was stable after second washing step. For detection of OTA, the OTA samples were added to the apta‐beads complex after second washing step. To further optimize the assay, the effect of incubation time was also evaluated. As can be seen in Fig. 5, the optimum time for incubation was found to be 20 min for OTA‐induced dissociation of aptamer. Although the incubation time of 5 and 15 min is capable of detecting 1.25 and 0.625 ng/mL of OTA, respectively, but it compromised the LOD of the assay. Conclusively, OTA‐induced dissociation at lower concentration requires 20 min of incubation time.
Figure 5.
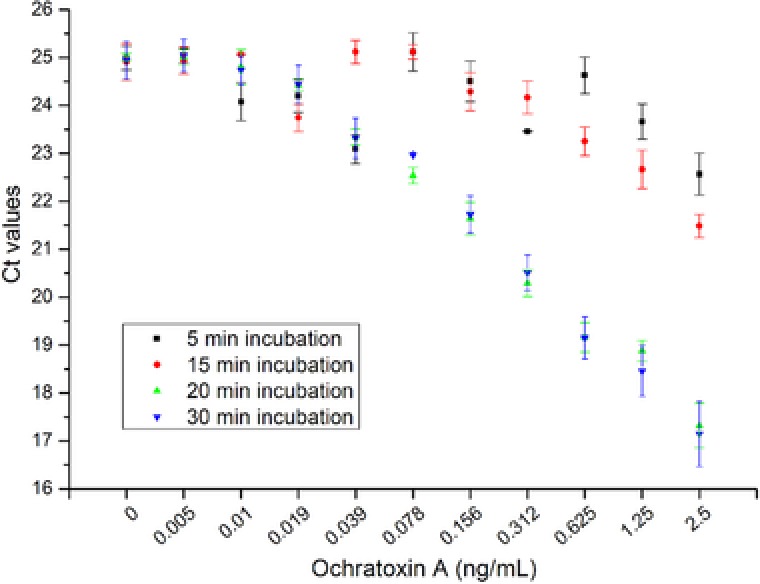
Incubation time investigation of OTA‐induced dissociation of aptamer from the apta‐beads complex. The optimum time for OTA‐induced dissociation was found to be 20 min.
The LOD for OTA detection was found to be 0.009 ng/mL based on 3σ/slope, where σ is the SD of the blank samples of three Apta‐qPCR assays (inset, Fig. 6). One of the notable advantages of Apta‐qPCR includes the broad range of analyte concentration detection ranging from 0.039 to 1000 ng/mL, which reduced the need of dilution steps (Fig. 6). Interestingly, OTA aptamer was reported to exhibit a K d value of 144.57 ng/mL and a dynamic range of 8.07–2000 ng/mL using equilibrium dialysis 24. In addition, different dynamic range of OTA detection has been reported with different assay formats using the OTA aptamer (Table 2). Apta‐qPCR assay resulted in higher sensitivity by using qPCR to detect the oligonucleotides. In Apta‐qPCR assay, the signal (here, the concentration of dissociated aptamer) is amplified with the help of qPCR, which is not the case in traditional fluorescence, plasmonic, colorimetric, and electrochemical assays, where the measurement is limited to the aptamer‐target binding and the changes due to the interactions in 1:1 ratio. To investigate the specificity of the assay, Ct‐value obtained for 10 ng/mL OTA was compared with 100 ng/mL ochratoxin B. The Ct‐value obtained for 100 ng/mL ochratoxin B was found to be 23.3 and the Ct values with 10 ng/mL OTA was found to be 15.18. This observation clearly indicates the specificity of Apta‐qPCR assay for the detection of OTA.
Figure 6.
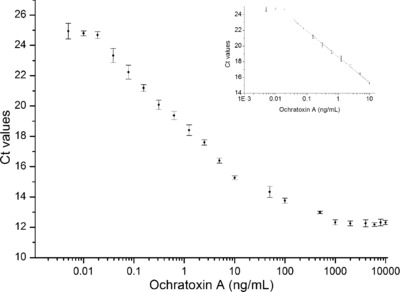
The aptamer‐dissociation from apta‐beads complex in response to OTA addition. The decrease in Ct in response to higher OTA concentrations reflects to the dissociation of aptamer from apta‐beads complex into the supernatant. The assay was able to detect OTA with the linear relationship of Ct values from 0.039–1000 ng/mL, R 2 = 0.95. The LOD of the Apta‐qPCR was found to be 0.009 ng/mL OTA as shown in inset figure.
Table 2.
Comparison of recent aptamer‐based assays for the detection of Ochratoxin A
| Method | LOD | Detection range | Ref. |
|---|---|---|---|
| Chemiluminescence resonance energy transfer (CRET) aptasensor | 0.22 ng/mL | 0.1–100 ng/mL | 11 |
| Luminescence resonance energy transfer‐based aptasensor | 0.027 ng/mL | 0.05–100 ng/mL | 31 |
| Single‐walled carbon nanohorn aptasensor | 7.36 ng/mL | 8.56–2140 ng/mL | 39 |
| Monolithically integrated optoelectronic aptasensor | 2 ng/mL | 4–100 ng/mL | 27 |
| Picogreen dye‐based fluroscence aptasensor | 0.058 ng/mL | 0.128–4 ng/mL | 25 |
| Fluorescence‐based nanographite sensing | 8 ng/mL | 8.5–171 ng/mL | 26 |
| Dot immunogold filtration assay | 10 ng/mL | 20–1000 ng/mL | 30 |
| SPR | 0.01 ng/mL | 0.05–10 ng/mL | 29 |
| Impedimetric immunosensor | 0.01 ng/mL | 0.05–5 ng/mL | 40 |
| Electrochemical immunosensor | 1 ng/mL | 2.5–100 ng/mL | 41 |
| Apta‐qPCR assay | 0.009 ng/mL | 0.039–1000 ng/mL |
The Apta‐qPCR was further investigated for the applicability to quantify OTA in complex beer samples. Different concentrations of OTA were spiked in beer and the assay was able to detect 0.078 ng/mL OTA in beer (inset, Fig. 7). The reason behind the higher LOD in beer samples can be explained from microscale thermophoresis analysis of aptamer interaction with OTA 20. In brief, the presence of beer in the selection buffer affected the K d‐value of the aptamer for OTA binding. As mentioned in the previous work of our group, the presence 25% beer in the buffer changed the K d‐value of from 13 ng/mL (K d‐value in selection buffer) to 98.4 ng/mL. The assay demonstrated the broad range of OTA concentrations detection from 0.1 to 1000 ng/mL in complex beer samples (Fig. 7). A comparison of the developed Apta‐qPCR assay with other recent aptamer‐based assays for the detection of OTA is shown in Table 2. The detection performances have been improved in terms of sensitivity and the broad range of detection in comparison to previously reported assays using aptamers/antibodies. Our present Apta‐qPCR assay relies on the TID where labeling and the covalent immobilization of the aptamer are not required.
Figure 7.
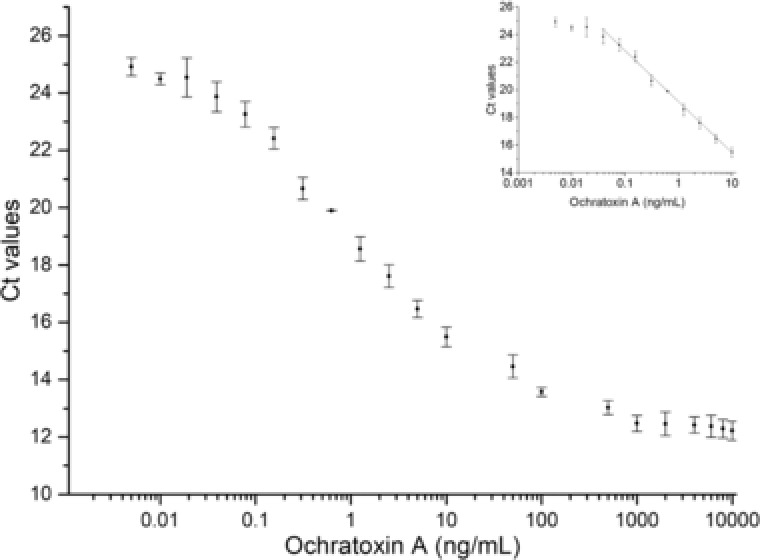
The aptamer‐dissociation from apta‐beads complex in response to spiked OTA in beer. The decrease in Ct value in response to higher OTA concentrations reflects to the dissociation of aptamer from apta‐beads complex into the supernatant. The assay was able to detect OTA with the linear relationship of Ct values from 0.1 to 1000 ng/mL, R 2 = 0.95. The LOD of the Apta‐qPCR was found to be 0.078 ng/mL OTA as shown in inset figure.
4. Concluding remarks
In this work, the Apta‐qPCR assay has been used for the quantification of OTA for the first time. The Apta‐qPCR assay is based on TID of a complementary oligonucleotide from the aptamer. Here, the presence of OTA results in dissociation of the complementary oligonucleotide from the aptamer and, in turn, release of the aptamer from the dT‐modified beads. OTA‐bound aptamers were easily separated from the dT beads using a magnetic stand and quantified in the supernatant using qPCR. As discussed previously, aptamers offer an important advantage as they can be easily amplified, which allows the quantification of a minute amount of dissociated aptamer by qPCR. The assay resulted in a LOD of 0.009 ng/mL for OTA. The advantage of using qPCR for the assay gave broad range of OTA detection from 0.039 to 1000 ng/mL using Apta‐qPCR assay, which reduces the requirement of dilution steps. In this work, the assay has been also optimized to detect OTA in complex samples. The advantages of the assay also include no requisite of labeling and covalent immobilization of the aptamer. Additionally, the assay needs low sample volumes (6.25 μL) and the detection of OTA in one sample costs approximately € 0.70 based on the costs of chemicals and biomolecules used in the assay. With an assay time of 2.5 h, the assay is not rapid in comparison to many other reported assays, but Apta‐qPCR provides high sensitivity with a broad range of detection in a robust way. An alternative way to quantify oligonucleotides in comparison to qPCR can reduce the detection time. The Apta‐qPCR shown here can be easily extended for detecting other molecules as long as a specific aptamer is available.
Practical application
Ochratoxin A (OTA) is a prominent mycotoxin, ubiquitously present in a variety of crops. There is an urgent need to develop a robust, rapid, and highly sensitive method for Ochratoxin detection. Aptamers developed against OTA have been successfully used in various applications. In addition, recent applications of various aptamers show the potential to substitute antibodies due to its reduced production cost and high stability. In this study, an aptamer‐assisted real‐time PCR‐based assay (Apta‐qPCR) is realized for the detection of OTA following target‐induced dissociation from complementary oligonucleotides. Apta‐qPCR assay features sensitive, robust, and selective detection of OTA and has potential to be used in complex samples. Moreover, the described assay can be easily transferred to the detection of other small molecules with corresponding aptamers.
The authors have declared no conflicts of interest.
Acknowledgments
The German Research Foundation (DFG—SCHE 279/32‐1) supported parts of this work. German Academic Exchange Service (DAAD) is acknowledged for the financial support to Harshvardhan Modh.
5 References
- 1. Duan, N. , Wu, S.J. , Dai, S.L. , Gu, H.J. , et al., Advances in aptasensors for the detection of food contaminants. Analyst 2016, 37, 3942–3961. [DOI] [PubMed] [Google Scholar]
- 2. Anfossi, L. , Giovannoli, C. , Baggiani, C. , Mycotoxin detection. Curr. Opin. Biotech. 2016, 120–126. [DOI] [PubMed] [Google Scholar]
- 3. Del Regno, M. , Adesso, S. , Popolo, A. , Quaroni, A. , et al., Nivalenol induces oxidative stress and increases deoxynivalenol pro‐oxidant effect in intestinal epithelial cells. Toxicol. Appl. Pharm. 2015, 2, 118–127. [DOI] [PubMed] [Google Scholar]
- 4. Krogh, P. , Hald, B. , Plestina, R. , Ceovic, S. , Balkan (endemic) nephropathy and foodborne Ochratoxin A preliminary results of a survey of foodstuffs. Acta Path. Micro. Im. B 1977, 3, 238–240. [DOI] [PubMed] [Google Scholar]
- 5. Pfohl‐Leszkowicz, A. , Manderville, R.A. , Ochratoxin A, An overview on toxicity and carcinogenicity in animals and humans. Mol. Nutr. Food Res. 2007, 1, 61–99. [DOI] [PubMed] [Google Scholar]
- 6. World Health Organization, and International Agency for Research on Cancer . Some naturally occurring substances: food items and constituents, heterocyclic aromatic amines and mycotoxins IARC Monographs on the Evaluation of Carcinogenic Risk of Chemicals to Humans. 1993. [Google Scholar]
- 7. Commission Regulation (EC) No 1881/2006 of 19 December 2006 setting maximum levels for certain contaminants in foodstuffs. Offic. J. Eur. Union 2006, 5–24. [Google Scholar]
- 8. Commission Recommendation (EU) 2016/1319 of 29 July 2016 amending Recommendation 2006/576/EC as regards deoxynivalenol, zearalenone and ochratoxin A in pet food. Offic. J. Eur. Union 2016, 58–60. [Google Scholar]
- 9. Aresta, A. , Vatinno, R. , Palmisano, F. , Zambonin, C.G. , Determination of ochratoxin A in wine at sub ng/mL levels by solid‐phase microextraction coupled to liquid chromatography with fluorescence detection. J Chromatogr A 2006, 1–2, 196–201. [DOI] [PubMed] [Google Scholar]
- 10. Visconti, A. , Pascale, M. , Centonze, G. , Determination of ochratoxin A in wine by means of immunoaffinity column clean‐up and high‐performance liquid chromatography. J. Chromatogr A 1999, 1, 89–101. [DOI] [PubMed] [Google Scholar]
- 11. Jo, E.J. , Mun, H. , Kim, S.J. , Shim, W.B. et al., Detection of ochratoxin A (OTA) in coffee using chemiluminescence resonance energy transfer (CRET) aptasensor. Food Chem. 2016, 194, 1102–1107. [DOI] [PubMed] [Google Scholar]
- 12. Lee, B.H. , Nguyen, V.T. , Gu, M.B. , Highly sensitive detection of 25‐HydroxyvitaminD3 by using a target‐induced displacement of aptamer. Biosens. Bioelectron. 2017, 88, 174–180. [DOI] [PubMed] [Google Scholar]
- 13. Zeng, Y.B. , Zhou, Y. , Kong, L. , Zhou, T.S. et al., A novel composite of SiO2‐coated graphene oxide and molecularly imprinted polymers for electrochemical sensing dopamine. Biosens. Bioelectron. 2013, 45, 25–33. [DOI] [PubMed] [Google Scholar]
- 14. Modh, H.B. , Bhadra, A.K. , Patel, K.A. , Chaudhary, R.K. et al., Specific detection of tetanus toxoid using an aptamer‐based matrix. J. Biotechnol. 2016, 15–21. [DOI] [PubMed] [Google Scholar]
- 15. Urmann, K. , Walter, J.G. , Scheper, T. , Segal, E. , Label‐free optical biosensors based on aptamer‐functionalized porous silicon scaffolds. Anal Chem. 2015, 3, 1999–2006. [DOI] [PubMed] [Google Scholar]
- 16. Tria, S.A. , Lopez‐Ferber, D. , Gonzalez, C. , Bazin, I. et al., Microfabricated biosensor for the simultaneous amperometric and luminescence detection and monitoring of Ochratoxin A. Biosens. Bioelectron. 2016, 835–842. [DOI] [PubMed] [Google Scholar]
- 17. Walter, J.‐G. , Heilkenbrinker, A. , Austerjost, J. , Timur, S. , et al., Aptasensors for small molecule detection. Z. Naturforsch. B 2012, 10, 976–986. [Google Scholar]
- 18. Kim, Y.S. , Raston, N.H.A. , Gu, M.B. , Aptamer‐based nanobiosensors. Biosens. Bioelectron. 2016, 2–19. [DOI] [PubMed] [Google Scholar]
- 19. Walter, J.G. , Stahl, F. , Scheper, T. , Aptamers as affinity ligands for downstream processing. Eng. Life Sci. 2012, 5, 496–506. [Google Scholar]
- 20. Schax, E. , Lonne, M. , Scheper, T. , Belkin, S. et al., Aptamer‐based depletion of small molecular contaminants: A case study using ochratoxin A. Biotechnol. Bioproc. E. 2015, 6, 1016–1025. [Google Scholar]
- 21. Urmann, K. , Arshavsky‐Graham, S. , Walter, J.G. , Scheper, T. et al., Whole‐cell detection of live lactobacillus acidophilus on aptamer‐decorated porous silicon biosensors. Analyst 2016, 18, 5432–5440. [DOI] [PubMed] [Google Scholar]
- 22. Seleci, D.A. , Seleci, M. , Jochums, A. , Walter, J.G. , et al., Aptamer mediated niosomal drug delivery. R. Soc. Chem. Adv. 2016, 91, 87910–87918. [Google Scholar]
- 23. Zhou, W.Z. , Huang, P.J.J. , Ding, J.S. , Liu, J. , Aptamer‐based biosensors for biomedical diagnostics. Analyst 2014, 11, 2627–2640. [DOI] [PubMed] [Google Scholar]
- 24. Cruz‐Aguado, J.A. , Penner, G. , Determination of ochratoxin a with a DNA aptamer. J. Agric. Food Chem. 2008, 22, 10456–10461. [DOI] [PubMed] [Google Scholar]
- 25. Nameghi, M.A. , Danesh, N.M. , Ramezani, M. , Hassani, F.V. , et al., A fluorescent aptasensor based on a DNA pyramid nanostructure for ultrasensitive detection of ochratoxin A. Anal. Bioanal. Chem. 2016, 21, 5811–5818. [DOI] [PubMed] [Google Scholar]
- 26. Wei, Y. , Zhang, J. , Wang, X. , Duan, Y.X. , Amplified fluorescent aptasensor through catalytic recycling for highly sensitive detection of ochratoxin A. Biosens. Bioelectron. 2015, 65, 16–22. [DOI] [PubMed] [Google Scholar]
- 27. Pagkali, V. , Petrou, P.S. , Salapatas, A. , Makarona, E. et al., Detection of ochratoxin A in beer samples with a label‐free monolithically integrated optoelectronic biosensor. J Hazard Mater. 2017, 323, 75–83. [DOI] [PubMed] [Google Scholar]
- 28. Jiang, L. , Qian, J. , Yang, X.W. , Yan, Y.T. et al., Amplified impedimetric aptasensor based on gold nanoparticles covalently bound graphene sheet for the picomolar detection of ochratoxin A. Anal. Chim. Acta 2014, 806, 128–135. [DOI] [PubMed] [Google Scholar]
- 29. Zhu, Z. , Feng, M. , Zuo, L. , Zhu, Z. et al., An aptamer based surface plasmon resonance biosensor for the detection of ochratoxin A in wine and peanut oil. Biosens. Bioelectron. 2015, 65, 320–326. [DOI] [PubMed] [Google Scholar]
- 30. Chen, W. , Jin, Y. , Liu, A. , Wang, X. et al., Rapid detection of ochratoxin A on membrane by dot immunogold filtration assay. J. Sci. Food Agric. 2016, 2, 610–614. [DOI] [PubMed] [Google Scholar]
- 31. Dai, S.L. , Wu, S.J. , Duan, N. , Wang, Z.P. , A luminescence resonance energy transfer based aptasensor for the mycotoxin Ochratoxin A using upconversion nanoparticles and gold nanorods. Microchim. Acta 2016, 6, 1909–1916. [Google Scholar]
- 32. Guo, L.M. , Hao, L.H. , Zhao, Q. , An aptamer assay using rolling circle amplification coupled with thrombin catalysis for protein detection. Anal. Bioanal. Chem. 2016, 17, 4715–4722. [DOI] [PubMed] [Google Scholar]
- 33. Ma, C.P. , Wang, W.S. , Mulchandani, A. , Shi, C. , A simple colorimetric DNA detection by target‐induced hybridization chain reaction for isothermal signal amplification. Anal Biochem. 2014, 19–23. [DOI] [PubMed] [Google Scholar]
- 34. Yu, H.X. , Canoura, J. , Guntupalli, B. , Lou, X.H. et al., A cooperative‐binding split aptamer assay for rapid, specific and ultra‐sensitive fluorescence detection of cocaine in saliva. Chem. Sci. 2017, 1, 131–141. [DOI] [PMC free article] [PubMed] [Google Scholar]
- 35. Yang, L. T. , Ellington, A. D. , Real‐time PCR detection of protein analytes with conformation‐switching aptamers. Anal. Biochem. 2008, 2, 164–173. [DOI] [PMC free article] [PubMed] [Google Scholar]
- 36. Lv, L. , Li, D. H. , Cui, C. B. , Zhao, Y. Y. et al., Nuclease‐aided target recycling signal amplification strategy for ochratoxin A monitoring. Biosens. Bioelectron. 2017, 136–141. [DOI] [PubMed] [Google Scholar]
- 37. Modh, H. , Witt, M. , Urmann, K. , Lavrentieva, A. et al., Aptamer‐based detection of adenosine triphosphate via qPCR. Talanta 2017, 199–205. [DOI] [PubMed] [Google Scholar]
- 38. Chen, J. H. , Fang, Z. Y. , Liu, J. , Zeng, L. W. , A simple and rapid biosensor for ochratoxin A based on a structure‐switching signaling aptamer. Food Control 2012, 2, 555–560. [Google Scholar]
- 39. Lv, L. , Cui, C. B. , Liang, C. Y. , Quan, W. R. , et al., Aptamer‐based single‐walled carbon nanohorn sensors for ochratoxin A detection. Food Control 2016, 296–301. [Google Scholar]
- 40. Malvano, F. , Albanese, D. , Pilloton, R. , Di Matteo, M. , A highly sensitive impedimetric label free immunosensor for Ochratoxin measurement in cocoa beans. Food Chem. 2016, 688–694. [DOI] [PubMed] [Google Scholar]
- 41. Badea, M. , Floroian, L. , Restani, P. , Cobzac, S. C. A. et al., Ochratoxin A detection on antibody‐immobilized on BSA‐functionalized gold electrodes. Plos One. 2016, 7. [DOI] [PMC free article] [PubMed] [Google Scholar]


