Abstract
MiRNAs are endogenous noncoding RNA molecules. They play important gene‐regulatory roles by binding to the mRNA of target genes thereby leading to either transcript degradation or translational repression. In virtually all diseases, distinct alterations of miRNA expression profiles have been found thus suggesting miRNAs as interesting biomarkers. Here, we present an SPR biosensor that utilizes disposable, injection‐molded sensor chip/microfluidic hybrids combined with a lateral imaging optical system for parallel analysis of three one‐dimensional spot arrays to detect miRNA‐93. To increase the sensitivity of the biosensor we used two different amplification strategies. By adding an RNA‐DNA‐hybrid antibody for primary signal amplification, a limit of detection of 10 pmol/L was achieved. Based on that method we demonstrate the detection of miRNA‐93 in total RNA lysate from HEK‐293 cells. Utilizing an enzymatic signal amplification with Poly(A) polymerase, the sensitivity could be increased even further leading to a limit of detection of 1 fmol/L.
Keywords: Biochip, miRNA, Molecular diagnostics, SPR, Surface plasmon resonance
Abbreviations
- DNA
deoxyribonucleic acid
- LNA
locked nucleic acid
- miRNA
micro ribonucleic acid
- PCR
polymerase chain reaction
- RNA
ribonucleic acid
- RT‐PCR
real‐time polymerase chain reaction
- SPR
Surface Plasmon Resonance
1. Introduction
In the past decades, optical sensing approaches have been developed intensively because of their ability for fast, multiplexed detection. Besides methods exploiting e.g. fluorescent labels, label‐free sensors feature the detection of biomolecules in their native form and offer to obtain kinetic information as well. Integrated interferometers, waveguides, resonator and reflection based devices 1 have been established. Because of its high sensitivity and robustness along with a rather simple sensor set‐up consisting of a thin metal layer only, Surface Plasmon Resonance (SPR) has been established as the standard method in label‐free optical detection schemes 2, 3, 4, 5, 6.
Recently SPR was also used for the detection of miRNAs 7, 8. These endogenous, noncoding RNA molecules reduce the expression of target genes by binding to the untranslated region of their mRNAs thereby inducing either transcript degradation or translational repression. Therefore, miRNAs are important regulation molecules of virtually all biological functions, and alterations of miRNA expression profiles lead to disturbances of the cellular homeostasis 9, 10, 11. Dysregulated miRNA signaling pathways have been found in many diseases, particularly in oncological 12, 13, 14, 15, cardiovascular 16, 17, neurological 18, 19, 20 or immunological disorders 21, 22. Specific disease patterns are associated with distinctive miRNA expression profiles, qualifying miRNAs as excellent diagnostic markers 23, 24. Furthermore, there are also attempts to use miRNA as therapeutic agents 25, 26 or for reprogramming immune responses 27. Thus, the development of diagnostic and therapeutic strategies based on miRNAs is a rapidly expanding field in biomedical research.
A standalone and easy‐to‐use SPR biosensor, developed by Fraunhofer IOF and Fraunhofer IWS, has been successfully used for the rapid detection of different molecular interactions and assays 28, 29, 30, 31. Here, we present the application of a revised version of this biosensor with a new sensor chip/microfluidic hybrid for the specific detection of miRNA‐93 via hybridization to LNA probes. MiRNA‐93 plays a vital role in different types of cancer 32, 33, but also in a variety of other pathological conditions 34, 35. Because of the small size of miRNA molecules, the refractive index change and thus the sensor's response are very low. Therefore, to reduce the limit of detection, we demonstrate two different amplification strategies. One method is based on RNA‐DNA hybrid antibody binding to the LNA‐miRNA double strand, the other one uses Poly(A) polymerase to add an 3′ polyadenine tail to the miRNA.
2. Materials and methods
2.1. SPR sensor chips and microfluidic
In order to achieve low cost disposables, the SPR substrates as well as the micro channels sealing it were designed and fabricated by injection molding. The optical chip contains a prism like region for light coupling, which is combined with added optical functionality to support angular imaging in the optical system. This ensures simple, immersion free handling of the substrate when inserting it into the device. The fabrication of the 60 × 13 × 4 mm3 sized chip substrate was performed by TOPAS injection molding (KDS, Germany). Finally, the substrates were coated by a 45 nm thick gold layer using magnetron sputtering.
The injection molded flow cell combines a hard cover with an elastomer insert in order to create three parallel channels running across the 11 × 3 mm2 wide gold coated region. Each channel exhibits a cross section of 100 μm height and 800 μm width. As shown in Fig. 1, the flow cell design allows one to click it onto the chip after chemical preparation (see Section 2.4) in order to seal the channels and ensure proper position of the fluidics relative to the chip.
Figure 1.
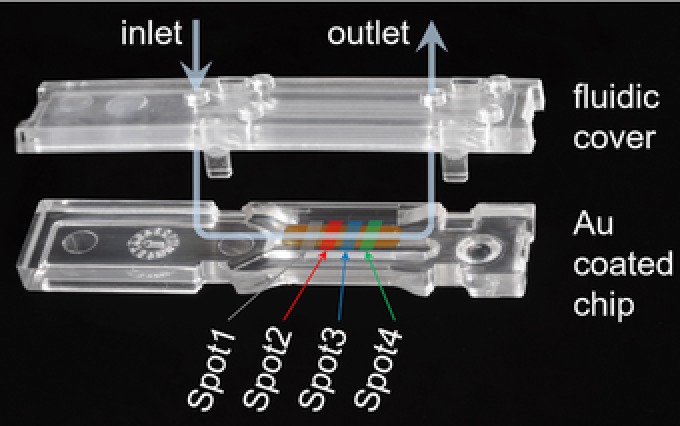
Photograph of the optical SPR chip and the three channel flow cell in open state. The positions of the measurement areas (“spots”) and the flow of the analyte solution are sketched for convenience. Note that the middle channel has been used only.
2.2. SPR biosensor
All SPR experiments were performed on a Fraunhofer SPR sensing system. Inserting and locking the chips in the device ensures (i) correct position with respect to the optical system, (ii) thermal contact to a Peltier based temperature control system, and (iii) fluidic connection to the six in‐ and outlets of the micro channels on the chip. Besides the chip all tubing to guide solution to the chip is temperature controlled in order to avoid the solution temperature to affect the experiment.
The optical readout relies on the approach developed previously 36. In short, the quasi monochromatic reflectivity at 810 nm wavelength is observed angularly resolved in a 4° wide range. A line is illuminated along one microfluidic channel. The reflected light is detected by a CCD array. The detection optics ensures angularly resolved imaging along the rows of the CCD image, while different positions along the microfluidic channel are imaged along the columns of the CCD. Thus, up to 60 spots can be detected simultaneously. The three different micro channels can be illuminated sequentially in order to further increase the number of analyses. External reagents or analytes can be selected by an autosampler (MLE Dresden, Germany) and are pumped through the system by means of a syringe pump (MLE Dresden, Germany).
2.3. SPR chip functionalization
For all experiments the SPR chips were functionalized according to the following procedure. Prior to the immobilization of the capture probes the SPR chips were cleaned for 45 s with gold Surface Cleaning solution (Sigma‐Aldrich, Germany). After washing with deionized H2O and drying under nitrogen flux the chips were separated into four measurement areas (Fig. 1) and were functionalized with 10 μL of two thiol‐modified oligonucleotide probes (10 μmol/L in 60 mmol/L MgCl2, Exiqon, Denmark) and two controls, polyethylene glycol (HO‐PEG‐SH, 10 μmol/L, Iris Biotech, Germany) and Protein A (1 mg/mL, Sigma‐Aldrich, Germany), overnight at 4°C and under humid conditions. Following another washing step with deionized H2O the chips were blocked with HS‐PEG‐OH (10 μmol/L) for 30 min at room temperature and rinsed again with deionized H2O.
The immobilized thiol‐modified oligonucleotide probes for the hybridization experiments were LNA‐93 (5′‐CACGAACAGCACTTTG/iSp9/3ThioMC3‐D‐3′), a locked nucleic acid oligo which can hybridize to miRNA‐93, and the negative controls DNA‐MM‐31 (5′‐ThioMC6‐D/AGCCAAGATGGTGGCAGATCT‐3′), LNA‐31 (5′‐ AGCTATGCCAGCATCTTG/3ThioMC3‐D‐3′) and LNA‐21 (5′‐ ATCGAATAGTCTGACTACAACT/3ThioMC3‐D‐3′). All LNA and DNA oligonucleotides were ordered from Exiqon (Denmark). The sequences were modified with a terminal thiol group for binding the probes onto the chip. In a process called chemisorption a covalent bond between the thiol and the gold surface is formed spontaneously.
2.4. SPR measurements
All SPR measurements were executed using a flow speed of 2.49 μL/s and a temperature of 30°C for the flow cell and the preheating of the tubes. The wash solution and the fluid used for diluting was 60 mmol/L MgCl2. MiRNA‐93 (5′‐CAAAGUGCUGUUCGUGCAGGUAG‐3′) was ordered from Sigma‐Aldrich (Germany) and the RNA‐DNA‐hybrid antibody (ABIN1515114) from antibodies‐online (Germany).
At the start of the experiment, the chip was washed with wash solution. Thereafter, the sample was injected into the flow cell in a total volume of 100 μL, and 25 μL from it were pumped 100 times back and forth across the chip. Next, the chip was washed again with wash fluid before the subsequent injection of the next sample. For the analysis of the binding signals and the calculation of the standard deviation, 100 angular spectra, each obtained from one line of CCD pixels, have been analyzed and averaged for each of the four measurement areas.
Poly(A) polymerase, ATP and the Standard Reaction Buffer for the enzymatic signal amplification were ordered from Affymetrix (United Kingdom) and were prepared freshly before each measurement. For a highly sensitive enzymatic sample solution with a total volume of 250 μL, the following contents were mixed and centrifuged briefly. First, 25 μL of the Standard Reaction Buffer (5×) were diluted with 218.5 μL deionized water for the SPR experiments to lower the refractive index of the solution. After that 4 μL of Poly(A) polymerase (600 units/μL) and 2.5 μL ATP (100 mmol/L) were added to obtain enzyme and substrate concentrations of 9.6 units per microliter and 1 mmol/L, respectively. These conditions were found to be optimal and were used in all further experiments.
2.5. Vector cloning
For overexpression of hsa‐miR‐93, we amplified the precursor of hsa‐miR‐93 by PCR using the following primers: 5′‐CTCGAGCACTGTGGGTACTTGCTGCT‐3′, reverse: 5′‐CTGCAGGTCTCCGCCTCTCAACACTG‐3′ PCR conditions were as follows: Denaturing: 95°C, 2 min; 30 cycles of 95°C for 20 s, 62.9°C for 20 s, 72°C for 30 s and a final extension time of 3 min at 72°C. The resulting PCR products were cloned into the pSC‐B amp/kan vector (Stratagene, Agilent Technologies, USA) according to the manufacturer`s protocol. Subsequently, subcloning into the pmRZsGreen1 miR‐overexpression plasmid was carried out using the Xho1 and Pst restriction sites. The correct vector insert was verified by sequencing (Eurofins Genomics, Ebersberg).
2.6. Transfection, RNA extraction and miR‐quantification by qRT‐PCR
HEK‐293 cells (ATCC, USA) were transfected by electroporation with 10 μg of the hsa‐miR‐93 overexpression construct or an empty vector control and incubated in a humidified incubator at 37°C and 5% CO2. After 36 h, cells were harvested and RNA was extracted using the miRvana™ total RNA isolation kit (Ambion, USA) according to the manufacturer's instructions followed by a DNA digestion step using Turbo DNAse (Ambion, USA). For miR‐quantification by qRT‐PCR, 10 ng of each RNA sample were reversely transcribed using miRNA‐specific stem‐loop primers and the TaqMan microRNA Reverse Trancription Kit (Applied Biosystems, USA). Quantitative RT‐PCR was performed in duplicates on a LightCycler 480 instrument (Roche, Germany). Cycling conditions were as follows: Denaturation at 95°C for 10 min, 45 cycles of 95°C for 15 s, and 60°C for 60 s. U47 RNA was used for normalization of miRNA expression.
3. Results and discussion
3.1. Direct detection of miRNA‐93
First, we determined optimal parameters for SPR chip functionalization and measurement conditions. Thereafter, we characterized the capacity of the SPR biosensor to detect miRNA‐93 binding to immobilized LNA‐93 probes. Therefore, a concentration series of miRNA‐93 diluted in MgCl2 solution ranging from 10−11 mol/L to 10−6 mol/L was sequentially measured on a chip. The SPR chip was rinsed with wash solution before, between and at the end of the measurements and was not regenerated between different concentrations. As shown in Fig. 2, we determined a limit of detection for the hybridization of miRNA‐93 to the LNA‐93 probe in the range of 10 nmol/L.
Figure 2.
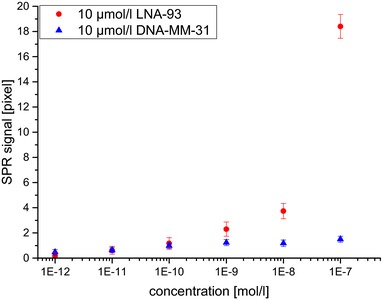
Binding signals for the sequential SPR measurement of the hybridization of different miRNA‐93 concentrations to LNA‐93 and DNA‐MM‐31. Concentrations were as indicated.
3.2. Primary signal amplification using an RNA‐DNA antibody
To improve the limit of detection, we used an RNA‐DNA‐hybrid antibody for primary signal amplification. This antibody only binds to RNA‐DNA double‐strands present on the chip surface and so only induces a signal response after successful hybridization of miRNA‐93 to the LNA probe (Fig. 3).
Figure 3.
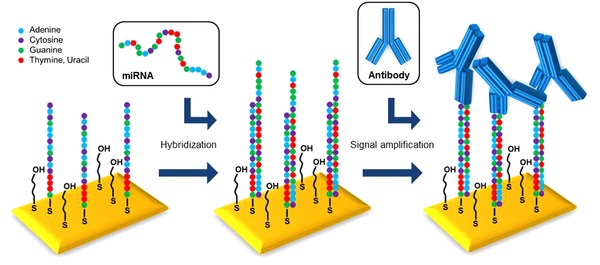
Illustration of the antibody‐enhanced SPR detection of miRNA‐93.
Based on preliminary tests (data not shown), a concentration of 10 μg/mL RNA‐DNA‐hybrid antibody revealed as suitable for amplification and was chosen for injection. After injection of miRNA‐93 (10 nmol/L or 10 pmol/L) and the required washing steps, the antibody solution was pumped onto the sensor (Fig. 4). DNA‐MM‐31 (blue curve) and HS‐PEG‐OH (green curve) represent negative controls to monitor unspecific signals and background. The Protein A coated surface (black curve) acts as a positive control for the amplification antibody using its natural ability to bind the Fc region of antibodies.
Figure 4.
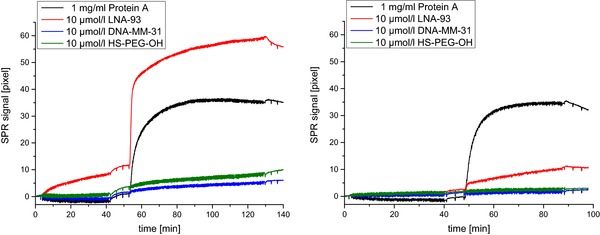
Binding curves for the SPR measurement of 10 nmol/L miRNA‐93 (left) and 10 pmol/L miRNA‐93 (right) followed by signal amplification with 10 μg/mL RNA‐DNA‐hybrid antibody. Black: Protein A, Red: LNA‐93, Blue: DNA‐MM‐31, Green: HS‐PEG‐OH.
As shown in Fig. 4 (left), a specific sensor response during the amplification step, which was proportional to the signal increase during the hybridization step, could be observed. Thus, a signal enhancement for the injection of the RNA‐DNA‐hybrid antibody could be shown. As compared to the direct detection, this strategy led to a much higher sensor response and thus a more specific signal.
Figure 4 (right) shows the measured signals after injection of 10 pmol/L miRNA‐93, clearly illustrating that this approach lowers the limit of detection to a concentration of approximately 10 pmol/L miRNA‐93.
3.3. Detection of miRNA‐93 from RNA cell lysate from HEK‐293 cells
After testing the assay principle with artificial samples we next aimed to validate the system by measuring samples containing biologically active miRNA. To generate sufficient amounts of processed and thus biologically active miRNA‐93, we transiently transfected HEK‐293 cells with the pmRZs Green1 overexpression vector carrying the sequence of miRNA‐93. Subsequent qRT‐PCR analyses revealed a 5.95‐fold overexpression of miRNA‐93 as compared to the pmRZs Green1 control vector. From those HEK cells, we isolated RNA lysates. The stock solutions with HEK‐miRNA‐93 and HEK‐free were diluted down to 1 pg/μL total RNA and measured with SPR and antibody amplification (Fig. 5).
Figure 5.
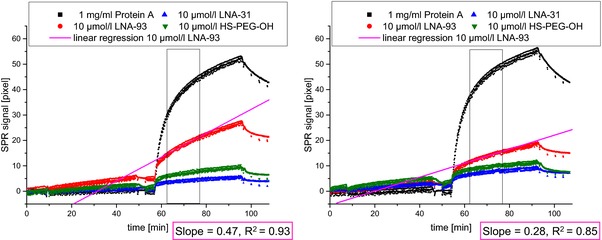
Binding curves for the SPR measurement of HEK‐miRNA‐93 (left) and HEK‐empty (right) followed by signal amplification with RNA‐DNA‐hybrid antibody. The concentration of the HEK samples was 1 pg/μL total RNA. Black: Protein A, Red: LNA‐93, Blue: DNA‐MM‐31, Green: HS‐PEG‐OH.
For the evaluation of the hybridized LNA‐93‐areas followed by signal amplification, the slopes of both measurements were compared. The diffusion limited phase at the beginning of antibody binding was excluded from the evaluation. For fitting the regression line a time frame of 15 minutes of the kinetic controlled phase without mass transport limitation was chosen, indicated by a black rectangle in Fig. 5.
As expected, due to the overexpression of miRNA‐93, the SPR signal and the slope of the binding curve were higher for the HEK‐miRNA‐93 lysate compared to the HEK‐free lysate. As HEK also express a small amount of intrinsic miRNA‐93, controls also evoked a detectable albeit much smaller signal.
3.4. Primary signal amplification with Poly(A) polymerase
We next investigated an enzymatic approach as an alternative method to improve the limit of detection. For that, we used Poly(A) polymerase which adds a 3' polyadenine tail to single‐stranded RNA. We immobilized an LNA‐93 probe that was seven nucleotides shorter than the miRNA to be detected (miRNA‐93). This strategy leads to a single‐strand overhang after successful hybridization, which serves as a binding site for the Poly(A) polymerase enzyme (Fig. 6).
Figure 6.
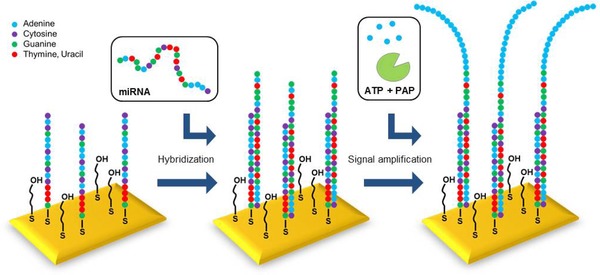
Illustration of the enzyme‐enhanced SPR detection of miRNA‐93.
After washing with wash solution, we first injected the Poly(A) polymerase as a negative control giving rise to 54±6 pixels on all spots. Subsequently, we measured the hybridization of 1 fmol/L miRNA‐93 directly, followed by injection of Poly(A) polymerase. This approach led to a specific signal increase on the LNA‐93 spots of around 80 pixels. Finally, 10 fmol/L miRNA‐93 were injected followed again by Poly(A) polymerase for signal amplification, which evoked an increase of additional 120 pixels after washing. In Fig. 7, the measurement of the enzymatic signal amplification is shown.
Figure 7.
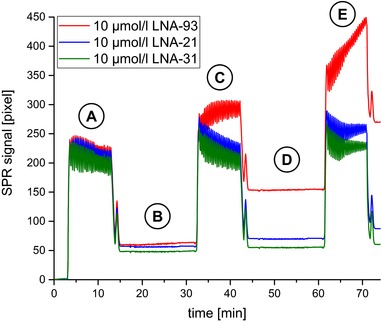
Binding curves for the SPR measurement of miRNA‐93 and specific signal amplification with Poly(A) polymerase. (A) injection of Poly(A) polymerase; (B) injection of 1 fmol/L miRNA‐93; (C) injection of Poly(A) polymerase; (D) injection of 10 fmol/l miRNA‐93; (E) injection of Poly(A) polymerase.
4. Concluding remarks
Surface plasmon resonance biosensors are widely used for the detection of various molecules and markers due to their high sensitivity, the rapid and label‐free real‐time detection and their capability for parallelization of measurements.
Using our revised compact SPR biosensor platform, we could successfully develop an assay for the detection of miRNA‐93 utilizing LNA probes immobilized on SPR‐chips. The limit of detection for the direct label‐free hybridization of miRNA‐93 was in the range of 10 nmol/L. The sensitivity of the miRNA detection assay could be further improved by applying two different strategies for signal amplification: (i) Addition of an amplification step using an RNA‐DNA‐hybrid antibody binding to the LNA‐RNA double strand after successful hybridization of miRNA‐93 enhanced specific signal recognition by three orders of magnitude and lowered the limit of detection to at least 10 pmol/L miRNA‐93. This method was capable to specifically discriminate miRNA‐93 levels in RNA lysates from HEK‐293 cell cultures and HEK‐293 cell cultures overexpressing miRNA‐93. (ii.) As a second method to lower the limit of detection, enzymatic signal amplification by Poly(A) polymerase was used, which adds an 3' polyadenine tail to the miRNA‐93 after binding to the LNA probe. This approach increased the sensitivity even further leading to a limit of detection of around 1 fmol/L.
Future projects will address the challenge of detecting miRNA expression profiles by exploiting the imaging features of the sensor system 37. Furthermore, advanced optical approaches 38, 39 as well as additional methods for the primary or even secondary amplification of the signal will be examined to further reduce the limit of detection.
Practical application
During the last few years, miRNAs have gained importance as useful clinical biomarkers for diagnosis and prognosis of specific diseases, and to monitor treatment responses. Their expression is tissue and disease specific, they are highly stable high even when released into the circulation, and ‐ due to their abundance in almost all body fluids ‐ they can easily be accessed. Although in almost all clinical fields miRNAs have successfully been identified as biomarkers, they have not made their way into clinical practice so far, which is mainly due to a lack of a reliable and easy‐to‐handle measuring method. We here present a compact SPR sensor system, using disposable polymer chips and flow cells, which fill up this gap. Combined with enzymatic signal amplification, the sensor systems allows for ultrasensitive detection of miRNAs. As a proof of principle, we reliably detected miRNA‐93 with a limit of detection of 1 fmol/L.
The authors thank Thomas Schubert from KDS Radeberger Präzisions‐Formen und Werkzeugbau GmbH for the fabrication and assistance with the sensor chip/microfluidic hybrids.
The authors have declared no conflict of interest.
Acknowledgments
This work has been funded under Grant ‘‘DEMOST” (13N12848) by the BMBF (German ministry of education and research).
5 References
- 1. Fan, X. , White, I. M. , Shopova, S. I. , Zhu, H. et al., Sensitive optical biosensors for unlabeled targets: a review. Analyt. Chim. Acta 2008, 620, 8–26. [DOI] [PMC free article] [PubMed] [Google Scholar]
- 2. Guo, X. , Surface plasmon resonance based biosensor technique: a review. J. Biophoton. 2012, 5 (7), 483–501. [DOI] [PubMed] [Google Scholar]
- 3. Homola, J. , Present and future of surface plasmon resonance biosensors. Analyt. Bioanalyt. Chem. 2003, 377 (3), 528–539. [DOI] [PubMed] [Google Scholar]
- 4. Mariani, S. , Minunni, M. , Surface plasmon resonance applications in clinical analysis. Analyt. Bioanalyt. Chem. 2014, 406 (9‐10), 2303–2323. [DOI] [PMC free article] [PubMed] [Google Scholar]
- 5. Nguyen, H. H. , Park, J. , Kang, S. , Kim, M. , Surface plasmon resonance: a versatile technique for biosensor applications. Sensors 2015. (Basel, Switzerland: ), 15 (5), 10481–10510. [DOI] [PMC free article] [PubMed] [Google Scholar]
- 6. Šípová, H. , Homola, J. , Surface plasmon resonance sensing of nucleic acids: a review. Analyt. Chim. Acta 2013, 773, 9–23. [DOI] [PubMed] [Google Scholar]
- 7. Fang, S. , Lee, H. J. , Wark, A. W. , Corn, R. M. , Attomole microarray detection of microRNAs by nanoparticle‐amplified SPR imaging measurements of surface polyadenylation reactions. J. Am. Chem. Soc. 2006, 128 (43), 14044–14046. [DOI] [PMC free article] [PubMed] [Google Scholar]
- 8. Sípová, H. , Zhang, S. , Dudley, A. M. , Galas, D. et al., Surface plasmon resonance biosensor for rapid label‐free detection of microribonucleic acid at subfemtomole level. Analyt. Chem. 2010, 82 (24), 10110–10115. [DOI] [PMC free article] [PubMed] [Google Scholar]
- 9. Baek, D. , Villén, J. , Shin, C. , Camargo, F. D. et al., The impact of microRNAs on protein output. Nature 2008, 455 (7209), 64–71. [DOI] [PMC free article] [PubMed] [Google Scholar]
- 10. Bartel, D. P. , MicroRNAs: target recognition and regulatory functions. Cell 2009, 136 (2), 215–233. [DOI] [PMC free article] [PubMed] [Google Scholar]
- 11. Dong, H. , Lei, J. , Ding, L. , Wen, Y. et al., MicroRNA: function, detection, and bioanalysis. Chem. Rev. 2013, 113 (8), 6207–6233. [DOI] [PubMed] [Google Scholar]
- 12. Catuogno, S. , Esposito, C. L. , Quintavalle, C. , Cerchia, L. et al., Recent advance in biosensors for microRNAs detection in cancer. Cancers 2011, 3 (4), 1877–1898. [DOI] [PMC free article] [PubMed] [Google Scholar]
- 13. Chen, X. , Ba, Y. , Ma, L. , Cai, X. et al., Characterization of microRNAs in serum. A novel class of biomarkers for diagnosis of cancer and other diseases. Cell Res. 2008, 18 (10), 997–1006. [DOI] [PubMed] [Google Scholar]
- 14. Hayes, J. , Peruzzi, P. P. , Lawler, S. , MicroRNAs in cancer: biomarkers, functions and therapy. Trend. mol. Med. 2014, 20 (8), 460–469. [DOI] [PubMed] [Google Scholar]
- 15. Sundarbose, K. , Kartha, R. , Subramanian, S. , MicroRNAs as biomarkers in cancer. Diagnostics 2013, 3 (1), 84–104. [DOI] [PMC free article] [PubMed] [Google Scholar]
- 16. Bronze‐da‐Rocha, E. , MicroRNAs expression profiles in cardiovascular diseases. BioMed. Res. Internat. 2014, 2014, 985408. [DOI] [PMC free article] [PubMed] [Google Scholar]
- 17. Fichtlscherer, S. , Rosa, S. de , Fox, H. , Schwietz, T. , et al., Circulating microRNAs in patients with coronary artery disease. Circulat. Res. 2010, 107 (5), 677–684. [DOI] [PubMed] [Google Scholar]
- 18. Dong, H. , Li, J. , Huang, L. , Chen, X. et al., Serum MicroRNA profiles serve as novel biomarkers for the diagnosis of Alzheimer's disease. Disease Markers 2015, 2015, 625659. [DOI] [PMC free article] [PubMed] [Google Scholar]
- 19. Gehrke, S. , Imai, Y. , Sokol, N. , Lu, B. , Pathogenic LRRK2 negatively regulates microRNA‐mediated translational repression. Nature 2010, 466 (7306), 637–641. [DOI] [PMC free article] [PubMed] [Google Scholar]
- 20. Wang, W. , Kwon, E. J. , Tsai, L.‐H. , MicroRNAs in learning, memory, and neurological diseases. Learning Memory 2012. (Cold Spring Harbor, N.Y.) 19 (9), 359–368. [DOI] [PubMed] [Google Scholar]
- 21. Pauley, K. M. , Cha, S. , Chan, E. K. L. , MicroRNA in autoimmunity and autoimmune diseases. J. Autoimmun. 2009, 32 (3‐4), 189–194. [DOI] [PMC free article] [PubMed] [Google Scholar]
- 22. Tili, E. , Michaille, J.‐J. , Costinean, S. , Croce, C. M. , MicroRNAs, the immune system and rheumatic disease. Nat. Clin. Practice Rheumatol. 2008, 4 (10), 534–541. [DOI] [PubMed] [Google Scholar]
- 23. Chevillet, J. , Lee, I. , Briggs, H. , He, Y. et al., Issues and prospects of microRNA‐based biomarkers in blood and other body fluids. molecules 2014, 19 (5), 6080–6105. [DOI] [PMC free article] [PubMed] [Google Scholar]
- 24. Lan, H. , Lu, H. , Wang, X. , Jin, H. , MicroRNAs as potential biomarkers in cancer: opportunities and challenges. BioMed Res. Internat. 2015, 2015, 125094. [DOI] [PMC free article] [PubMed] [Google Scholar]
- 25. Esau, C. C. , Monia, B. P. , Therapeutic potential for microRNAs. Advanced Drug Delivery Rev. 2007, 59 (2‐3), 101–114. [DOI] [PubMed] [Google Scholar]
- 26. Kota, S. K. , Balasubramanian, S. , Cancer therapy via modulation of micro RNA levels: a promising future. Drug Discovery Today 2010, 15 (17‐18), 733–740. [DOI] [PubMed] [Google Scholar]
- 27. Cubillos‐Ruiz, J. R. , Rutkowski, M. R. , Tchou, J. , Conejo‐Garcia, J. R. , Reprogramming immune responses via microRNA modulation. MicroRNA Diagnost. Therapeut. 2013, 1 (1), 1–11. [DOI] [PMC free article] [PubMed] [Google Scholar]
- 28. Florschütz, K. , Schröter, A. , Schmieder, S. , Chen, W. et al., ‘Phytochip’: on‐chip detection of phytopathogenic RNA viruses by a new surface plasmon resonance platform. J. Virolog. Meth. 2013, 189 (1), 80–86. [DOI] [PubMed] [Google Scholar]
- 29. Henseleit, A. , Schmieder, S. , Bley, T. , Sonntag, F. et al., A compact and rapid aptasensor platform based on surface plasmon resonance. Eng. Life Sci. 2011, 11 (6), 573–579. [Google Scholar]
- 30. Henseleit, A. , Pohl, C. , Bley, T. , Boschke, E. , Monitoring human serum albumin cell cultures using surface plasmon resonance (SPR) spectroscopy. J. Sens. Sens. Syst. 2015, 4 (1), 77–83. [Google Scholar]
- 31. Sonntag, F. , Schmieder, S. , Danz, N. , Mertig, M. et al., Novel lab‐on‐a‐chip system for the label‐free detection of DNA hybridization and protein‐protein interaction by surface plasmon resonance (SPR), Proc. SPIE 7365, Bioengineered and Bioinspired Systems IV, 73650Q (2009/05/26).
- 32. Fang, L. , Du, W. W. , Yang, W. , Rutnam et al., MiR‐93 enhances angiogenesis and metastasis by targeting LATS2. Cell cycle 2012. (Georgetown, Tex.), 11 (23), 4352–4365. [DOI] [PMC free article] [PubMed] [Google Scholar]
- 33. Hu, J. , Xu, J. , Wu, Y. , Chen, Q. , et al., Identification of microRNA‐93 as a functional dysregulated miRNA in triple‐negative breast cancer. Tum. Biol. 2015, 36 (1), 251–258. [DOI] [PubMed] [Google Scholar]
- 34. Long, J. , Wang, Y. , Wang, W. , Chang, B. H. J. , et al., Identification of microRNA‐93 as a novel regulator of vascular endothelial growth factor in hyperglycemic conditions. J. Biological Chem. 2010, 285 (30), 23457–23465. [DOI] [PMC free article] [PubMed] [Google Scholar]
- 35. Sathyapalan, T. , David, R. , Gooderham, N. J. , Atkin, S. L. , Increased expression of circulating miRNA‐93 in women with polycystic ovary syndrome may represent a novel, non‐invasive biomarker for diagnosis. Scientific Reports 2015, 5, 16890. [DOI] [PMC free article] [PubMed] [Google Scholar]
- 36. Danz, N. , Kick, A. , Sonntag, F. , Schmieder, S. et al., Surface plasmon resonance platform technology for multi‐parameter analyses on polymer chips. Eng. Life Sci. 2011, 11 (6), 566–572. [Google Scholar]
- 37. Kick, A. , Boensch, M. , Katzschner, B. , Voigt, J. et al., DNA microarrays for hybridization detection by surface plasmon resonance spectroscopy. Biosens. Bioelectronics 2010, 26 (4), 1543–1547. [DOI] [PubMed] [Google Scholar]
- 38. Rizzo, R. , Danz, N. , Michelotti, F. , Maillart, E. , et al., Optimization of angularly resolved Bloch surface wave biosensors. Optics Express 2014, 22 (19) 23202–23214. [DOI] [PubMed] [Google Scholar]
- 39. Sinibaldi, A. , Fieramosca, A. , Rizzo, R. , Anopchenko, A. et al., Combining label‐free and fluorescence operation of Bloch surface wave optical sensors. Optics Express 2014, 39 (10) 2947–2950. [DOI] [PubMed] [Google Scholar]


