Abstract
The primary task of process development is a process design that guarantees product quality and maximizes product quantity. One part of the process development is the identification of critical process parameters. Especially in cell culture processes, unwanted cell damage as critical process parameter is still challenging in stirred tank reactors and needs therefore to be considered. Nevertheless, this topic and its effects on process performance are currently not well discussed and not verified in literature until now.
The process of cell damage or lysis can be defined as the loss of integrity of the cells. For the investigation of this phenomenon, a model‐based designed fed‐batch cultivation with Chinese hamster ovary cells was performed. Besides measurements of viable and dead cell concentration, lysed cell count was determined by DNA measurements. Based on these analytics, different hypotheses, characterizing the cell death, were compared. From this, four main statements could be derived: (i) consideration of lysis in cell culture processes is of great importance for the description of the living biomass population in terms of growth and dying; (ii) a higher effort in process monitoring facilitates significantly model development; (iii) in contradiction to existing models from literature, our verification approach demonstrated a direct correlation of lysis with viable cell concentration and therefore with productivity; and (iv) lysis could be effectively described by only one model parameter, the specific lysis rate from viable cells to lysed cells.
All these statements could be accurately proven by statistical methods. Our results enable future detailed investigations of the causes of cell damage and the influences of cell lysis on product quality and quantity. Potential application fields are scale‐up issues, process optimization, and impurity screening.
Keywords: Cell death, Growth model, Lysis, Mammalian cell culture, Process parameter
Abbreviations
- CHO
Chinese hamster ovary
- DCCI
intact dead cell concentration
- DCCL
lysed dead cell concentration
- RMSE
root mean square error
- VCC
viable cell concentration
1. Introduction
Mammalian cell cultures such as Chinese hamster ovary (CHO) cells are important production organisms for posttranslationally modified biopharmaceuticals 1. An essential challenge in cell culture cultivations in bioreactor systems represents the appearance of cell damage, which causes reduced process performances. The main reasons for cell damage are mechanical and chemical stress. A high local energy dissipation rate at the phase boundary, where increased bubble bursting occurs, is mainly responsible for cell damage in bioreactors 2, 3, 4, 5. For this reason, bioreactors and control strategies for cell culture processes are constructed in such a way that low local energy dissipation rates are achieved 6. In addition, it is common practice to supplement additives such as Pluronic F‐68 to the media to keep the inflicted cell damage in an acceptable range 7, 8.
A mostly unconsidered state of dead cells is the state of lysed cells. In this work, lysis describes dead cells that have lost their integrity to such an extent that they will no longer be detected by a cell counting measurement system. Thus, the determination of lysis is only indirectly possible. A method to determine the lysed cell number was previously developed by Klein et al. 9. As described in literature, lysis is a source of impurities 10. Especially in integrated processing, interlinking upstream and downstream steps, detailed information about lysed cell count and the resulting impurities is of upmost interest. Also, direct influences of lysis on process performances such as process descriptors as biomass yields and specific growth rates are reported 9. This will even affect the interpretation of these parameters.
Various process models of cell culture processes integrate the state of lysed cells as a pseudo‐state 11, 12. So far, there are no verified kinetic models describing the state of lysed cells in mammalian cell cultures. This is especially important for the description of cell growth and cell death in the late phase of processes. Because the living biomass is acting as the catalyst for the product formation, the description is particularly important.
This paper outlines different modeling approaches for the description of lysed cell counts in cell culture processes. The aim of this paper is to identify causal chains of lysis in stirred tank reactors. On the basis of Klein et al. 9, the offline determination of the lysed cell count and the verification and the comparison of models that describe fluxes between cell populations are feasible. Therefore, it is possible to verify and compare different models that describe flows between cell populations. The hypothesis of this work is that the consideration of lysis simplifies the description of cell growth.
Possible fluxes between the cell populations and the declaration of the used parameters and variables are shown in Fig. 1. The considered cell populations are viable cells (VCC), intact dead cells (DCCI), and lysed dead cells (DCCL). The first aim of this work is the description of the VCC by kinetic variables. VCC are defined as trypan blue negative. Assuming exponential growth, VCC can perform autocatalysis described by the specific growth rate μ. The degradation of VCC is described by the specific death rate k D. The physiological pathways of death have already been well studied in the literature. These can be differentiated as apoptosis, autophagy, and necrosis. The specific death rate k D describes the sum of the individual death rates.
Figure 1.
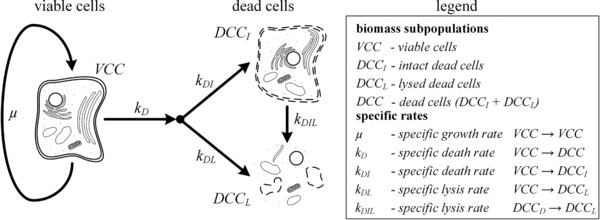
Possible fluxes between the subpopulations of dead cells (DCC). DCCI, intact dead cells; DCCL, lysed dead cells.
The second aim of this work is the segregation of dead biomass into DCCI and DCCL. DCCI are defined as trypan blue positive cells detected during the cell counting. The segregation can be described by the specific death rate k DI and the specific lysis rates k DL and k DIL. k DI describes the flux of VCC to DCCI. k DL characterizes the flux of VCC to lysed cells, whereas k DIL describes the flux of DCCI to lysed cells. Lysed cells are considered as the end product of all types of cell death 13.
The distinction of lysis rates in CHO fermentations has not been shown in literature so far. Published process models, if at all, only considered the flux of dead cells to lysed cells without verification 11, 12. The present work shows the first time resolved lysis rates and assesses the causal chains of lysis that take place in bioreactors.
The evaluated methodology provides the basis for further investigation and description of effects on cell growth and damage in bioreactors. Conceivable application areas are reactor and process quantification.
2. Materials and methods
2.1. Performed process and monitoring
An industrial CHO cell line was cultivated in chemically defined media. The here‐presented fed‐batch experiment was performed in a 3.6 L bioreactor system (Labfors 5, Infors, Switzerland). The average working volume was 2 L. Closed loop controlled process parameters were the temperature (37°C), pH (6.8), dissolved oxygen tension (40%), and partial pressure of carbon dioxide (125 mbar). The set point for pH was chosen such that lysis can be observed with higher effect strength 9. Furthermore, the experiment was designed so that the death phase of the process takes as long as possible. Because of this a lot of relevant data could be collected. The volume specific aeration rate was 0.015 L·L−1·min−1. The fed‐batch experiment was performed with three feeds. Concretely, a glucose feed, a glutamine feed, and a feed with limiting components were used. The glucose was feed controlled so that a minimum supply was ensured in accordance with a specific glucose uptake rate of 0.025 (mM/109cells·h). Under these conditions, glycolysis is a limiting flux with respect to the TCA cycle. The glutamine feed was controlled such that a minimum supply according to a specific glutamine uptake rate of 0.01 (mM/109cells·h) was ensured. To monitor the VCC count, dielectric spectroscopy was used in order to control the specific rates. After each sampling the soft sensor was calibrated. The third feed was added according to the preparation procedure of the industrial partner. Samples were taken every 12 h. According to Fig. 1, VCC and DCCI were measured by an automated image analyzer (Cedex HiRes Analyzer, Roche, Mannheim, Germany). By using trypan blue, VCC and dead cells could be discriminated. For lysed cell count estimation, the DNA content was used according to 9. All measurements were performed in triplicates. The necessary parameters were determined in prior experiments 9. The intracellular DNA content was determined to 6.2 pg/cell, which is in accordance with published values 14, 15, 16. The extracellular DNA degradation was 0.14%/h.
2.2. Model approach
The used equations for the description of the cell populations are listed in Table 1. Equation (1) describes the change of the VCC concentration over time. Dilution effects are considered by the dilution rate D. The segregation of dead cells is modeled based on three hypotheses.
Table 1.
Model equations according to the three existing hypotheses for biomass segregation
| Balances—biomass subpopulations | ||
|---|---|---|
| 1. Viable cell concentration | ||
|
|
(1) | |
| 2. Dead cell concentrations | ||
| Hypothesis 1: | ||
|
|
(1.1) | |
|
|
(1.2) | |
|
|
(1.3) | |
| Hypothesis 2: | ||
|
|
(2.1) | |
|
|
(2.2) | |
|
|
(2.3) | |
| Hypothesis 3: | ||
|
|
(3.1) | |
|
|
(3.2) | |
|
|
(3.3) |
VCC, viable cells; DCCI, morphologically intact dead cells; DCCL, morphologically not intact dead cells.
Hypothesis 1 is based on the assumption that lysed cells are the degradation product of the DCCI (Eqs. 1.1, 1.2, and 1.3). Equation (1.1) described the mass balance of DCCI. These arise from living cells according to the specific death rate k DI and lysis with the specific lysis rate k DIL. Equation (1.2) described the mass balance of lysed cells. They can only be produced by the lysis of dead cells. According to the mass balance, Eq. (1.3) follows. Hypothesis 1 indicates that the specific death rate of living cells k D is similar to the specific death rates for DCCI. Hypothesis 2 describes lysed dead cells and DCCI as degradation products of the VCC (Eqs. 2.1, 2.2, and 2.3). According to the mass balance, the specific death rate k D is the sum of k DI and k DIL (Eq. 2.3). As the systems of equations according to hypotheses 1 and 2 are determined, the model parameters could be uniquely determined. Hypothesis 3 describes lysed dead cells and DCCI as degradation products of the VCC and allows the degradation of DCCI to lysed cells (Eqs. 3.1, 3.2, and 3.3). This system of equations is underdetermined. It follows that a time resolution of the parameters is not possible.
Here, all three hypotheses could be investigated. The parameters were determined using the simplex algorithm by minimizing the sum of the error squares. For the evaluation of linear and quadratic trends, regression analyzes were performed. For this, data were normalized and centered. Using F‐test and t‐test, significance of data could be claimed at a significance level α of 0.05. All calculations were performed in MATLAB (R2015a).
3. Results and discussion
3.1. Biomass subpopulations
Figure 2 shows the time courses of the concentrations VCC, DCCI, and DCCL in a CHO fed‐batch process. VCC reached its maximum of 10.5·109 cells/L at t = 180 h. Afterward VCC decreased due to degradation and dilution effects. Increasing DCCI and DCCL could be observed at t = 140 h. DCCI increased strictly until the end of the fermentation. DCCL increased strictly until t = 270 h. However, the maximum slope could be observed between 150 and 180 h. During this process phase, the concentration of lysed cells (DCCL) was higher than the concentration of DCCI. After 270 h, the number of lysed cells sums up to approximately 11% of the total cell number.
Figure 2.
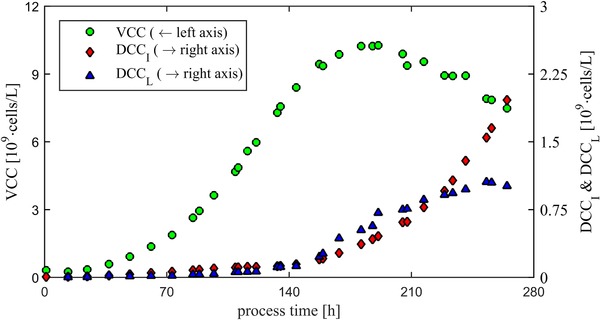
Concentrations of the viable cells (VCC), morphologically intact dead cells (DCCI), and morphologically not intact dead cells (DCCL) during a CHO fed‐batch process.
A time course of DCCL could be shown for the first time for the already published method in CHO fed‐batch process 9. The results seem plausible and suggest that the method can be applied for fed‐batch processes. Lysed cells have a comparable amount as usual considered DCCI. Therefore, the need to take account of lysis can be confirmed.
3.2. Impact of lysis on the description of the VCC concentration
A further evaluation of the impact of lysed cells on the description of growth and degradation of VCC can be achieved by considering physiological variables. The cell growth is described by the specific growth rate μ. The time course of μ with and without considering lysis is shown in Fig. 3A. By considering lysis, a low effect on changes in the specific growth rate can be observed. Nevertheless, this impact increases the amount of the total cell count at the end of the process by 11% as already demonstrated. In Fig. 3B, the death rate of VCC (k D) is shown. In this case, a clear influence of lysis can be observed. Without the consideration of lysis k D decreases to 1 × 10⁻⁴ h–1 after 120 h. Afterward, k D increases strictly monotonic until the end of the fermentation. Taking into account lysis, there is no decrease of k D. Up to 180 h, k D is approximately constant (1.3 ± 0.3 × 10⁻³ h–1). After 180 h, the values of k D with and without consideration of lysis increase analogically. The highest observed degradation rate was 5.5 × 10⁻³ h–1.
Figure 3.
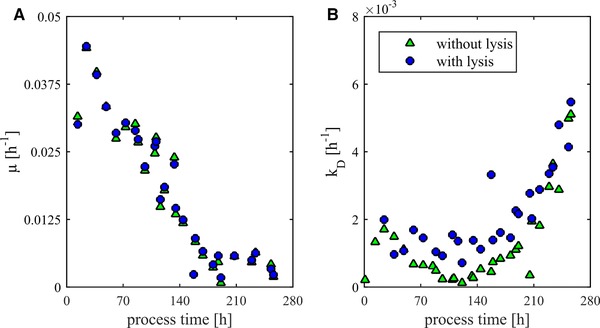
The course of viable cells can be described by the physiological variables μ (specific growth rate) and k D (specific degradation rate). (A) The course of μ over the process time with and without consideration of lysis. (B) The course of k D over the process time with and without consideration of lysis.
The additional analytical effort for the measurement of lysis simplifies considerably the interpretation of the specific reaction rates. In particular, the not occurring decrease of the death rate matches to existing model concepts 12, 17, 18. Reasons for positive death rates in process phases without detectable limitations and inhibitions can be various types of stress. Already well described are effects of mechanical stress 3. Especially a high‐energy input caused by stirring and fumigation should have a significant influence on cell lysis 4. Until now lysis was not considered for the quantification of mechanical stress effects. Due to the high effect strength on k D can be assumed that lysis can significantly improve the description of cell death caused by mechanical stress in cell culture processes. Besides mechanical stress, chemical stress resulting from concentration gradients is well described in cultivation processes 19. Reasons for this are inhomogeneities such as those that appear due to the addition of process additives. Although a high‐effect strength can be expected, lysis is not considered in any scale‐up study so far. Besides the previously described stress factors, physiological effects can influence the death rate. The observed increasing death rate after 180 h results from overlapping limitation and inhibition effects. Already described in literature are inhibition effects of lactate and ammonia 17. These are mostly used in kinetic models to describe k D. Another modeling approach is the use of growth‐limiting effects. For this purpose, the carbon sources or limiting amino acids are used. The most common limiting substrates are glucose and glutamine. Less frequently, amino acids such as serine or unspecified substrates are used 17. An alternative approach is the coupling of the death rate to the growth rate 20. The basic hypothesis is that limitations or inhibitions of growth support the mortality of the cells. The direct use of the specific growth rate is sophisticated because limitation and inhibition effects are taken into account.
3.3. Segregation of dead cells
For the description of segregated dead biomass, specific lysis rates had to be estimated. According to the models shown in Table 1, k DIL (lysis rate from DCCI to DCCL) and k DL (lysis rate from VCC to DCCL) could be calculated. The course of the experimentally determined lysis rate k DIL according to hypothesis 1 is shown in Fig. 4A. After reaching its maximum at t = 110 h, k DIL decreases monotonically until the end of the process. k DIL has values between 0.1 × 10⁻² h–1 and 6.8 × 10⁻² h–1 and shows a significant quadratic time course. The F‐values of 27.8 and 41.0 are above the critical test values of 3.07 and 3.52 for a confidence level of 0.95. Thereby, adequate model relations can be considered. Coefficients of determination (R²) are for the quadratic effect at 0.82 and the linear effect at 0.83. Assumed to be constant literature values by Frahm are with 2.8 × 10⁻² h–1 in the observed area and can therefore be regarded as plausible 12. The observe deviations between model and data are based on three effects: (i) existing measuring inaccuracies on the raw data; (ii) increase of noise because of the differentiation over time; and (iii) an existing model error. By the targeted experimental design, reliable data were obtained from a single experiment. Due to the high‐effect strength on the lysed cell count in combination with the high amount of samplings during the lysis phase, significant data for the model discrimination were generated. The study confirms findings of experimental design that with a well‐planned experiment, the number of replicates can be reduced.
Figure 4.
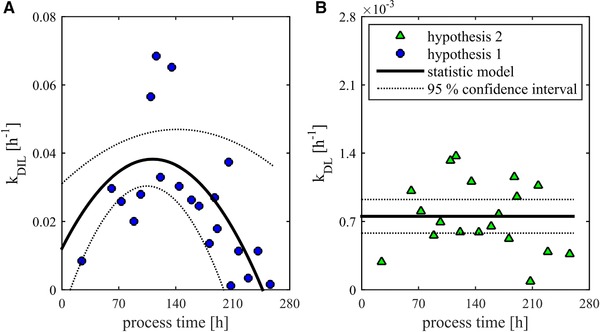
The change of the lysed cell count can be described by specific rates according to previous explained hypotheses. (A) The course of k DIL—lysis rate from intact dead cells to lysed cells over the process time. In addition, the course of a significant multilinear regression (MLR) model with 95% confidence intervals is presented. (B) The course of k DL—lysis rate from viable cells (VCC) to lysed cells over the process time. Because no significant linear and quadratic effects were observed, the mean value as a constant offset is shown over the process time.
Due to the observed significant quadratic effect, the assumption of a constant rate of lysis cannot be confirmed. The cause for the trend is the assumption that DCCI lyse. At the maximum after 110 h there are only few dead cells that can lyse. Accordingly, k DIL reaches high values. With increasing number of dead cells k DIL decreases steadily. According to Eq. (1.3), the death rate k DI corresponds to the already shown k D with lysis (Fig. 3B).
The course of the experimentally determined lysis rate k DL according to hypothesis 2 is shown in Fig. 4B. k DL has values between 0.09 × 10⁻³ and 1.37 × 10⁻³ h–1 and shows no significant linear or quadratic trend over process time. For this reason, a constant specific lysis rate can be assumed. In the performed experiment, the averaged specific lysis rate k DL was 0.8 ± 0.2 × 10⁻³ h–1. A constant specific lysis rate implies that influences on lysis were kept constant during the process. With regard to power input by stirrer and fumigation this can be confirmed. It can be assumed that k DL largely depends on mechanical and chemical stress, which are difficult to quantify. If this hypothesis is valid, k DL could be used as a physiological scale‐up parameter for the comparison of different reactor systems. To confirm this hypothesis, further experiments have to be carried out. According to Eq. (2.3), the death rate k DI corresponds to the already shown k D without lysis (Fig. 3B). This shows a considerably smoother course than the death rate according to hypothesis 1. Assuming that lysis is caused by external stress factors and apoptosis, autophagy, and necrosis are physiological responses, diverse conclusions can be made 13. The initial higher death rate k DI could be related to the physiological adaptation of the culture to the process conditions. The rise in the death rate after 120 h correlated to the declining growth rate. As already described, these are physiological responses.
3.4. Application in modeling
Modeling goal of the presented approaches is lysed cells. For this, a constant lysis rate was assumed. Using the root mean square error (RMSE) as objective function, the specific lysis rates k DIL (0.017 h–1) and k DL (0.8 × 10⁻³ h–1) were determined. Figure 5A shows the courses of measured and modeled lysed cell counts in the fed‐batch process. It can be seen that the model according to hypothesis 2 matches the measured data precisely (RMSE = 0.04 × 10⁹cells/L). The results of the model according to hypothesis 1 show a considerably larger deviation (RMSE = 0.13 × 10⁹cells/L). Based on this, the physiological interpretation according to Fig. 4 can be confirmed.
Figure 5.
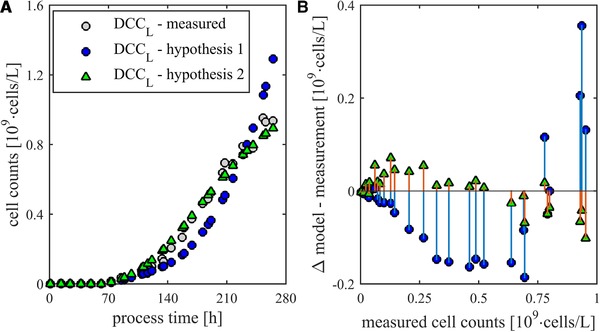
(A) Comparison of modeling approaches for the description of lysis cells (DCCL) in a CHO fed‐batch process. Lysis via dead cells versus lysis via viable cells. (B) Residuals of the two models over the target value DCCL.
Based on the course of the residuals in Fig. 5B, additional statements can be done. The course of the residuals of hypothesis 2 shows a linear trend. Because of this the hypothesis that lysis is based on additional effects can be confirmed. The simplest model extinction is to take into account both pathways to generate lysed cells. This can be represented by the Eqs. (3.1) to (3.3) according to hypothesis 3 (Table 1). Assuming constant specific lysis rates, they can be determined. In the performed experiment, a k DL of 0.7 × 10⁻³ h–1 and a k DIL of 1.1 × 10⁻³ h–1 could be determined. The error of this model is with an RMSE of 0.03 × 10⁹cells/L 25% lower than the model based on hypothesis 2. These values are in the same range and seem physiologically meaningful. It follows that dead cells lyse with a higher specific rate as living cells. However, due to the different cell densities, the majority of lysed cells are generated directly from living cells. This relationship is shown in Fig. 6. Especially the value of k DIL is considerably reduced compared to the value according to hypothesis 1.
Figure 6.
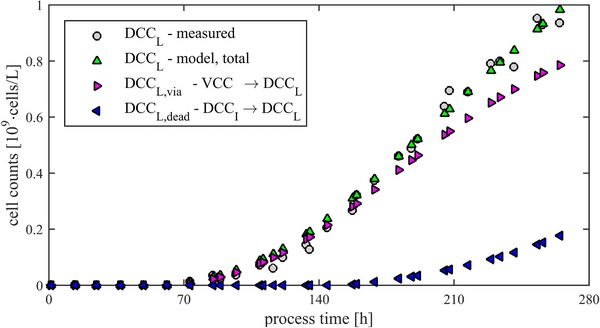
Segregation of lysed cells according to their source (living or intact dead cells).
At the end of fermentation, resulting 80% of lysed cells from living cells. Only 20% of the lysed cells are resulting from DCCI. As already described, the direct pathway of living cells to lysed cells has no physiological cause. It follows that this subpopulation is mainly influenced from scale‐up issues.
4. Concluding remarks
4.1. Summary of the results
The study confirmed that lysed cells represent a significant proportion of the total cell count (11% at the end of the fermentation). This has an impact on numerous aspects in process development.
It was shown that the consideration of lysis in cell culture processes is important to describe the population of living biomass in terms of growth and death. Especially the description of the death rate was significantly affected by lysis. It was shown that the interpretation of the death rate with consideration of lysed cells was significantly simplified. From this, a more robust description of cell growth and death with less parameters could be reached. This is especially interesting for process‐oriented modeling. In these models, the state of the VCC number, often the target value of these models, is particularly important because it describes the amount of catalyst leading to product formation. In addition to the description of the VCC count, the dead biomass was segregated in DCCI and lysed dead cells.
It could be shown that contrary to existing models mainly VCC lyse. It was demonstrated that lysis can be described with only one parameter (k DL). In the investigated process, the parameter k DL was 0.8 × 10⁻³ h–1. This corresponds to approximately 1.3–2.7% of reported maximum growth rates in cell culture processes.
Fundamental statements of the study are as follows:
-
(i)
Closer attention to lysis in process development must be addressed.
-
(ii)
With the information about lysis, growth models of mammalian cell culture processes can be considerably simplified.
-
(iii)
The common assumption that mostly dead cells lyse could not be confirmed.
In addition, it was shown that a targeted experiment in combination with a statistical data analysis leads to robust conclusions and increase in bioprocess development.
4.2. Possible applications/outlook
The findings have especially an impact on the description of later process phases. These late phases are usually decisive for product quality and quantity. The present work forms the basis for further investigations with respect to lysis in bioreactors. Lysis is one reported source of host cell protein and other impurities in the supernatant of mammalian cell culture processes. The presented model structure and parameters provide the basis for potential soft sensors with the aim of real‐time biomass segregation and estimation of termination criteria with respect to product quality and quantity.
The present work and the parameters k DL provide the basis for a more detailed quantification of the causes of lysis. Additionally, effects on the parameter k DL should be analyzed in more detail. Especially, correlations to control variables such as aeration and agitation should be investigated. Correlations could be used for the specific reduction of lysis in critical process phases. In addition, k DL could be used as a physiological scale‐up criterion for the quantification of reactor systems with respect to cell damage. Even for the quantification of causes of cell damage k DL could be used as a parameter. Especially in the context of design of experiment, k DL would be suitable as a target value.
Even in the strain screening, k DL could be used as a parameter to verify strains with regard to their stability in bioreactors.
Practical application
Advanced (model‐based) process control strategies are often based on simple descriptions for specific bioprocess‐related phenomena. A mostly unrecognized event in cultivations is cell lysis, which occurs mainly in mammalian cell culture processes. The here‐presented results provide the basis for a model‐based description of cell growth and cell death in stirred tank reactors by taking into account cell lysis. As main outcome, a verified simple description of the death rate is derived, which enables a detailed investigation of mechanistic causes in respect to cell death. This approach can be beneficial to gain a deeper understanding of scale‐up issues and process optimization. Moreover, cell lysis as a main source of impurities, which in turn affect product quality attributes, has to be considered in mammalian cell culture process development.
The authors have declared no conflicts of interest.
Nomenclature
| VCC | [109cells/L] | viable cell concentration |
| DCC | [109cells/L] | dead cell concentration |
| DCCI | [109cells/L] | intact dead cell concentration |
| DCCL | [109cells/L] | lysed dead cell concentration |
| μ [h−1] | specific growth rate | |
| k D | [h−1] | specific dead rate |
| k DI | [h−1] | specific dead rate from viable cells to intact dead cells |
| k DIL | [h−1] | specific lysis rate from intact death cells to lysed dead cells |
| k DL | [h−1] | specific lysis rate from viable cells to lysed dead cells |
Acknowledgments
We thank the Austrian Federal Ministry of Science, Research and Economy in course of the Christian Doppler Laboratory for Mechanistic and Physiological Methods for Improved Bioprocesses for financial support. We further thank Sandoz GmbH, Austria, for provision of the CHO cell line and the cultivation media.
5 References
- 1. Kuystermans, D. , Al‐Rubeai, M. , Biopharmaceutical products from animal cell culture, in: Al‐Rubeai M. (Ed.), Animal Cell Culture, Springer International Publishing, Cham: 2015, pp. 717–757. [Google Scholar]
- 2. Bohlmann, J. T. , A novel ramjet membrane reactor for bubble‐free aeration of cell cultures, Technische Universität, Berlin: 2012. [Google Scholar]
- 3. Chisti, Y. , Animal‐cell damage in sparged bioreactors. Trends Biotechnol. 2000, 18, 420–432. [DOI] [PubMed] [Google Scholar]
- 4. Murhammer, D. W. , Goochee, C. F. , Sparged animal cell bioreactors: Mechanism of cell damage and pluronic F‐68 protection. Biotechnol. Prog. 1990, 6, 391–397. [DOI] [PubMed] [Google Scholar]
- 5. Al‐Rubeai, M. , Singh, R. P. , Goldman, M. H. , Emery, A. N. , Death mechanisms of animal cells in conditions of intensive agitation. Biotechnol. Bioeng. 1995, 45, 463–472. [DOI] [PubMed] [Google Scholar]
- 6. Pörtner, R. , Bioreactors for mammalian cells, in: Al‐Rubeai M. (Ed.), Animal Cell Culture, Springer International Publishing, Cham: 2015, pp. 89–135. [Google Scholar]
- 7. Apostolidis, P. A. , Tseng, A. , Koziol, M.‐E. , Betenbaugh, M. J. et al. Investigation of low viability in sparged bioreactor CHO cell cultures points to variability in the pluronic F‐68 shear protecting component of cell culture media. Biochem. Eng. J. 2015, 98, 10–17. [Google Scholar]
- 8. Sieblist, C. , Jenzsch, M. , Pohlscheidt, M. , Influence of pluronic F68 on oxygen mass transfer. Biotechnol. Prog. 2013, 29, 1278–1288. [DOI] [PubMed] [Google Scholar]
- 9. Klein, T. , Heinzel, N. , Kroll, P. , Brunner, M. et al. Quantification of cell lysis during CHO bioprocesses: Impact on cell count, growth kinetics and productivity. J. Biotechnol. 2015, 207, 67–76. [DOI] [PubMed] [Google Scholar]
- 10. Levy, N. E. , Valente, K. N. , Choe, L. H. , Lee, K. H. et al. Identification and characterization of host cell protein product‐associated impurities in monoclonal antibody bioprocessing. Biotechnol. Bioeng. 2014, 111, 904–912. [DOI] [PMC free article] [PubMed] [Google Scholar]
- 11. Möhler, L. , Bock, A. , Reichl, U. , Segregated mathematical model for growth of anchorage‐dependent MDCK cells in microcarrier culture. Biotechnol. Prog. 2008, 24, 110–119. [DOI] [PubMed] [Google Scholar]
- 12. Frahm, B. , Lane, P. , Märkl, H. , Pörtner R., Improvement of a mammalian cell culture process by adaptive, model‐based dialysis fed‐batch cultivation and suppression of apoptosis. Bioprocess Biosyst. Eng. 2003, 26, 1–10. [DOI] [PubMed] [Google Scholar]
- 13. Krampe, B. , Al‐Rubeai, M. , Cell death in mammalian cell culture: Molecular mechanisms and cell line engineering strategies, Cytotechnology 2010, 62, 175–188. [DOI] [PMC free article] [PubMed] [Google Scholar]
- 14. Maccani, A. , Ernst, W. , Grabherr, R. , Whole genome sequencing improves estimation of nuclear DNA content of Chinese hamster ovary cells. Cytometry A 2013, 83, 893–895. [DOI] [PubMed] [Google Scholar]
- 15. Reisinger, H. , Steinfellner, W. , Stern, B. , Katinger, H. et al. The absence of effect of gene copy number and mRNA level on the amount of mAb secretion from mammalian cells. Appl. Microbiol. Biotechnol. 2008, 81, 701–710. [DOI] [PubMed] [Google Scholar]
- 16. Osterlehner, A. , Simmeth, S. , Göpfert, U. , Promoter methylation and transgene copy numbers predict unstable protein production in recombinant Chinese hamster ovary cell lines. Biotechnol. Bioeng. 2011, 108, 2670–2681. [DOI] [PubMed] [Google Scholar]
- 17. Pörtner, R. , Schäfer, T. , Modelling hybridoma cell growth and metabolism—A comparison of selected models and data. J. Biotechnol. 1996, 49, 119–135. [DOI] [PubMed] [Google Scholar]
- 18. Aehle, M. , Bork, K. , Schaepe, S. , Kuprijanov, A. et al. Increasing batch‐to‐batch reproducibility of CHO‐cell cultures using a model predictive control approach. Cytotechnology 2012, 64, 623–634. [DOI] [PMC free article] [PubMed] [Google Scholar]
- 19. Nienow, A. W. , Scott, W. H. , Hewitt, C. J. , Thomas, C. R. et al. Scale‐down studies for assessing the impact of different stress parameters on growth and product quality during animal cell culture. Chem. Eng. Res. Des. 2013, 91, 2265–2274. [Google Scholar]
- 20. Glacken, M. W. , Huang, C. , Sinskey, A. J. , Mathematical descriptions of hybridoma culture kinetics. III. Simulation of fed‐batch bioreactors. J. Biotechnol. 1989, 10, 39–65. [Google Scholar]


