

Abstract
In this paper, a most sensitive electrochemical biosensor for detection of prostate‐specific antigen (PSA) was designed. To reach the goal, a sandwich type electrode composed of reduced graphene oxide/ gold nanoparticles (GO/AuNPs), Anti‐Total PSA monoclonal antibody, and anti‐Free PSA antibody was assembled. The functionalized materials were thoroughly characterized by atomic force microscope spectroscopy, transmission electron microscopy, and X‐ray diffraction techniques. The electrochemical properties of each of the modification step were evaluated by cyclic voltammetry and electrochemical impedance spectroscopy. The results presented that the proposed biosensor possesses high sensitivity toward total and free PSA. Furthermore, the fabricated biosensor revealed an excellent selectivity for PSA in comparison to the other tumor markers such as BHCG, Alb, CEA, CA125, and CA19‐9. The limit of detection for the proposed electrochemical biosensor was estimated to be around 0.2 and 0.07 ng/mL for total and free PSA antigen, respectively.
Keywords: biomarker, electrochemical biosensor, prostate cancer, prostate specific antigen
Abbreviations
- GC
glassy carbon
- GNP
gold nano particle
- PSA
prostate specific antigen
1. INTRODUCTION
Prostate cancer is one of the major health concerns in the world, and it is the third most common type of cancer in men who are older than 50 years 1. The use of screening and early detection test such as prostate‐specific antigen (PSA) is one of the common methods for reducing prostate cancer mortality rates 2, 3. PSA serum levels of men naturally rise with age, but prostate cancer tumor growth leads to increasing levels of PSA in biological fluids, blood in particular. PSA is a 32–33 kDa single‐chain glycoprotein produced by the prostate gland that is present in serum, seminal plasma, and benign hyperplastic and prostatic fluids; therefore, it is a special tumor biomarker for prostate cancer screening and post‐treatment monitoring 4, 5. Generally, a serum PSA level below 4 ng/mL is regarded normal, between 4 and 10 ng/mL is considered as the gray zone, and total PSA level (i.e., free PSA plus ACT‐bound PSA) above 10 ng/mL is considered as positive and almost certain indication for prostate cancer 6.When PSA is used alone, approximately 20–30% of tumors will be missed because PSA testing in patients with normal serum PSA levels (defined as 4.0 ng/mL or less) has a sensitivity of about 67.5–80% when the serum PSA level is >4.0 ng/mL, the specificity of PSA testing is 60–70% 7, 8. Age‐adjusted PSA and use of free to total PSA ratios are two different methods for increasing PSA specificity for prostate cancer and thus reduce the number of unwanted biopsies. Age adjustment consists of using higher value for “normal” PSA levels for older men as PSA tends to increase with age. For unsure reasons, patients with prostate cancer tend to have lower free to total PSA ratios, while men with benign disease have higher free to total PSA ratios. Using the free to total PSA ratio will reduce the number of unwanted biopsies in men with serum PSA levels between 4.0 and 10.0 ng/mL 9, 10. Thus far, the general methods for measuring the level of PSA include ELISA, chemiluminescence immunoassay (CLIA), radioimmunoassay, and fluorescent immunoassay (FIA) 11, 12. The techniques mentioned often involve time consuming, high cost, limited sensitivity, and sophisticated instrumentation 13. Therefore, development of high sensitive and economical biosensors with the ability to improve theranostic applications is a key issue in modern medicine[Byrne, 2009 #29;Tothill, 2009 #14]. High sensitive nanobiosensors could be suitable alternatives because of their high selectivity and sensitivity, they are unsophisticated, inexpensive, and rapid, which allows detection of various species such as bacteria, fungal pathogens, viruses, tumor markers, and cancer cells 13, 14, 15.
Electrochemical biosensors play a major role in tumor marker detection due to their advantages such as fast response, miniaturization, and simple operation 16, 17. Recently, use of nanostructure surface and nanoparticles dramatically improved the sensitivity of electrochemical sensors 18, 19. The use of graphene can significantly enhance the electrochemical signal of various electrodes due to their excellent properties such as high electrochemical active surface area, high electron transfer rate, descent conductivity, and a broad range of chemical functional groups on the surface of graphene 20, 21, 22, 23. However, some certain limitations of the use of graphene alone include irreversible self‐agglomerations, non‐specificity, less colloidal stability, poor reliability, and repeatability 24. The dispersion of noble nanoparticles on graphene sheets may cause the production of some outstanding materials for varied potential applications. Among noble nanoparticles, gold nanoparticles (AuNPs) have remarkable properties such as their comparative chemical stability, less hazardous, simple synthesis, and genuine biocompatibility with other labeled biomaterials 25, 26, 27, 28, 29. A number of studies presented that the GO/AuNPs composite could improve the catalytic activity, electrical conductivity, water solubility, biocompatibility, and Raman signal 30, 31. In 2013, Sharma et al. proposed the functionalized graphene–graphene oxide nanocomposite electrode based electrochemical immunosensing. These studies indicate that the functionalized graphene oxide made the electrical properties better, especially electrochemical signals for detection of diuron 32. In other research, Hong et al. developed another strategy with combination of gold nanoparticles with graphene oxide sheets to improve the rate of electrochemical reactions 33. In 2015, Jang et al. showed graphene–gold composite–based 3D label‐free PSA immunosensor and the calculated LOD by these immunosensor was 0.59 ng/mL 34. Table 1 summarizes various approaches used for PSA immunosensor development. In this work, we present a different electrochemical biosensor for detection of total and free PSA antigen using modified graphene oxide–gold nanostructures. For this goal, we synthesized the RGO/AuNPs through Hummer's method and after that PSA antibodies were decorated on the surface of modified electrode.
Table 1.
Various PSA immunosensors and their preparation conditions
| Immunosensor | Component | Preparation condition | Binding technique | LOD | Reference |
|---|---|---|---|---|---|
| Ab1‐hionine/CH/rGO/GCE | rGO | GO prepared from acid treatment of graphite and reduced electrochemically at −1.0 V CH coating | Glutaraldehyde (covalent) | 10 fg /mL | 42 |
| Ab1/PAMAM/GCE | PAMAM/GCE | Using infrared light treatment |
|
0.3 pg/mL | 43 |
| Ab1/ Au@MWCNTs‐SO3H/ GCE | MWCNTs‐SO3H | Refluxing MWCNTs in H2SO4 ‐HNO3 at 120 °C, 30 min | Physical | 3.3 fg/mL | 44 |
| AuNPs | Sodium citrate based reduction at 100 °C reflux | ||||
| Ab1/MPA/Au | MPA/Au | Self‐assembled monolayer | EDC/NHS (covalent) | 0.05 to 2 pg/mL | 45 |
| Ab1/PS | Physical | 0.020 ± 0.001 fg/mL | 46 | ||
| Ab1‐AuNPs/CHI/SPE | AuNPs | Electrochemical reduction in 0.5 M H2SO4 via CV scans between −1.5 and 0.5 V at a rate of 30 mV/s | Physical | 0.001 ng/mL | 47 |
| Ab1/Au@Th/GO/GCE | Au@Th/GO | GO synthesized using modified Hummers’ method was mixed with Thi and HAuCl4 solution and stir | Physical | 16.6 fg/mL | 48 |
| Ab1/CH/ CNT/SPE | CH/CNT/SPE | Acid treated CNTs were mixed with nafion 117 and drop casted on SPE followed by deposition of CH solution | Glutaraldehyde (covalent) | 10.02 ng/mL | 49 |
| Ab1‐BSA/AuNP/ PANI/GCE | PANI/GCE | Phytic acid doped polyaniline via electrochemical co‐deposition at 0.8 V, 400 s | Physical | 1.25 fg/ mL | 50 |
| AuNPs | Electrodeposit deposition by cyclic sweeping in the potential range of −1 to 0.2 V at 50 mV/s, 10 cycles | ||||
| Ab1/Au@N‐GQD/ GCE | N‐GQD | Dicyandiamide and CA solution was autoclaved at 180°C, 12 h | Physical | 0.003 pg/mL | 51 |
| Au@N‐GQD | HAuCl4 was added to N‐GQD, pH adjusted to 10 using NaOH followed by autoclaving at 160 °C, 6 h | ||||
| G/ GNP/Ab1/Ag/Ab2 | GO/AuNPs composite | Graphene Oxide (GO) were synthesized by oxidative exfoliation of graphite flakes according to a modified Hummer's method. Graphene oxide‐gold nanohybrid was synthesized using 4‐(2‐ hydroxyethyl)‐1‐piperazineethanesulfonic acid (HEPES) as a reducing agent |
|
Total PSA 0.2 ng/mL Free PSA 0.07 ng/mL |
Present work |
Notes: Ab1: capture antibody; CH: chitosan; CV: cyclic voltammetry; EDC: 1‐ethyl‐3‐(3‐dimethylaminopropyl)‐carbodiimide; GN: graphene nanosheet; MPA: mercaptopropionic acid; NHS: N‐hydroxysuccinimide; PAMAM: polyamidoamine dendrimers; PS: polystyrene; PSA: prostate specific antigen; Thi: thionine; GNP: gold nano particle; GC: glassy carbon; GCE: glassy carbon electrode
PRACTICAL APPLICATION
In this study, an electrochemical biosensor composed of graphene oxide, gold nanoparticles, and specific antibodies was successfully developed. The proposed electrochemical biosensor can be utilized as a diagnostic tool for the detection of tumor markers, prostate cancer, and clinical analyses.
2. MATERIALS AND METHODS
2.1. Chemicals and materials
All chemicals were obtained from commercial sources and used without manipulation. Hydrogen tetrachloroaurate (III) (HAuCl4·3H2O, Alfa Aesar, 99.99%), 1‐ethyl‐3‐[3‐dimethylaminopropyl] carbodiimide hydrochloride (EDC), N‐hydroxysuccinimide (NHS), 11‐mercaptoundecanoic acid (11‐MUA), and human serum albumin (HSA) were obtained from Sigma–Aldrich. Mouse anti‐Total PSA antibody and Mouse anti‐Free PSA antibody were purchased from Abcam Co., Ltd (USA). The deionized water with an electric resistivity 18.2 MΩ·cm was used during the experiments. The human serum samples from prostate cancer patients were collected from Boghrat Pathobiology Laboratory (Tehran, Iran). Sera were isolated from whole blood samples via centrifugation at 3000 rpm for 15 min, and subsequently kept frozen at –80°C until analysis.
2.2. Synthesis of gold/reduced graphene oxide composite
Graphene oxide (GO) were synthesized by oxidative exfoliation of graphite flakes according to a modified Hummer's method 22, where the concentration and the size of the layers were controlled by successive cycles of centrifugation and sonication. GO suspension was sonicated using probe ultrasonic (Hielscher up 200 h) for 30 and 15 min. Graphene oxide–gold nanohybrid was synthesized using 4‐(2‐hydroxyethyl)‐1‐piperazineethanesulfonic acid (HEPES) as a reducing agent. For this purpose, 0.5 μL of 1 g/L GO was added to 1500 μL of 0.1 M HEPES followed by the addition of 2 μL of 0.1 M HAuCl4 and the mixture was kept at room temperature for 1.5 h. After that, graphene oxide–gold nanohybrid was centrifuged at 10 000 rpm twice and dispersed in water. The capacity of GO for Au loading was evaluated through UV/Vis spectroscopy described by Yadegari et al.20
2.3. Optimization of synthesis of GO–gold nanohybrid
Central composite design (CCD) and response surface method (RSM) were employed to evaluate the effect of concentration ratio of HEPES to GO and incubation time on GO/AuNPs synthesis. Hence, a fractional factorial CCD design was used with two factors and three levels per factor, given in Table 2. The Design‐Expert 7 software was used for the statistical design of the experiments.
Table 2.
Experimental results of loaded Au on GO
| Time (min) | [GO]/[HEPES] | Au loaded (μg/mL) |
|---|---|---|
| 30 | 0.5 | 0.0182 |
| 1.0 | 0.1448 | |
| 1.5 | 0.0255 | |
| 60 | 0.5 | 0.1068 |
| 1.0 | 0.2140 | |
| 1.5 | 0.17878 | |
| 90 | 0.5 | 0.0046 |
| 1.0 | 0.1246 | |
| 1.5 | 0.1232 |
2.4. Preparation of GO/GNP/anti‐total PSA antibody
The GO/AuNPs /anti‐PSA antibodies were first achieved by introducing 11‐mercaptoundecanoic acid (11‐MUA) to GO/GNP. Typically, 4 mL 11‐MUA solution in PBS (10 mM, pH 7.0 with 0.1 mg/mL Tween‐20) was added to 4 mL AuNPs (1 mg/mL) and the mixture was stirred for 5 h at room temperature. Subsequently, the obtained mixture was centrifuged and repeatedly washed with PBS to remove excess reagent. Afterward, 11‐MUA‐modified GO/GNP were incubated with 100 mM EDC/NHS for 10 min. The resulted mixture was centrifuged to remove unreacted EDC/NHS. Meanwhile, (4 μg/mL) monoclonal mouse anti‐total PSA antibody was added to the mixture and kept at 4°C for 3 h. The final mixture was washed by centrifugation and then re‐dispersed in phosphate buffer solution. Afterward, 1 wt% Nafion solution was added to the mixture. Finally, the resulting GO/AuNPs/anti‐total PSA antibody (Ab1) were stored at 4°C before use. Also AuNP probe was prepared as described in our previous work 35.
2.5. Fabrication of nanoprobe
For preparation of nanoprobe, 4 mL of GO/AuNPs solution (1 mg/mL) was mixed with EDC and NHS (100 mM) and stirred for 2 h. Then, monoclonal mouse anti‐Free PSA antibody (4 μg/mL) was added into the mixture. After another 3 h of reaction, the GO/AuNPs /Ab2 solution was centrifuged and washed. The resulting GO/AuNPs /Ab2 conjugates were stored at 4°C in phosphate buffer solution before use.
2.6. Fabrication of biosensor
The glassy carbon working electrode (2 mm diameter) was carefully polished with 3 μM alumina powder and sonicated subsequently in ethanol and water in order to remove adsorbed particles. After that, 10 μL of GO/AuNPs /Ab1 was dropped on the surface of electrode and left at room temperature for 10 min. Then, the modified electrode was incubated in 1 wt% BSA solution for 30 min to eliminate nonspecific binding between the antigen and the electrode surface. Subsequently, serum sample was added onto the electrode surface and incubated for 20 min at room temperature, and then the electrode was washed to remove unbounded PSA molecules. After washing, the electrode was electrochemically investigated. Subsequently, GO/AuNPs /Ab2 was dropped onto the same electrode surface; then, incubated for another 20 min, and finally the electrochemical measurements were repeated.
2.7. Characterization
Electrochemical measurement was carried out using IVIUMSTAT.XR (Electrochemical Interface & Impedance Analyzer). The morphology of the samples was completely characterized by transmission electron microscopy (Philips EM208 TEM) and Ara Research 0201/A atomic force microscope (AFM, Iran). Ultraviolet–Visible (UV/Vis) spectra measurements were performed on an Avaspec 2048 TEC spectrophotometer. X‐ray diffractions (XRD) were performed with a step size of 0.02 (2θ) per second with CuKα radiation by using X'Pert PRO MPD (PANalytical) diffractometer.
3. RESULT AND DISCUSSION
3.1. Working principle of biosensor
Electrochemical sensor based on signal amplification and dual recognition strategy is shown in Scheme 1. Accordingly, GO/AuNPs/anti‐Total PSA antibody (Ab1) was first prepared through multiple steps. Then, anti‐Total PSA antibody was subsequently attached to the surface of working electrode for antigen capturing (Scheme 1b). Afterwards, the resulting antigen/antibody modified electrode was incubated with the GO/AuNPs to form a sandwich‐like system. Due to specific recognition and high binding affinity of antibody, the sandwich‐like system could be exclusively formed in the presence of the target antigen (Scheme 1c). The electrochemical signals (DPV peak) are clearly related to form a sandwich‐like system which existed on the electrode surface. Accordingly, the number of captured antigen could be achieved. Because of loading numerous anti‐Free PSA antibody, specific recognition and high binding affinity of antibody, the selectivity and sensitivity of this sensor are greatly enhanced.
SCHEME 1.
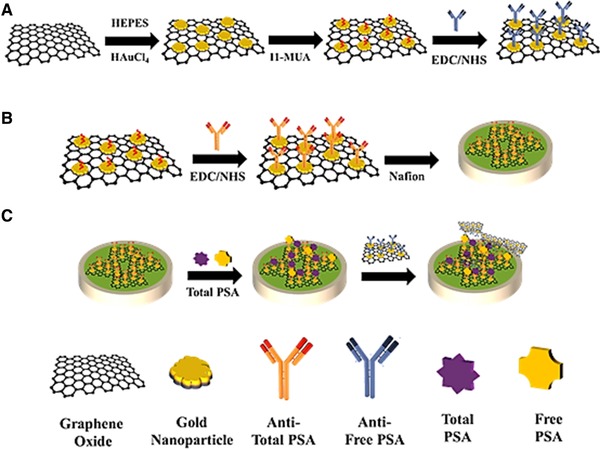
(a) Procedures for the fabrication of Go/ GNP/Ab. (b) Procedure for preparing the electrochemical sensor (c). Schematic illustration of the novel electrochemical sensor for PSA marker detection
3.2. Optimization of time and HEPES/GO ratio for loading Au
According to the significance of GO/AuNPs synthesis in biosensor performance, it is important to evaluate the effect of various parameters affecting the amount of Au loading. Therefore, the effect of time and GO/HEPES ratio, as two critical factors, on amount of Au loading was performed by using quadratic polynomial model, and all samples were studied by UV–Vis spectroscopy, TEM, and XRD (1B, D–F).
Figure 1.
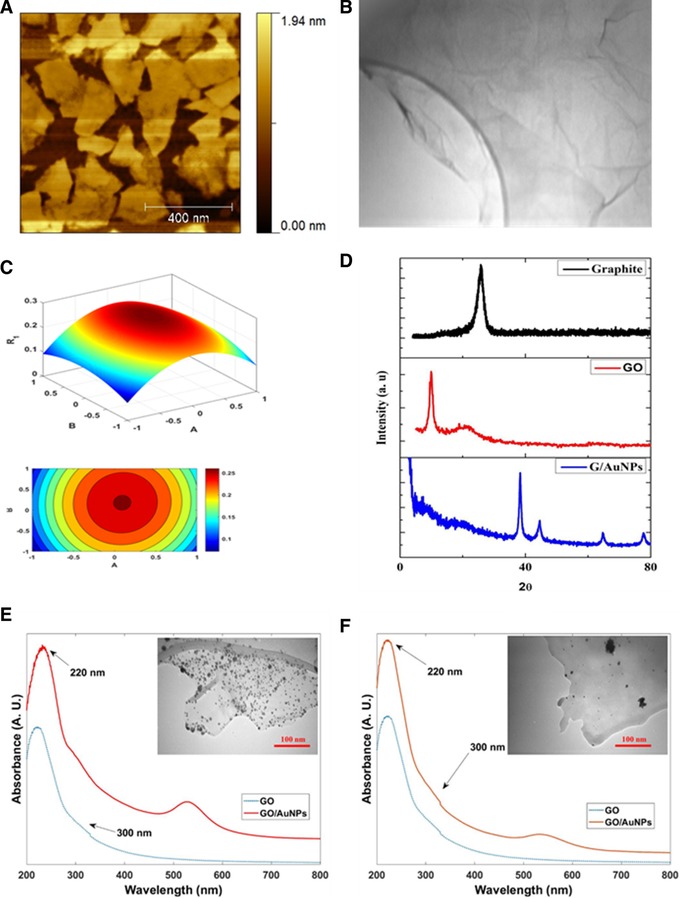
(A) AFM image and (B) TEM images of GO. (C) The 3D response surface plots for optimum condition for preparation of GO/AuNPs, and (D) XRD patterns of samples. (E) UV/Vis spectra of GO and GO/AuNPs, GO / HEPES ratio of 1 in 0.1 M of HEPES solution at time 71 min (optimum condition) and (F) GO / HEPES ratio of 1.5 in 0.1 M of HEPES solution at time of 30 min
The experimental results of loaded Au at different time intervals (30, 60, and 90 min) and GO/HEPES ratio (0.5, 1, and 1.5) are shown in Table 2. Regression coefficient of each value was calculated. Equation (1) represents the proposed model for prediction of the amount of Au loaded on GO.
| (1) |
where R 1 is the loaded amount of Au and A and B stand for GO/HEPES ratio and time, respectively. The significance of each coefficient was determined by p‐values. The p‐values (p < 0.05) suggested that the second‐order term of A (GO/HEPES), and the first term of B (time) are highly noteworthy. It is important to know that the negative and positive coefficients in equation indicate antagonistic and synergistic effect, respectively. Based on the analysis of regression coefficients, the variables including the ratio of HEPES to GO and time have decreased or had an incremental effect on the amount of gold loaded on GO. Regarding the R 1 values, the predicted R 1 was found to be 0.8306, which was in reasonable agreement with the adjusted R 1 of 0.647. Figure 1C demonstrates the effects of GO/HEPES ratio and time on the amount of loaded Au.
As shown in Figure 1E and F, GO displayed two absorption peaks including a strong absorption peak at ∼220 nm and a shoulder at around ∼300 nm corresponding to the π–π* transition of C=C and n–π* transitions of C=O, respectively 36. The LSPR peak in GO/AuNPs could be seen in three different peak shapes, including broaden peak with low intensity broaden and long wavelength, and a sharp and narrow wavelength (Figure 1E and F) 16, which were attributed to the existence of a few AuNPs with high dispersion, aggregation of AuNPs, and the optimum condition, respectively. Also, TEM analysis was used for evaluation of morphological features and distribution of AuNPs on GO/AuNPs. As shown in Figure 1E, in optimal condition, a homogeneous dispersion can be seen for AuNPs on GO without any free particles outside the sheets. Moreover, thin layers, wrinkles, and occasional folds are clearly shown in TEM image of GO. Based on the obtained results, the highest amount of Au loaded and the best dispersion was observed in the optimized condition. The optimized loading (0.23 μg/mL) in the proposed model was obtained at GO/HEPES ratio of 1 in 0.1 M of HEPES solution at time 71 min.
The average size of the deposited AuNPs was obtained to be about 10±1 nm. The XRD pattern of graphite, GO and GO/AuNPs are illustrated in Figure 1D. As shown, the XRD pattern represented a distinctive peak at 26.01o that was related to the (002) plane of graphite (curve a). The XRD pattern of GO/AuNPs clearly showed the appearance of additional peaks at 2θ ∼38.3°, 44.4°, 64.7°, and 77.7° corresponding to the (111), (200), (220), and (311) planes of the AuNPs, respectively (curve b) 38.
3.3. Electrochemical behavior of the biosensor
The assembly processes of the modified electrode were verified by cyclic voltammetry (CV) and electrochemical impedance spectroscopy techniques (Figure 2). As can be seen in Figure 2A, the CV curve of GC electrode in [Fe (CN)6]4− media (curve a) have a redox peak related to Fe3+/2+ electrochemical reaction. After modification of GCE surface with GO/AuNPs (curve b), the electrochemical active surface area has significantly enhanced, indicating that GO/AuNPs increases the active surface of electrode for the conjugation of biomarker. Immobilization of antibodies and antigen on the surface of electrode (curves c–e) leads to a decrease in the electrochemical active surface area of electrode due to the hindering effect on the electron transfer rate that results in the attenuation of redox peaks 39. Figure 2B shows the Nyquist plots of sensing electrode confirming and the step‐by‐step modification of the electrode according to the procedure mentioned in Experimental Section and Scheme 1.
Figure 2.
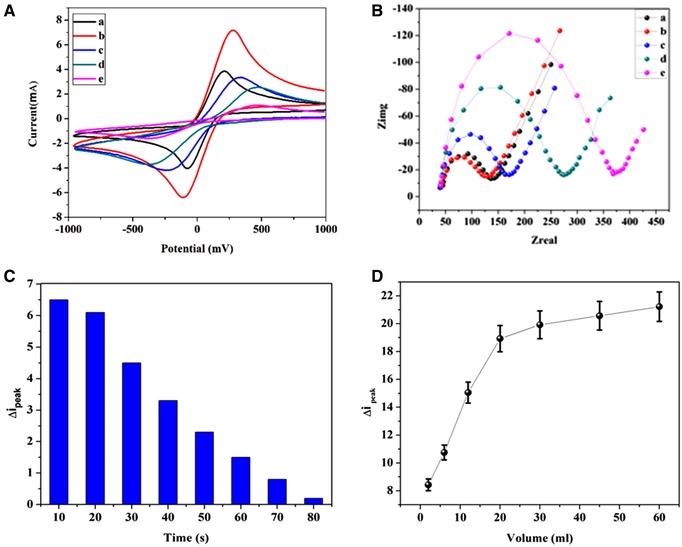
(A) Electrochemical CV responses of bare GC electrode (a),G/GNP (b) G/GNP/Ab1 (c), G/GNP/Ab1/Ag(d), and G/ GNP/Ab1/Ag/Ab2 (e). (B) Electrochemical impedance spectra of bare GC electrode (a), G/GNP (b), G/GNP/Ab1 (c), G/GNP/Ab1/Ag(d), and G/ GNP/Ab1/Ag/Ab2 (e), (C) Effects of the incubation time. (D) And volume for GO/ AuNPs /Ab2 nanoprobes on the Δip of the sensor. All measurements were recorded in 0.1 M KCl solution containing 4 mM [Fe(CN)6]4−/3−
As presented, each plot possesses a semicircle that is ascribed to charge transfer resistance for electrochemical reaction of Fe3+/2+ ions on the surface of electrode. A minuscule semicircle domain for the bare GC electrode was observed (curve a), implying a fast electron transfer process. Subsequently, GO/AuNPs were deposited on the surface of GCE. As shown, the diameter of the semicircle decreased (curve b) due to increasing electrochemical active surface area of the electrode that facilitates electron transfer. After immobilization of GO/AuNPs /Ab1, a conspicuous escalation of the semicircle diameter was also observed (curve c), implying a noticeable augmentation of electrochemical impedance. Moreover, an apparent increase of the resistance with sequential assembly of antigen PSA can be discerned (curve d). It is also obvious that the addition of GO/AuNPs/Ab2 caused a gradual increase in the resistance of the electrode as the experiment proceeded (curve e). These results confirmed that the antibody–antigen nanoprobe sandwich‐like architecture has been successfully assembled.
The effect of incubation time and volume of nanoprobe solution on detection of total PSA are studied (Figure 2C and D). As shown, a minor increase in the incubation time leads to a significant decrease of Δip. The results show that after 20 min, the response barely changes (about 32%). Therefore, the incubation time for the antigen and antibody incubation was found to be about 20 min. In addition to above mentioned results, the impact of the volume of nanoprobe solution was further investigated. Figure 2D presents the relationship between Δip and the volume of nanoprobe solution. Therefore, the intensity of peak current density linearly increases with an increase in the volume of the nanoprobe solution until it reaches to 20 μL. In continuation, from 20 to 60 μL, the plot reveals that the intensity of the peak current density is approximately independent of the volume of nanoprobe solution. These results indicate that the optimum volume solution for the nanoprobe is about 20 μL.
3.4. Detection of the total and free PSA
The responses of square wave voltammetry of total PSA and free PSA are illustrated in Figure 3A and B. Figure 3A shows that SW (square wave voltammetry) responses decrease with increasing concentration of total PSA. Furthermore, square wave voltammetry (SW) responses decrease with increasing concentration of Free PSA (3B). LOD is defined as the lowest possible concentration of an analyte that can be distinguished without any assurance about the imprecision of the obtained results. Herein, the LOD was calculated by the following equation 37:
| (2) |
where b is the sensitivity of the sensor (slope of the regression line) and σ is the SD of the blank. Mean value and SD of Δip were calculated, since each concentration measurement was repeated three times (Figure 3C and D). According to Equation (1), the LOD of total PSA and free PSA antigen were calculated to be about 0.2 and 0.07 ng/mL, respectively.
Figure 3.
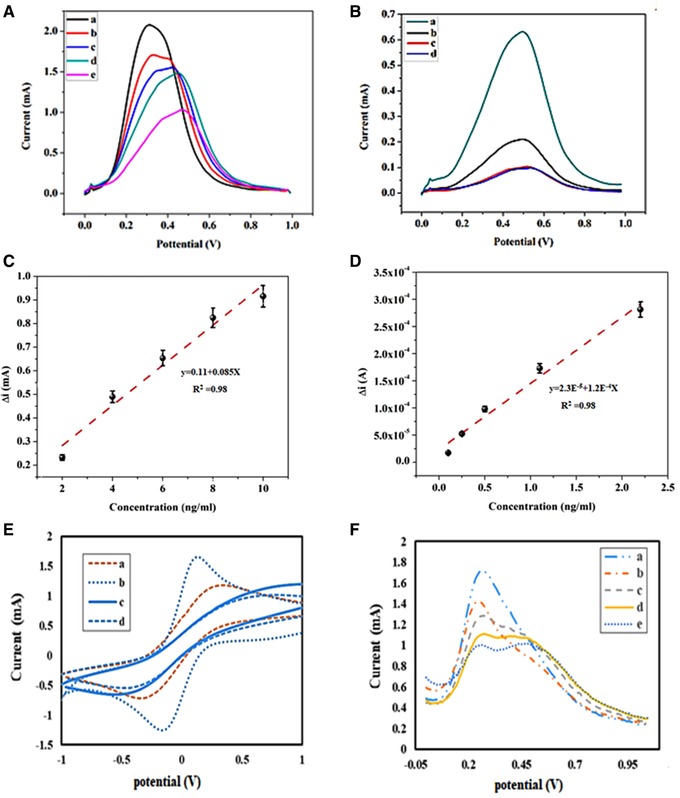
(A) SWV of G/ AuNPs /Ab1 electrode at the concentrations of 0, 2, 4, 6, 8, and 10 ng/mL of total PSA, respectively. (B) SWV of G/ AuNPs /Ab1 electrode at the concentrations of 0.1, 0.2, 0.5, 1.1, and 2.2 ng/mL of free PSA, respectively. (C) Calibration curve for the analysis of total PSA. (D) Calibration curve for the analysis of free PSA. (E) Electrochemical CV responses of bare GC electrode (a), G/AuNPs (b), G/ AuNPs /Ab1/Ag(c), and G/ AuNPs /Ab1/Ag/Ab2 (d). (F) SWV of G/ AuNPs /Ab1 electrode at the concentrations of 0, 4, 6, 8, and 10 ng/mL of total PSA, respectively
Figure 3E and F showed the CV and responses of square wave voltammetry of this sensor. The LOD of this biosensor was obtained as 1.4 and 0.22 ng/mL for total PSA and free PSA antigen, respectively. Clearly, GO/AuNPs has better LOD in comparison with AuNP. These results may relate to large specific surface area of GO and the high electrochemical current of Au.
To compare our electrochemical biosensor with a standard method, real samples of six patients were analyzed by chemiluminescence spectroscopy. As illustrated in Figure 4A and B, the as‐prepared electrochemical biosensor was capable to detect total and free PSA antigen as good as the standard methods. It has been shown that the selectivity is known as an important parameter in electrochemical sensors. To investigate the specificity of the proposed electrochemical sensor, a series of detection experiments was performed using different kinds of tumor markers such as CEA, CA125, CA19‐9, BHCG, and Alb in certain concentrations (Figure 4C). The results display that there is no significant alteration regarding the DPV responses in the presence of tumor markers, indicating that the proposed electrochemical biosensor has a high selectivity for the detection of total PSA 40, 41. The time stability and reproducibility of the present biosensors were examined by measuring the response for constant value (4 ng/mL) of total PSA at different time points (Figure 4D). As shown in Figure 4D, after 30 days, the biosensor response change was just about 8%. These results prove that the present biosensor has good time stability. Nevertheless, the electrochemical biosensors are still in development phase. Thus, much more efforts and comprehensive studies should be done to implement a sensitive and selective electrochemical approach for commercial laboratories and real‐world medical applications.
Figure 4.
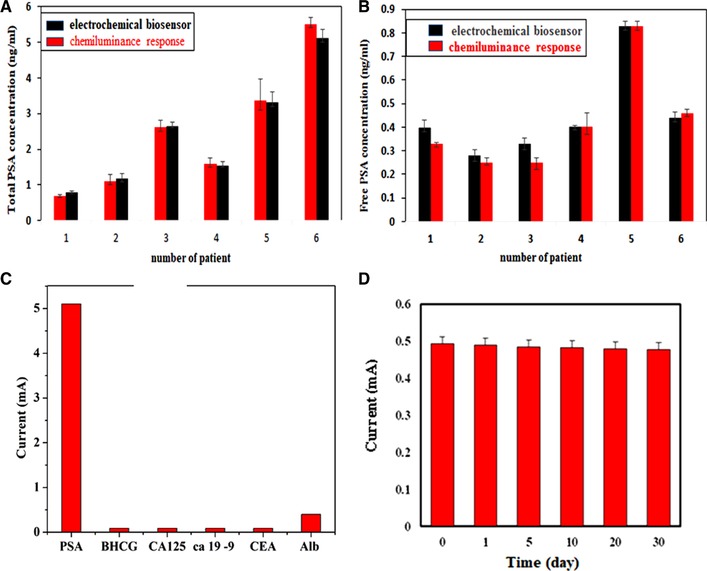
(A) and (B) Comparing results were obtained by electrochemical sensor and CLA of free and total PSA. (C) Comparing results selectivity were obtained by electrochemical sensor and CLA total PSA. The error bars present relative signals across three repetitive experiments. (D) Stability and reproducibility of sensor as a function of time for 4 ng/mL of Total PSA
4. CONCLUDING REMARKS
In this study, an electrochemical biosensor composed of GO, AuNPs, and specific antibodies was successfully formed for the detection of total and free PSA. The suggested biosensor has a double functionality, including specific recognition and signal amplification for detecting the total and free PSA. A sandwich‐like procedure was used for providing an interaction between antigens and antibodies immobilized on the surface of GO/GNPs. The results showed that using decorated AuNPs on GO can dramatically increase the selectivity and sensitivity of the biosensor by increasing the electrochemically active surface area. Overall, the recommended electrochemical biosensor can be used as a diagnostic tool for the detection of PSA tumor markers and clinical analyses.
CONFLICT OF INTEREST
The authors have declared no conflict of interest.
ACKNOWLEDGMENTS
The authors would like to declare that this investigation was supported by Shahid Beheshti University G.C., research Grant.
Akbari jonoush Z, Shayeh JS, Yazdian F, Yadegari A, Hashemi M, Omidi M. An electrochemical biosensor for prostate cancer biomarker detection using graphene oxide–gold nanostructures. Eng Life Sci 2019;19:206–216. 10.1002/elsc.201800093
REFERENCES
- 1. Siegel, R. L. , Miller, K. D. , Jemal, A. , Cancer statistics, 2015. CA Cancer J. Clin. 2015, 65, 5–29. [DOI] [PubMed] [Google Scholar]
- 2. Stephan, C. , Ralla, B. , Jung, K. , Prostate‐specific antigen and other serum and urine markers in prostate cancer. Biochim. Biophys. Acta 2014, 1846, 99–112. [DOI] [PubMed] [Google Scholar]
- 3. Stephan, C. , Ralla, B. , Jung, K. , Prostate‐specific antigen and other serum and urine markers in prostate cancer. Biochim. Biophys. Acta 2014, 1846, 99–112. [DOI] [PubMed] [Google Scholar]
- 4. Qu, B. , et al., A novel electrochemical immunosensor based on colabeled silica nanoparticles for determination of total prostate specific antigen in human serum. Talanta 2008, 76, 785–790. [DOI] [PubMed] [Google Scholar]
- 5. Huang, L. , et al., Prostate‐specific antigen immunosensing based on mixed self‐assembled monolayers, camel antibodies and colloidal gold enhanced sandwich assays. Biosens. Bioelectron. 2005, 21, 483–490. [DOI] [PubMed] [Google Scholar]
- 6. Arya, S. K. and Bhansali, S. , Anti‐prostate specific antigen (anti‐PSA) modified interdigitated microelectrode‐based impedimetric biosensor for PSA detection. Biosens. J. 2012, 1, H110601. [Google Scholar]
- 7. Catalona, W. J. , Smith, D. S. , Ornstein, D. K. , Prostate cancer detection in men with serum PSA concentrations of 2.6 to 4.0 ng/mL and benign prostate examination: enhancement of specificity with free PSA measurements. JAMA 1997, 277, 1452–1455. [PubMed] [Google Scholar]
- 8. Brawer, M. K. , Prostate‐specific antigen: Current status. CA Cancer J. Clin. 1999, 49, 264–281. [DOI] [PubMed] [Google Scholar]
- 9. Association, A. U. , Prostate‐specific antigen (PSA) best practice policy. Oncology 2000, 14, 280. [PubMed] [Google Scholar]
- 10. Lee, R. , et al., A meta‐analysis of the performance characteristics of the free prostate‐specific antigen test. Urology 2006, 67, 762–768. [DOI] [PubMed] [Google Scholar]
- 11. Arya, S. K. and Bhansali, S. , Anti‐prostate specific antigen (anti‐PSA) modified interdigitated microelectrode‐based impedimetric biosensor for PSA detection. Biosens. J. 2012, 1, 1–7. [Google Scholar]
- 12. Brown, J. Q. , et al., Ultra‐sensitive detection of biomarker using localized surface plasmon resonance (LSPR) enhanced by ELISA. Eur. Conf. Biomedical. Opt. 2015, 9537, 95371F. [Google Scholar]
- 13. Tothill, I. E. , Biosensors for cancer markers diagnosis. Semin. Cell Dev. Biol. 2009, 20, 55–62. [DOI] [PubMed] [Google Scholar]
- 14. Sharma, T. K. , et al., Moving forward in plant food safety and security through NanoBioSensors: Adopt or adapt biomedical technologies? Proteomics 2015, 15, 1680–1692. [DOI] [PubMed] [Google Scholar]
- 15. Byrne, B. , et al., Antibody‐based sensors: principles, problems and potential for detection of pathogens and associated toxins. Sensors 2009, 9, 4407–4445. [DOI] [PMC free article] [PubMed] [Google Scholar]
- 16. Altintas, Z. . Tothill, aI. , Biomarkers and biosensors for the early diagnosis of lung cancer. Sens. Actuators B 2013, 188, 988–998. [Google Scholar]
- 17. Liao, J. C. , et al., Use of electrochemical DNA biosensors for rapid molecular identification of uropathogens in clinical urine specimens. J. Clin. Microbiol. 2006, 44, 561–570. [DOI] [PMC free article] [PubMed] [Google Scholar]
- 18. Rusling, J. F. , et al., Measurement of biomarker proteins for point‐of‐care early detection and monitoring of cancer. Analyst 2010, 135, 2496–2511. [DOI] [PMC free article] [PubMed] [Google Scholar]
- 19. Wang, J. , Electrochemical biosensors: towards point‐of‐care cancer diagnostics. Biosens. Bioelectron. 2006, 21, 1887–1892. [DOI] [PubMed] [Google Scholar]
- 20. Yadegari, A. , et al., An electrochemical cytosensor for ultrasensitive detection of cancer cells using modified graphene–gold nanostructures. RSC Adv. 2017, 7, 2365–2372. [Google Scholar]
- 21. Nahideh, S. , Siyavash Kazemi, M. , et al. Electrochemical study of supercapacitor performance of poly pyrrole ternary nanocomposite electrode by fast fourier transform continues cyclic voltammetry. RSC Adv. 2015, 5, 96130–96137. [Google Scholar]
- 22. Shabani‐Shayeh, J. , et al., Conductive polymer/reduced graphene oxide/Au nano particles as efficient composite materials in electrochemical supercapacitors. Appl. Surf. Sci. 2015, 353, 594–599. [Google Scholar]
- 23. Shayeh, J. S. , et al., Physioelectrochemical investigation of the supercapacitive performance of a ternary nanocomposite by common electrochemical methods and fast Fourier transform voltammetry. New J. Chem. 2015, 39, 9454–9460. [Google Scholar]
- 24. Khalil, I. , et al., Graphene–gold nanoparticles hybrid—synthesis, functionalization, and application in a electrochemical and surface‐enhanced raman scattering biosensor. Materials, 2016, 9, 406. [DOI] [PMC free article] [PubMed] [Google Scholar]
- 25. Wang, Y. , et al., Current status of nanotechnology applied in biomedicine. Acta Biophys. Sin. 2009, 25, 168–172. [Google Scholar]
- 26. Chen, R. J. , et al., Noncovalent sidewall functionalization of single‐walled carbon nanotubes for protein immobilization. J. Am. Chem. Soc., 2001, 123(16), 3838–3839. [DOI] [PubMed] [Google Scholar]
- 27. Daniel, M.‐C. and Astruc, D. , Gold nanoparticles: assembly, supramolecular chemistry, quantum‐size‐related properties, and applications toward biology, catalysis, and nanotechnology. Chem. Rev., 2004, 104, 293–346. [DOI] [PubMed] [Google Scholar]
- 28. Soppimath, K. S. , Betageri, G. V. , Cho, M. , Nanostructures for cancer diagnostics and therapy. Biomed. Nanostruct. 2007, 409–437. [Google Scholar]
- 29. Ho, J. A. , et al., Diagnostic detection of human lung cancer‐associated antigen using a gold nanoparticle‐based electrochemical immunosensor. Anal. Chem., 2010, 82, 5944–5950. [DOI] [PubMed] [Google Scholar]
- 30. Jasuja, K. . Berry, aV. , Implantation and growth of dendritic gold nanostructures on graphene derivatives: electrical property tailoring and Raman enhancement. ACS Nano, 2009, 3, 2358–2366. [DOI] [PubMed] [Google Scholar]
- 31. Kim, Y.‐K. , Na, H.‐K. , Min, D.‐H. , Influence of surface functionalization on the growth of gold nanostructures on graphene thin films. Langmuir, 2010, 26, 13065–13070. [DOI] [PubMed] [Google Scholar]
- 32. Sharma, P. , et al., Bio‐functionalized graphene–graphene oxide nanocomposite based electrochemical immunosensing. Biosens. Bioelectron., 2013, 39, 99–105. [DOI] [PMC free article] [PubMed] [Google Scholar]
- 33. Hong, W. , et al., Preparation of gold nanoparticle/graphene composites with controlled weight contents and their application in biosensors. J. Phys. Chem. C, 2010, 114, 1822–1826. [Google Scholar]
- 34. Jang, H. D. , et al., 3D label‐free prostate specific antigen (PSA) immunosensor based on graphene‐gold composites. Biosens. Bioelectron., 2015, 63, 546–551. [DOI] [PubMed] [Google Scholar]
- 35. Akbari jonoush, Z. , et al., Detection of prostate cancer biomarker using optical nanobiosensor based on gold nanoparticle. Koomesh, 2017, 19, 774–784. [Google Scholar]
- 36. Hashemi, M. , et al., Normalization of doxorubicin release from graphene oxide: New approach for optimization of effective parameters on drug loading. Biotechnol. Appl. Biochem., 2017, 64, 433–442. [DOI] [PubMed] [Google Scholar]
- 37. Omidi, M. , et al., Protein‐based nanobiosensor for direct detection of hydrogen sulfide. EPL, 2015, 109, 18005. [Google Scholar]
- 38. Zhang, J. , et al., In situ assembly of gold nanoparticles on nitrogen‐doped carbon nanotubes for sensitive immunosensing of microcystin‐LR. Chem. Commun., 2011, 47, 668–670. [DOI] [PubMed] [Google Scholar]
- 39. Zhang, X. , et al., Direct immobilization of antibodies on dialdehyde cellulose film for convenient construction of an electrochemical immunosensor. Sens. Actuators B, 2014, 200, 304–309. [Google Scholar]
- 40. Majzik, A. , et al., Growing and stability of gold nanoparticles and their functionalization by cysteine. Gold Bull., 2009, 42, 113–123. [Google Scholar]
- 41. Omidi, M. , et al., A Label‐Free detection of biomolecules using micromechanical biosensors. Chin. Phys. Lett., 2013, 30, 068701. [Google Scholar]
- 42. Kavosi, B. , et al., Ultrasensitive electrochemical immunosensor for PSA biomarker detection in prostate cancer cells using gold nanoparticles/PAMAM dendrimer loaded with enzyme linked aptamer as integrated triple signal amplification strategy. Biosens. Bioelectron., 2015, 74, 915–923. [DOI] [PubMed] [Google Scholar]
- 43. Zhang, B. , et al., Redox and catalysis ‘all‐in‐one'infinite coordination polymer for electrochemical immunosensor of tumor markers. Biosens. Bioelectron., 2015, 64, 6–12. [DOI] [PubMed] [Google Scholar]
- 44. Li, M. , et al., An ultrasensitive sandwich‐type electrochemical immunosensor based on the signal amplification strategy of mesoporous core–shell Pd@ Pt nanoparticles/amino group functionalized graphene nanocomposite. Biosens. Bioelectron., 2017, 87, 752–759. [DOI] [PubMed] [Google Scholar]
- 45. Tang, C. K. , et al., High‐throughput electrochemical microfluidic immunoarray for multiplexed detection of cancer biomarker proteins. ACS Sens., 2016, 1, 1036–1043. [DOI] [PMC free article] [PubMed] [Google Scholar]
- 46. Zhu, Y. , et al., Cascade signal amplification based on copper nanoparticle‐reported rolling circle amplification for ultrasensitive electrochemical detection of the prostate cancer biomarker. ACS Appl. Mater. Interfaces, 2016, 8(4), 2573–2581. [DOI] [PubMed] [Google Scholar]
- 47. Suresh, L. , et al., Development of an electrochemical immunosensor based on gold nanoparticles incorporated chitosan biopolymer nanocomposite film for the detection of prostate cancer using PSA as biomarker. Enzyme Microb. Technol., 2018, 112, 43–51. [DOI] [PubMed] [Google Scholar]
- 48. Feng, J. , et al., A novel sandwich‐type electrochemical immunosensor for PSA detection based on PtCu bimetallic hybrid (2D/2D) rGO/g‐C3N4. Biosens. Bioelectron., 2017, 91, 441–448. [DOI] [PubMed] [Google Scholar]
- 49. Duangkaew, P. , Wutikhun, T. , Laocharoensuk, R. , Triple signal amplification strategy based on size and shape transformation of ultrasmall sub‐10 nm gold nanoparticles tag towards sensitivity improvement of electrochemical immunosensors. Sens. Actuators B, 2017, 239, 430–437. [Google Scholar]
- 50. Zhang, D. , Li, W. , Ma, Z. , Improved sandwich‐format electrochemical immunosensor based on “smart” SiO2@ polydopamine nanocarrier. Biosens. Bioelectron. 2018, 109, 171–176. [DOI] [PubMed] [Google Scholar]
- 51. Yang, Y. , et al., An ultrasensitive sandwich‐type electrochemical immunosensor based on the signal amplification strategy of echinoidea‐shaped Au@ Ag‐Cu2O nanoparticles for prostate specific antigen detection. Biosens. Bioelectron. 2018, 99, 450–457. [DOI] [PubMed] [Google Scholar]