ABSTRACT
Pancreatic ductal adenocarcinoma (PDAC) is one of the most aggressive and lethal malignancies. Given that macroautophagy/autophagy activation is prevalent in PDAC, the dual roles of autophagy could be involved in PDAC heterogeneity. In this work, we demonstrated that TGFB1 induced autophagic flux through SMAD4-dependent or SMAD4-independent pathways based on a distinct genetic context. In SMAD4-positive PDAC cells, TGFB1-induced autophagy promoted proliferation and inhibited migration by decreasing the nuclear translocation of SMAD4. Conversely, TGFB1-induced autophagy inhibited proliferation and promoted migration in SMAD4-negative cells through the regulation of MAPK/ERK activation. TGFB1 expression also positively correlated with LC3B expression in PDAC specimens. A high level of LC3B was associated with unfavorable overall survival (OS) and disease-free survival (DFS) in SMAD4-negative PDAC patients, although LC3B could not predict OS and DFS for the 110 PDAC patients. Thus, TGFB1-induced autophagy contributed to the different patterns of PDAC progression. This knowledge can aid in improving our understanding of the molecular classification of PDAC and might guide the development of therapeutic strategies for PDAC, especially for SMAD4-negative PDAC.
Abbreviations: CDH1: cadherin 1; CDH2: cadherin 2; CI: combination index; CQ: chloroquine; DFS: disease-free survival; EMT: epithelial-to-mesenchymal transition; ERK: extracellular signal-regulated protein kinase; GFP: green fluorescent protein; IHC: immunohistochemistry; MAP1LC3B/LC3B: microtubule associated protein 1 light chain 3 beta; MAPK: mitogen-activated protein kinase; OS: overall survival; PBS: phosphate-buffered saline; PDAC: pancreatic ductal adenocarcinoma; RAP: rapamycin; RFP: red fluorescent protein; RT: room temperature; shRNA: short-hairpin RNA; SQSTM1: sequestosome 1; TCGA: The Cancer Genome Atlas; TEM: transmission electron microscopy; TGFB1: transforming growth factor beta 1; TMA: tissue microarray
KEYWORDS: Autophagic flux, LC3B, metastasis, pancreatic ductal adenocarcinoma, proliferation
Introduction
Pancreatic ductal adenocarcinoma (PDAC) is one of the most aggressive and lethal malignancies. The overall 5-year survival rate of PDAC remains less than 8%, even with the considerable advances in diagnostic techniques [1]. This dismal prognosis is primarily attributed to the observation that this cancer has usually developed into locally advanced or metastatic disease at the time of diagnosis, and thus, fewer than 20% of patients have localized potentially curable tumors [2,3]. Even after curative surgery at early stages, local and metastatic recurrence arises, making PDAC highly resistant to any therapeutic regimen [4,5]. Therefore, it is of utmost importance to identify the mechanisms underlying PDAC progression and to develop novel treatments that can improve the prognosis for this disease.
PDACs are mostly considered a single disease with respect to treatment, although PDAC is a heterogeneous cancer with various molecular variations [6]. Classification of PDAC into clinically meaningful subtypes could allow for the selection of optimal therapeutic strategies, thus improving patient survival. SMAD4 is a major tumor suppressor gene that is inactivated in approximately 60% of PDACs [7], and its loss correlates with a higher metastatic burden but not with local destruction, suggesting that the genetic status of SMAD4 could determine the PDAC progression pattern [5]. Moreover, as a critical member of the TGFB1 (transforming growth factor beta 1) signaling pathway, SMAD4 plays a role as a transcription factor in regulation of gene expression with activation of the signaling pathway [8].
Autophagy is an evolutionarily conserved catabolic process that targets cytoplasmic material to the lysosomal compartment for degradation [9]. In tumorigenesis, the role of autophagy appears highly context dependent [10,11]. Accumulating evidence demonstrates that autophagy activation is prevalent in PDAC, and the pro-tumorigenic and tumor-suppressive roles make autophagy a ‘Janus-faced’ player in PDAC progression [12,13]. More recently, this process has also been described as a moderator of metastatic progression [14,15]. However, the impact of molecular context on the dual roles of autophagy in PDAC remains poorly investigated.
In this study, TGFB1 induced autophagy through SMAD4 and non-SMAD4 pathways, which had different effects on tumor growth and metastasis in PDAC cells with a distinct genetic status of SMAD4. Thus, this study can help to improve our understanding of the molecular classification of PDAC and to guide the development of a therapeutic strategy for PDAC.
Results
TGFB1 is correlated with LC3B expression in PDAC
To analyze the correlation of LC3B expression with core signaling pathways, we performed gene set enrichment analysis (GSEA) using a collection of genes (c2.cp.kegg.v6.1) from the PDAC dataset of The Cancer Genome Atlas (TCGA; Table S1). The results showed that high LC3B expression was significantly associated with gene sets termed as follows: ‘cell adhesion molecules’, ‘focal adhesion’, ‘ECM receptor interaction’, ‘pathways in cancer’ and ‘adherens junction’, suggesting a potential role of LC3B in regulating proliferation and migration. Moreover, the enrichment plot indicated that LC3B expression was likely correlated with the TGFB1 pathway (Figure 1A and Fig. S1). Furthermore, LC3B expression was found to be positively correlated with TGFB1 using the TCGA dataset (Figure 1B; Spearman r = 0.1799). We also examined the correlation of TGFB1 with LC3B expression in 110 PDAC patients from Fudan University Shanghai Cancer Center (FUSCC) by the immunohistochemical (IHC) staining of serial sections on tissue microarray (TMA; Figure 1C). A positive correlation also existed between TGFB1 and LC3B expression in the FUSCC dataset (Figure 1D; Spearman r = 0.3322).
Figure 1.
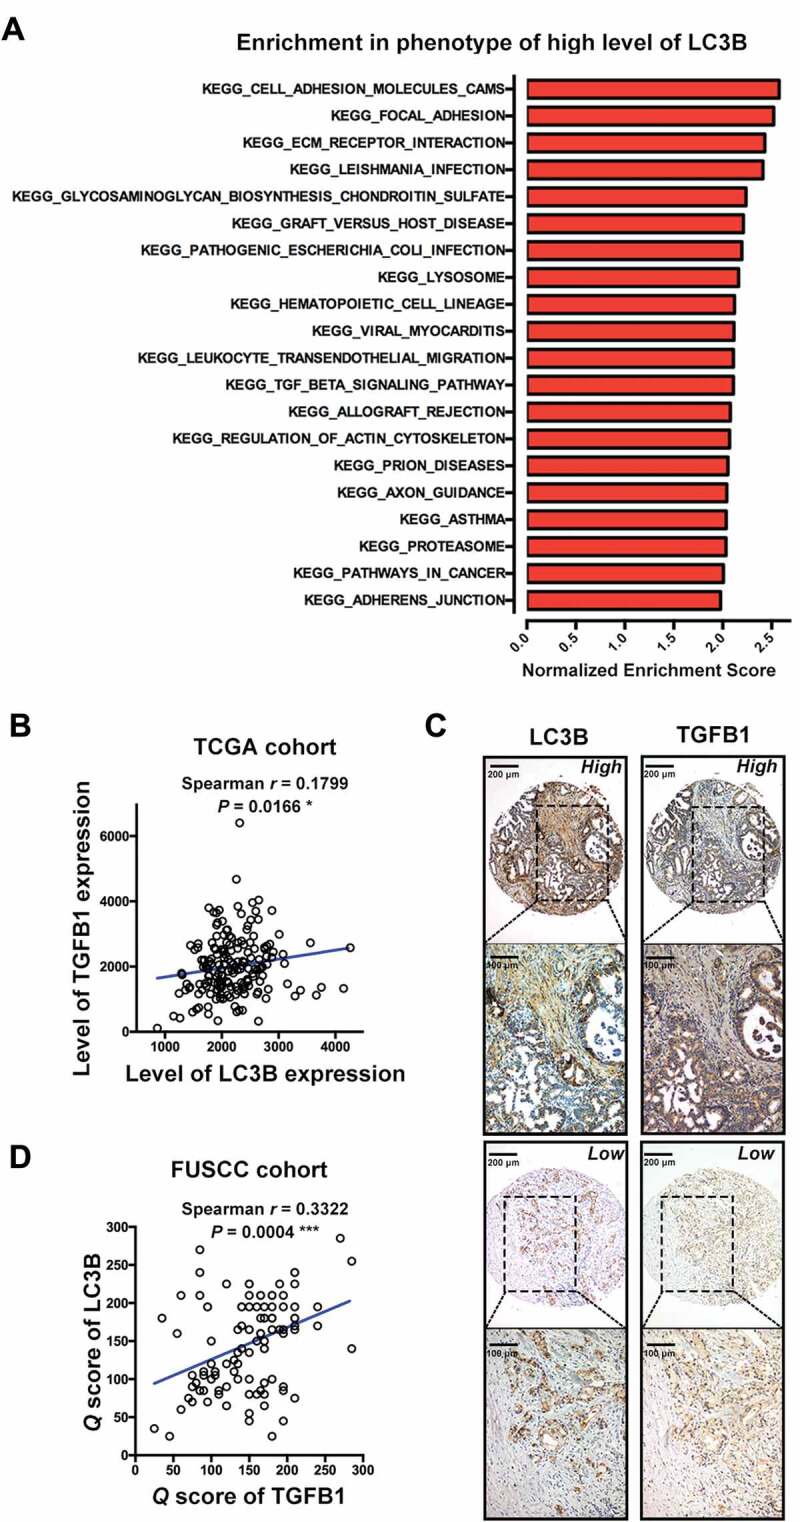
TGFB1 correlates with LC3B expression in PDAC. (A) The KEGG gene set was used to run the GSEA analysis. The top 20 gene sets enriched in the phenotype of high LC3B expression in 177 PDAC patients were determined and ordered according to the normalized enrichment scores. (B) TGFB1 expression positively correlated with LC3B expression from the TCGA data of PDAC. (C) Representative image of IHC staining for LC3B and TGFB1 in PDAC tissues. (D) TGFB1 expression positively correlated with LC3B expression in PDAC samples from FUSCC. (Magnification scale bar, 200 μm; scale bar in enlarged image, 100 μm).
TGFB1 induces autophagic flux in human pancreatic cancer cell lines
Next, we administered TGFB1 to determine whether TGFB1 induces autophagy in human pancreatic cancer cells. As shown in Figure 2A and Fig. S2, TGFB1 stimulation activated the SMAD pathway in PANC-1 and BxPC-3 cells, as confirmed by the increasing level of phosphorylated SMAD2/3 and no change in total SMAD2/3, but also activated several non-SMAD pathways, including MAPK/ERK, MAPK/JNK and MAPK/p38. Generally, the covalent conjugation of a soluble form of LC3B (LC3B-I) with phosphatidylethanolamine to form a nonsoluble form (LC3B-II) is a hallmark of autophagy [16]. Therefore, we first examined the induction of autophagy by western blot analysis of the ratio of LC3B-II:ACTB/beta-actin, and demonstrated that TGFB1 promoted the conversion of LC3B-I to LC3B-II in PDAC cells in a dose- and time-dependent manner (Figure 2A). Moreover, since LC3B relocates to autophagosomes and exhibits a punctate expression pattern during autophagy progression, we then monitored autophagic alterations by analyzing GFP-LC3B localization. As shown in Figure 2B, treatment of PANC-1 and BxPC-3 cells with 5 ng/mL TGFB1 for 24 h significantly induced GFP-LC3B dot formation. Furthermore, transmission electron microscopy (TEM) revealed an increase in autophagosomes in the cytoplasm of PANC-1 cells treated with 5 ng/mL TGFB1 for 24 h and in BxPC-3 cells treated with 2 ng/ml TGFB1 for 24 h (Figure 2C).
Figure 2.
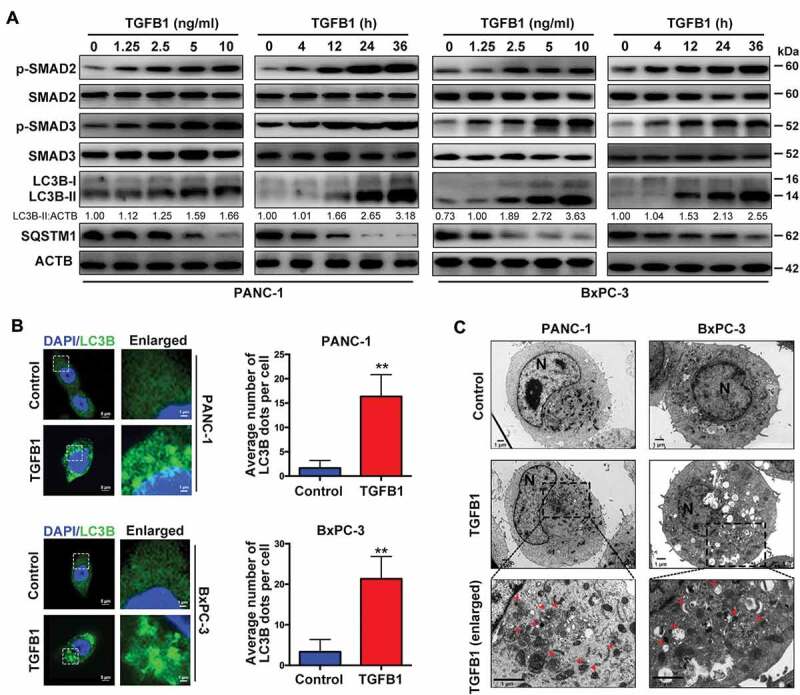
TGFB1 induces autophagy in human pancreatic cancer cell lines. (A) Dose-dependent effect of TGFB1 treatment for 12 h on SMAD2/3 activation and conversion of LC3B-I to LC3B-II. The conversion of LC3B-I to LC3B-II in PANC-1 or BxPC-3 cells treated with 10 ng/ml or 2 ng/ml TGFB1 for a time gradient, respectively. The LC3B-II:ACTB ratio was calculated using ImageJ 1.51e. (B) PANC-1 and BxPC-3 cells expressing GFP-LC3B were treated with 5 ng/mL or 2 ng/ml TGFB1 for 24 h, respectively. Representative fluorescence images of GFP-LC3B dot formation were observed by confocal microscopy (left panels; magnification scale bar, 5 μm; scale bar in enlarged image, 1 μm). The number of GFP-LC3B dots per cell was quantified (right panels). (C) Representative transmission electron microscopy images of PANC-1 and BxPC-3 cells treated with 5 ng/mL or 2 ng/ml TGFB1 for 24 h, respectively. Red arrowhead represents autophagic vacuole; N indicates the cell nucleus (Magnification scale bar, 1 μm).
Because autophagic flux is a dynamic process, it is imperative to examine whether autophagosome accumulation in cells results from enhanced autophagosome formation or decreased autophagosome clearance. We blocked autophagic flux using the lysosomal inhibitor chloroquine (CQ) and activated it through the inhibition of the mammalian target rapamycin (RAP). As indicated in Figure 3A, the addition of CQ dramatically increased the accumulation of LC3B-II in both PANC-1 and BxPC-3 cells with TGFB1 treatment. Furthermore, the abundance of SQSTM1 (sequestosome 1), an LC3B binding protein and receptor that is degraded via the autophagic process [17], was dramatically decreased after RAP treatment. However, when CQ was combined with RAP, the SQSTM1 levels were increased in both cell lines. The TGFB1 had a similar effect with RAP on the accumulation of LC3B-II and SQSTM1 (Figures 2A and 3A), suggesting that CQ blocked TGFB1-induced autophagic flux in pancreatic cancer cells. Because autophagosome maturation depends on its fusion with a lysosome, inhibition of the fusion process or the activation of lysosomal proteases impairs autophagic degradation. To confirm whether TGFB1 promoted autophagosome maturation, a GFP-RFP-LC3B construct was used to assess autophagic flux. The GFP signal is sensitive to pH and is quenched in the acidic environment of the lysosome, whereas RFP is substantially more stable. Therefore, the fusion of autophagosomes with lysosomes results in the loss of yellow puncta (colocalization of both GFP and RFP fluorescence) and the appearance of red-only puncta [18]. As shown in Figure 3B, CQ inhibited the maturation of autophagy, resulting in predominant autophagosomes (yellow) in pancreatic cancer cells. Conversely, in TGFB1-treated cells, only portions of the LC3B-positive puncta were yellow, similar to the RAP-treated cells that primarily displayed red puncta (Figure 3B,C). Given that the addition of TGFB1 had an effect similar to that of RAP treatment, we presumed that TGFB1 induced autophagic flux by promoting the fusion of autophagosomes and lysosomes in pancreatic cancer cells.
Figure 3.
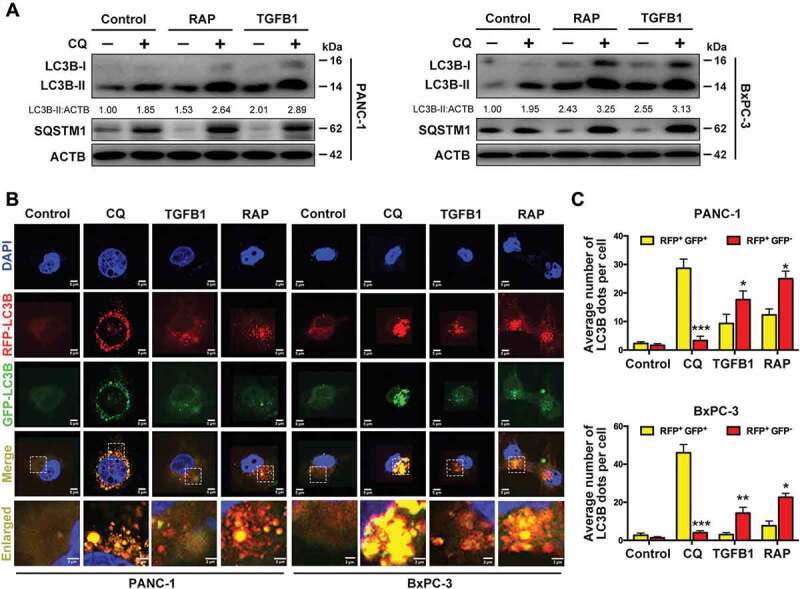
TGFB1 promotes autophagic flux to degrade the SQSTM1. (A) Western blot analysis of conversion of LC3B-I to LC3B-II with treatment of PANC-1 and BxPC-3 cells with TGFB1, RAP (100 nM) or combined with CQ (10 μM) for 24 h. (B) PANC-1 and BxPC-3 cells were transfected with GFP-RFP-LC3B and treated with CQ, TGFB1, or RAP for 24 h, and the changes in green and red fluorescence were observed using a confocal microscope (Magnification scale bar, 5 μm; scale bar in enlarged image, 2 μm). (C) The numbers of acidified autophagosomes (RFP+ GFP−) versus neutral autophagosomes (RFP+ GFP+) per cell in each condition were quantified.
SMAD4 is involved in autophagy induction by TGFB1 in SMAD4-positive PDAC cells
As indicated in Figure 4A, LC3B protein levels were examined in five pancreatic cancer cell lines (PANC-1, SW1990, MIA PaCa-2, CFPAC-1 and BxPC-3) and compared with those in normal human pancreatic ductal epithelium (HPDE) cells after treatment with 5 ng/ml TGFB1 for 24 h. SMAD4-negative cells had a higher response to TGFB1 stimulation than did SMAD4-positive cells, with a higher level of LC3B accumulation. We studied the signaling pathways that mediate autophagy induction by TGFB1 in cells with a distinct SMAD4 status. PANC-1 and MIA PaCa-2 cells were transfected with shRNA against SMAD4 to downregulate the SMAD4 expression (Figure 4B). As indicated in Figure 4C,D, the relative increase in GFP-LC3B dot formation due to TGFB1 induction was greater in cells transfected with scramble-shRNA than in cells with SMAD4 knockdown (PANC-1: 6.4-fold vs. 2.4-fold change; MIA PaCa-2: 16.0-fold vs. 4.1-fold change), although SMAD4 knockdown promoted GFP-LC3B dot formation in SMAD4-positive PDAC cells. Moreover, SMAD4 knockdown also abolished the TGFB1–induced increase in the abundance of LC3B-II and blocked the autophagic degradation of SQSTM1 to upregulate its protein level (Figure 4E,F).
Figure 4.
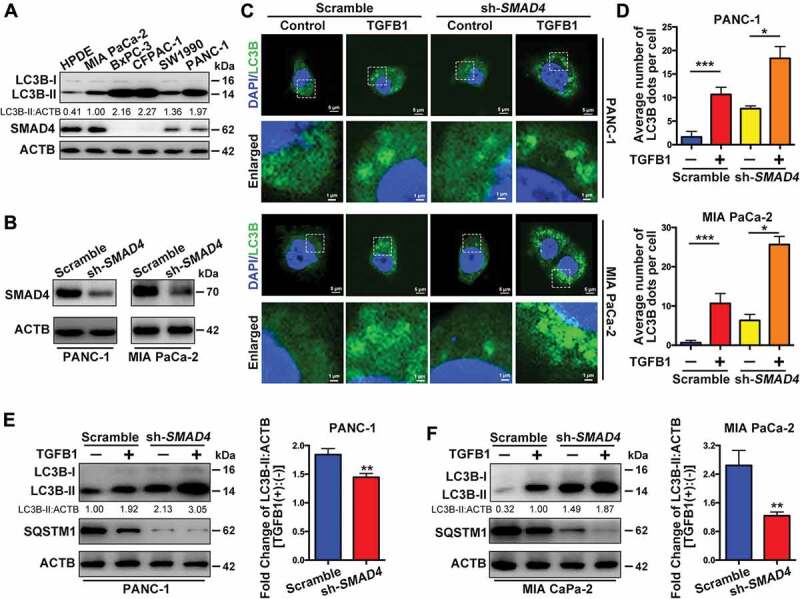
SMAD4 is involved in autophagy induction by TGFB1 in SMAD4-positive PDAC cells. (A) The levels of LC3B and SMAD4 expression were examined in pancreatic cancer cell lines and HPDE cells after 5 ng/ml TGFB1 treatment for 24 h. (B) Western blotting indicated that PANC-1 and MIA PaCa-2 cells were transfected with shRNA against SMAD4 to silence SMAD4 expression. (C) The effect of TGFB1 on GFP-LC3B dot formation was evaluated in PANC-1 and MIA PaCa-2 cells with silencing of SMAD4 (Magnification scale bar, 5 μm; scale bar in enlarged image, 1 μm). (D) After PANC-1 and MIA PaCa-2 cells were SMAD4 silenced and treated with TGFB1, the number of GFP-LC3B dots per cell was quantified. (E and F) Western blot analysis showed that silencing of SMAD4 altered the effect of TGFB1 (5 ng/ml) on the conversion of LC3B-I to LC3B-II and on SQSTM1 expression in PANC-1 and MIA PaCa-2 cells. TGFB1 induced a fold change of the LC3B-II:ACTB ratio in cells with silencing of SMAD4.
MAPK/ERK activation is responsible for TGFB1-induced autophagy in SMAD4-negative PDAC cells
Because TGFB1 also activates the non-SMAD signal transduction pathway [19], we further examined the potential pathways in SMAD4-negative PDAC through GSEA analysis. The results implied the possible involvement of the KRAS-MAPK pathways in response to TGFB1 stimulation (Figure 5A,B). Furthermore, we examined GFP-LC3B dot formation in SMAD4-negative BxPC-3 and CFPAC-1 cells treated with MAPK/p38 inhibitor SB203580, MAPK/JNK inhibitor SP600125 or MAPK1/ERK2-MAPK3/ERK1 inhibitor UO126. Among these inhibitors, the inhibitory effect on TGFB1-stimulated GFP-LC3B dot formation was the most significant in cells treated with UO126 (Figure 5C,D, Fig. S3). The fold changes in TGFB1-induced GFP-LC3B dot formation in CFPAC-1 cells treated with vehicle, UO126, SB203580 or SP600125 were approximately 8.0, 6.0, 7.3 and 6.9, respectively. A similar phenomenon was also observed in BxPC-3 cells. We then confirmed that UO126 suppressed LC3B-II accumulation by TGFB1 and partially attenuated the TGFB1-induced decrease of SQSTM1 (Figure 5E), suggesting an important role of MAPK/ERK activation in the TGFB1-induced autophagy.
Figure 5.
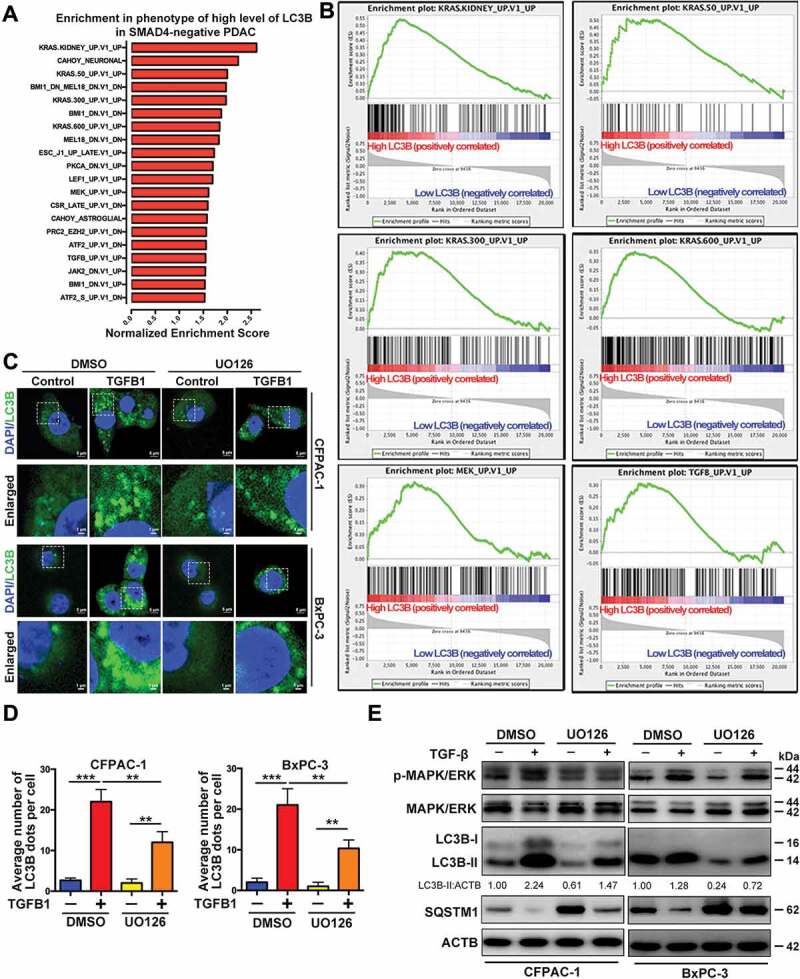
MAPK/ERK activation is involved in TGFB1-induced autophagy in SMAD4-negative PDAC cells. (A) The oncogenic signature gene set was used to run the GSEA analysis. Top 20 gene sets enriched in the phenotype of high-level LC3B expression in SMAD4-negative PDAC, ordered by normalized enrichment score. (B) Enrichment plots show six gene sets upregulated in SMAD4-negative PDAC with high-level LC3B expression. (C) TGFB1 (1 ng/ml) induced GFP-LC3B dot formation in CFPAC-1 and BxPC-3 cells with UO126 treatment (Magnification scale bar, 5 μm; scale bar in enlarged image, 1 μm). (D) After CFPAC-1 and BxPC-3 cells were treated with UO126, the number of GFP-LC3B dots per cell produced by TGFB1 induction was quantified. (E) Western blot analysis showed that inactivation of MAPK/ERK mitigated the effect of TGFB1 on the conversion of LC3B-I to LC3B-II and SQSTM1 expression.
The roles of TGFB1-induced autophagy in SMAD4-positive PDAC cells
Because autophagy has dual roles, the results of GSEA analysis indicated that autophagy might have different effects on proliferation and migration in SMAD4-positive and SMAD4-negative cells (Fig. S4 and Table S2), thus affecting the balance between these two processes. The KEGG gene set was used for GSEA analysis. In SMAD4-positive cells, TGFB1 decreased the proliferation and increased the apoptosis of PANC-1 and MIA PaCa-2 cells (Figure 6A–C). We administered CQ to inhibit autophagy, including TGFB1-induced autophagy, and observed an inhibitory effect on the proliferation and an enhancing effect on the apoptosis of SMAD4-positive PDAC cells. Notably, treatment with CQ enhanced the effects of TGFB1 on cell growth and apoptosis (Figure 6A–C). Furthermore, the combination index (CI) of CQ with TGFB1 was assessed, and the calculated CIs were less than 1, indicating a synergistic effect on growth inhibition between CQ and TGFB1 in PANC-1 and MIA PaCa-2 cells (Figure 6D). These results suggested that the suppression of TGFB1-induced autophagy appeared to inhibit the proliferation of PANC-1 and MIA PaCa-2 cells. Additionally, although inhibition of autophagy by CQ treatment inhibited migration independently of TGFB1 in both sets of cells, the relative increase in migrated cells by TGFB1 induction was greater in the PANC-1 group with CQ treatment (approximately three-fold) than in the group with vehicle treatment (approximately two-fold change; Figure 6E,F). Similar results were also observed in MIA PaCa-2 cells (4.2-fold vs. 2.4-fold change, respectively; Figure 6E,F). This result was further validated by western blot analysis of epithelial-to-mesenchymal transition (EMT) markers. Treatment with CQ did not significantly counteract the TGFB1-induced EMT (Figure 6G,H), possibly due to the fact that TGFB1-induced autophagy was also inhibited in the context of CQ treatment, suggesting that inhibition of TGFB1-induced autophagy has positive effects on EMT induction and the metastatic potential of SMAD4-positive cells.
Figure 6.
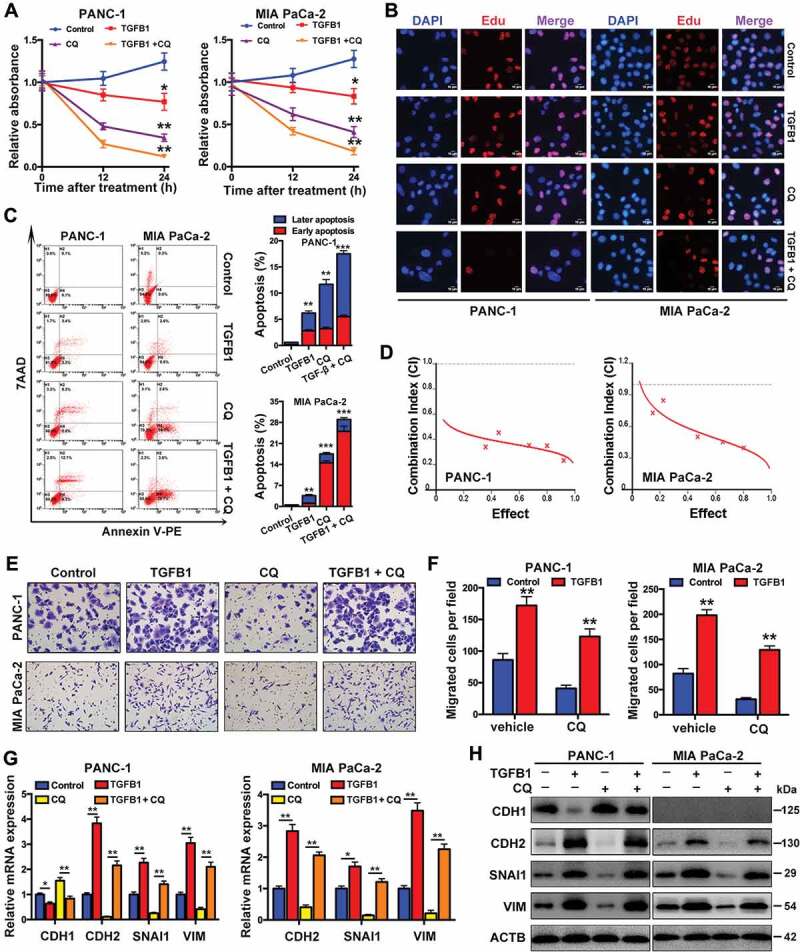
Roles of TGFB1-induced autophagy in SMAD4-positive PDAC cells. (A) PANC-1 and MIA PaCa-2 cells were treated with CQ only, TGFB1 only or a combination of CQ with TGFB1 to determine the number of viable cells. (B) EdU incorporation assays indicated the effects of TGFB1 only or a combination of CQ with TGFB1 on cell proliferation. All of the cell nuclei were counterstained with DAPI (Magnification scale bar, 10 μm). (C) Apoptosis analysis of cell lines treated with CQ only, TGFB1 only or a combination of CQ with TGFB1 by flow cytometric analysis (left panels). The early and later apoptosis populations were quantified (right panels). (D) The synergistic effect of CQ combined with TGFB1 was observed through the assessment of the CI of PANC-1 and MIA PaCa-2 cells. (E) PANC-1 and MIA PaCa-2 cells were treated with CQ only, TGFB1 only or a combination of CQ with TGFB1 to determine the cell migration (Original magnification, ×200). (F) The number of migrated cells per field was quantified. (G) Real-time PCR and (H) Western blot analysis showed the effects of inhibition of TGFB1-induced autophagy on the expression of EMT markers.
A previous study has shown that SQSTM1 could be involved in the nuclear translocation of SMAD4 [20]. Given that TGFB1-induced autophagy could decrease the level of SQSTM1 protein, we downregulated SQSTM1 expression using shRNAs against SQSTM1 (sh-SQSTM1#1 and sh-SQSTM1#2) and demonstrated that nuclear SMAD4 was downregulated, which was accompanied by the silencing of SQSTM1 (Figure 7A,B). Furthermore, we silenced SMAD4 to decrease its nuclear fraction (Fig. S5A and S5B) and to confirm the effects of SMAD4 knockdown on proliferation and migration. After treatment of SMAD4-positive cells with TGFB1, the silencing of SMAD4 increased proliferation (Figure 7C,D), inhibited apoptosis (Figure 7E) and decreased TGFB1-induced migration (Figure 7F). Moreover, we constructed a wild-type SMAD4 vector (WT SMAD4) and a mutant form of SMAD4 that loses its capacity for nuclear localization (SMAD4ΔNLS) for transfection into SMAD4-negative BxPC-3 cells (Figure 7G). A decreased fraction of nuclear SMAD4 contributed to the promotion of cell growth (Figure 7H,I) and repression of TGFB1-induced apoptosis and migration, as shown in BxPC-3 cells with WT SMAD4 and SMAD4ΔNLS (Figure 7J,K).
Figure 7.
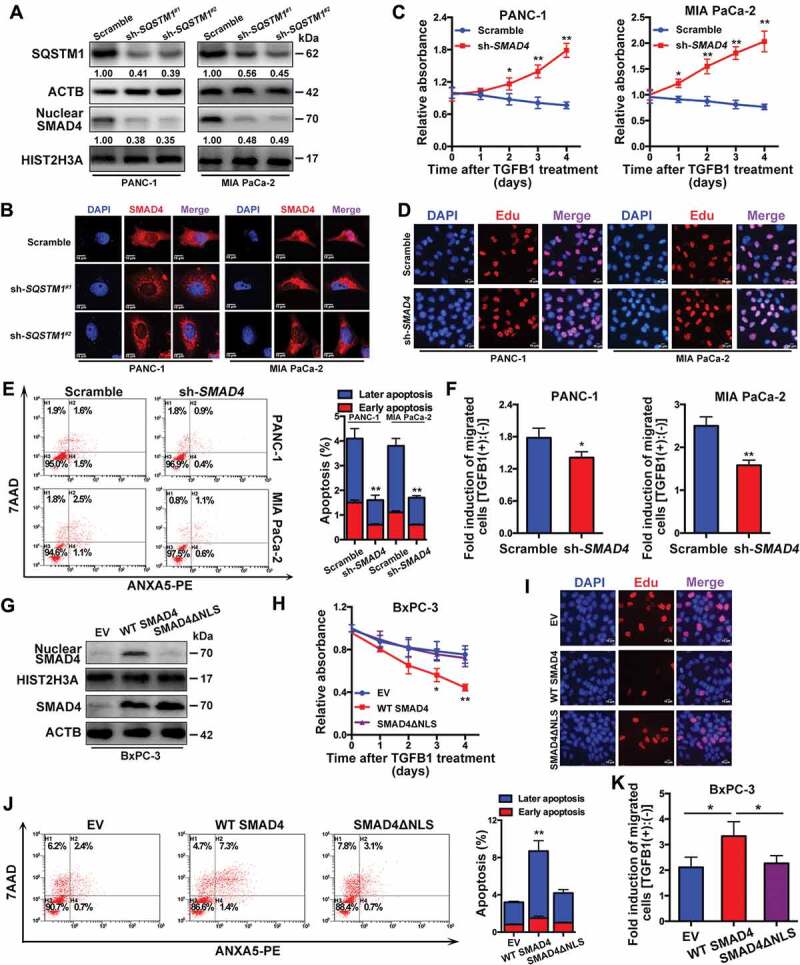
A decrease in nuclear SMAD4 is responsible for the dual roles of TGFB1-induced autophagy. (A) Silencing of SQSTM1 affected the nuclear translocation of SMAD4 in PANC-1 and MIA PaCa-2 cells. The densitometry analysis was calculated using ImageJ 1.51e. (B) Immunofluorescence staining with anti-SMAD4 antibody. All of the cell nuclei were counterstained with DAPI (Magnification scale bar, 10 μm). (C) The effect of SMAD4 knockdown on the number of viable cells was evaluated after TGFB1 treatment. (D) EdU incorporation assays showed the effects of SMAD4 knockdown on cell proliferation after TGFB1 treatment (Magnification scale bar, 10 μm). (E) Apoptosis analysis of PANC-1 and MIA PaCa-2 cells transfected with scramble shRNA or shRNA against SMAD4. (F) The effect of SMAD4 knockdown on migration was evaluated after TGFB1 treatment. (G) Western blot analysis indicated the nuclear translocation of SMAD4 in BxPC-3 cells with transfection of empty vector (EV) or the WT SMAD4 or SMAD4ΔNLS vector. (H) The effect of the decrease in the nuclear fraction of SMAD4 on the number of viable cells was evaluated after TGFB1 treatment. (I) EdU incorporation assays and (J) Apoptosis analysis of BxPC-3 cells transfected with EV or the WT SMAD4 or SMAD4ΔNLS vector. (K) The effect of the decrease in the nuclear fraction of SMAD4 on migration was evaluated after TGFB1 treatment.
The roles of TGFB1-induced autophagy in SMAD4-negative PDAC cells
To compare the difference in the effects of TGFB1-induced autophagy in SMAD4-negative and -positive cells, we examined cell proliferation and migration in BxPC-3 cells transfected with WT SMAD4 or SMAD4ΔNLS. The results indicated that the combination of CQ with TGFB1 increased cell proliferation and decreased apoptosis compared with CQ-only treatment (Figure 8A, Fig. S6A and S6B). Indeed, a similar phenomenon was observed in cells with SMAD4ΔNLS. However, once the cells were transfected with the WT SMAD4 vector, this phenomenon was reversed, indicating that the roles of TGFB1-induced autophagy were different for SMAD4-negative and SMAD4-positive cells (Figure 8A, Fig. S6A and S6B). We also assessed the CIs of CQ with TGFB1 and found that antagonistic effects were observed in BxPC-3 cells with empty vector (EV) and SMAD4ΔNLS, whereas a synergistic effect was noted in cells with WT SMAD4, suggesting that cell growth promoted by the suppression of TGFB1-induced autophagy appeared to be dependent on the lost nuclear translocation of SMAD4 (Figure 8B–D). Furthermore, the relative increase of TGFB1-induced migration was greater in cells with vehicle treatment (approximately 2.3-fold change) than in BxPC-3 cells with CQ treatment (approximately 1.5-fold change), although TGFB1 increased in both sets of cells. A similar result was also observed in cells with SMAD4ΔNLS (2.2-fold vs. 1.7-fold change), whereas the opposite result occurred in cells with WT SMAD4 (3.3-fold vs. 4.4-fold change; Figure 8E,F). To explain this, we examined the activation of MAPK/ERK and EMT markers. The results indicated that TGFB1 significantly activated MAPK/ERK in cells with EV and SMAD4ΔNLS, while in contrast, WT SMAD4 cells displayed a low level of MAPK/ERK activation. Furthermore, TGFB1 significantly induced EMT compared with autophagy inhibition by CQ treatment (Figure 8G,H). As shown in Figure 8A,F,H, the distinct roles of TGFB1-induced autophagy were likely associated with MAPK/ERK activation in SMAD4-negative cells. Given that autophagy enhanced SQSTM1 degradation, we observed the effect of SQSTM1 knockdown on MAPK/ERK activation. The silencing of SQSTM1 inhibited MAPK/ERK activation (Figure 8I) and decreased cell growth, regardless of TGFB1 treatment, and these effects were aggravated by UO126 treatment (Figure 8J). However, SQSTM1 silencing enhanced the capacity of TGFB1-induced migration (Figure 8K). This effect could occur because SQSTM1 silencing increased the MAPK/ERK activation induced by TGFB1, according to the comparison of the ratio of p-MAPK/ERK:ACTB in cells treated with or without TGFB1 (scramble:sh-SQSTM1 = 1.21:2.47; Figure 8I). After treatment with UO126, the enhancement of TGFB1-induced migration by silencing of SQSTM1 was suppressed (Figure 8I), accompanied by a decrease in TGFB1-activated MAPK/ERK [UO126 (-):UO126 (+) = 2.47:1.52; Figure 8I], indicating that autophagy inhibition decreased TGFB1-induced MAPK/ERK activation and migration.
Figure 8.
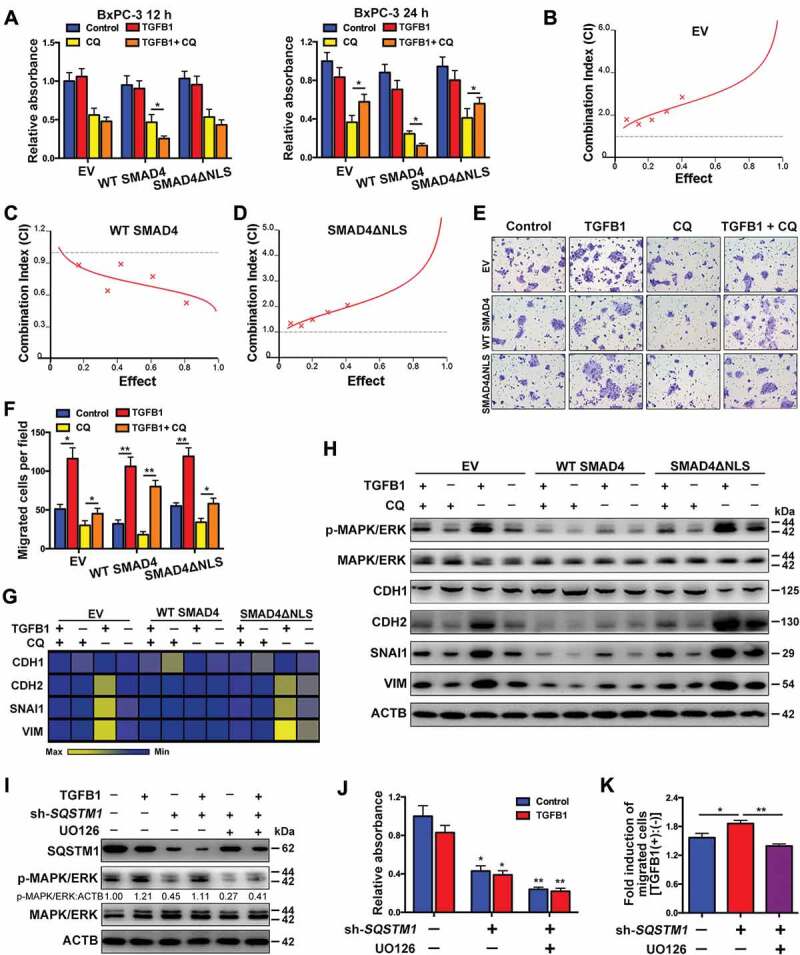
Roles of TGFB1-induced autophagy in SMAD4-negative PDAC. (A) Treatment with CQ and TGFB1 for 12 h (left panel) and 24 h (right panel) affected the number of viable BxPC-3 cells transfected with the WT SMAD4 or SMAD4ΔNLS vector. (B) An antagonistic effect of CQ combined with TGFB1 was observed according to assessment of the CI of BxPC-3 cells transfected with the EV. (C) A synergistic effect of CQ combined with TGFB1 was observed according to the assessment of CI of BxPC-3 cells transfected with the WT SMAD4 vector. (D) An antagonistic effect of CQ combined with TGFB1 was observed according to the assessment of CI of cells transfected with the SMAD4ΔNLS vector. (E) Treatment with CQ and TGFB1 for 24 h affected the migration of BxPC-3 cells transfected with the WT SMAD4 or SMAD4ΔNLS vector (Original magnification, ×200). (F) The number of migrated cells per field was quantified. (G) Western blot analysis showed the effects of CQ and TGFB1 on the expression of EMT markers in BxPC-3 cells with transfection of WT SMAD4 or SMAD4ΔNLS vector. (H) Heat map showing the effects of CQ and TGFB1 on the mRNA levels of EMT markers in BxPC-3 cells with transfection of the WT SMAD4 or SMAD4ΔNLS vector. (I) Western blot analysis showed the effects of SQSTM1 knockdown on MAPK/ERK kinase activation in BxPC-3 cells. (J) The effects of SQSTM1 knockdown on the number of viable BxPC-3 cells and (K) TGFB1-induced migration were evaluated after treatment with or without TGFB1.
LC3B is associated with poor prognosis in SMAD4-negative PDAC
Next, we further stratified patients into SMAD4-positive and SMAD4-negative PDACs and analyzed the correlation, although no statistical significance was noted in the correlation of LC3B expression with each clinicopathological feature across all 110 PDAC patients (Table S3). Interestingly, a high level of LC3B correlated with a later stage and greater vulnerability to nerve infiltration in SMAD4-negative PDAC (Table 1). In contrast, a high-volume tumor was most likely in SMAD4-positive PDAC with a high level of LC3B (Table 2). We observed the prognostic value of LC3B in 110 patients with PDAC and determined that there were no predictive effects of LC3B expression on overall survival (OS) or disease-free survival (DFS; Figure 9A,B). However, although the prognostic value of LC3B was not significant in SMAD4-positive PDAC patients, the trend suggested that patients with high levels of LC3B exhibited longer OS and DFS (Figure 9C,D). Notably, in SMAD4-negative patients, a high level of LC3B represented an unfavorable prognostic factor (Figure 9E,F).
Table 1.
Clinicopathological features and correlation with LC3B expression in SMAD4-negative PDAC.
| High LC3B |
Low LC3B |
|||
|---|---|---|---|---|
| Characteristics | No. | (Q Score ≥ 150; n = 48) |
(Q Score < 150; n = 30) |
P Value |
| Age (y) | 1 | |||
| <60 | 33 | 20 | 13 | |
| ≥60 | 45 | 28 | 17 | |
| Sex | 0.6328 | |||
| Female | 30 | 17 | 13 | |
| Male | 48 | 31 | 17 | |
| Tumor size (cm) | 0.148 | |||
| <4.0 | 50 | 34 | 16 | |
| ≥4.0 | 28 | 14 | 14 | |
| Tumor differentiation | 0.4067 | |||
| Well | 8 | 6 | 2 | |
| Moderate | 40 | 23 | 17 | |
| Poor | 30 | 19 | 11 | |
| Stage | 0.0111* | |||
| I-IIA | 40 | 19 | 21 | |
| IIB-IV | 38 | 29 | 9 | |
| Vessel infiltration | 0.2262 | |||
| Negative | 64 | 37 | 27 | |
| Positive | 14 | 11 | 3 | |
| Nerve infiltration | 0.0046** | |||
| Negative | 43 | 20 | 23 | |
| Positive | 35 | 28 | 7 | |
P values were derived with Fisher’s exact test.
All statistical tests are two sided.
Table 2.
Clinicopathological features and correlation with LC3B expression in SMAD4-positive PDAC.
| High LC3B |
Low LC3B |
|||
|---|---|---|---|---|
| Characteristics | No. | (Q Score ≥ 150; n = 13) |
(Q Score < 150; n = 19) |
P Value |
| Age (y) | 0.1657 | |||
| <60 | 15 | 4 | 11 | |
| ≥60 | 17 | 9 | 8 | |
| Sex | 0.4905 | |||
| Female | 17 | 8 | 9 | |
| Male | 15 | 5 | 10 | |
| Tumor size (cm) | 0.0108* | |||
| <4.0 | 19 | 4 | 15 | |
| ≥4.0 | 13 | 9 | 4 | |
| Tumor differentiation | 0.4067 | |||
| Well | 1 | 1 | 0 | |
| Moderate | 16 | 6 | 10 | |
| Poor | 15 | 6 | 9 | |
| Stage | 0.2893 | |||
| I-IIA | 18 | 9 | 9 | |
| IIB-IV | 14 | 4 | 10 | |
| Vessel infiltration | 0.3745 | |||
| Negative | 27 | 10 | 17 | |
| Positive | 5 | 3 | 2 | |
| Nerve infiltration | 0.2673 | |||
| Negative | 20 | 10 | 10 | |
| Positive | 12 | 3 | 9 | |
P values were derived with Fisher’s exact test.
All statistical tests are two sided.
Figure 9.
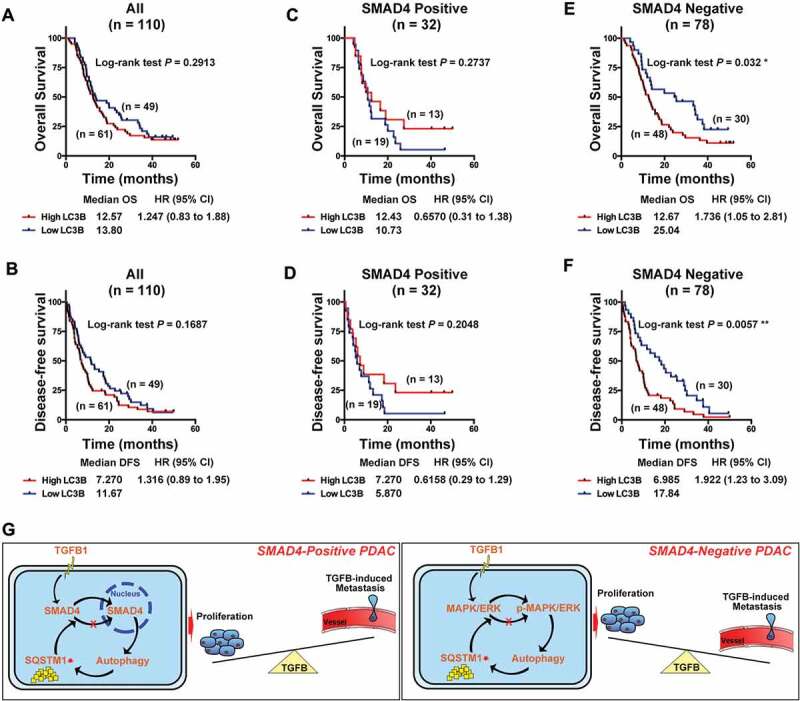
Autophagy is associated with poor prognosis in PDAC. (A) Kaplan-Meier analysis showed no prediction of LC3B to OS and (B) DFS in 110 PDAC patients. (C) LC3B showed no correlation with OS and (D) DFS in SMAD4-positive PDAC patients. (E) A high level of LC3B was associated with favorable of OS and (F) DFS in SMAD4-negative PDAC patients. (G) Schematic representation of the model, indicating the mechanism of TGFB1-mediated regulation of malignant behaviors via activation of autophagy in pancreatic cancer cells.
Discussion
To improve the prognosis of PDAC patients, it is highly desirable to classify PDAC into subtypes based on adequate molecular markers that either predict survival or point to an appropriate therapeutic option. Notably, SMAD4 is one of the major tumor suppressor genes in PDAC progression, and its loss also appears to be associated with tumor progression, patterns of failure, and EMT [7,21,22]. Intriguing studies have shown intact SMAD4 expression was associated with a local destruction and recurrence in PDAC, whereas the lack of SMAD4 expression was associated with distant metastases [5,23]. However, Winter et al. recently reported that loss of SMAD4 expression was neither associated with recurrence nor with early death in resected PDAC [24]. Therefore, the patterns of disease progression are not solely affected by SMAD4 status, and controversy remains in the prognostic value of SMAD4 status, especially in resected PDAC [22,25]. We hypothesized that the distinct roles of autophagy are involved in the malignant biological behavior in SMAD4-positive and SMAD4-negative PDAC.
TGFB1 has been reported to induce autophagy in hepatocellular carcinoma cells [26]. However, the mechanisms for activation of autophagy by TGFB1 and its role in PDAC progression have not been elucidated. In the current study, we examined several downstream signaling pathways of TGFB1, including the MAPK and SMAD pathways [19,26,27], to decipher the effects of TGFB1-induced autophagy. Notably, increases in the MAPK/p38 and MAPK/JNK phosphorylation levels by TGFB1 were not obvious compared with MAPK/ERK phosphorylation, especially with low-dose and short-time treatments with TGFB1, although TGFB1 stimulation activated MAPK/p38 and MAPK/JNK in SMAD4-negative BxPC-3 cells (Fig. S2). Moreover, among the three inhibitors, the inhibitory effect on TGFB1-stimulated GFP-LC3B dot formation was the most significant in cells treated with UO126. Thus, we assume that MAPK/ERK activation plays a more important role in TGFB1-induced autophagy in SMAD4-negative PDAC cells than MAPK/p38 and MAPK/JNK activation. However, we also found that MAPK/ERK activation by low-dose and short-time treatment of TGFB1 was not obvious in SMAD4-positive PANC-1 cells (Fig. S2). As shown in Figure 8H, the level of MAPK/ERK phosphorylation was generally low in SMAD4-positive cells compared with SAMD4-negative cells. Thus, we assume that MAPK/ERK may not play a main role in the TGFB1-mediated pathway in SMAD4-positive cells. The SMAD pathway is complex and under strict control by various regulators [28]. As shown in Fig. S7, TGFB1 stimulation decreased the expression of SKI, a factor disrupting the formation of SMAD4 complexes. SKI downregulation enhanced the activation of the TGFB1-SMAD4 pathway and contributed to increased SMAD7 expression, accompanied by an increased level of autophagy. SMAD7 overexpression in PDAC may promote tumor growth by selectively blocking antioncogenic TGFB1 responses and allowing for TGFB1-induced autophagy [29]. Thus, TGFB1-induced autophagy in SMAD4-positive cells is dependent mainly on the SMAD4 pathway, although SMAD4 expression contributes to the maintenance of a low level of autophagy.
PDAC is notable for common oncogenic events in the four well-known cancer genes of KRAS, CDKN2A/p16, TP53, and SMAD4, which affect tumor development and progression [6]. Recent work has established that tumors with KRAS mutations are particularly reliant on functional autophagy for growth and cell proliferation, making this pathway an attractive therapeutic target [30]. Rosenfeldt et al. identified the tumor suppressor TP53 as a determinant of whether autophagy suppresses or accelerates pancreatic cancer progression [12]. Reportedly, autophagy activation is prevalent in PDAC [31]. Interestingly, we also demonstrated that TGFB1-induced autophagy promoted cell migration and inhibited cell growth in SMAD4-negative PDAC, whereas this process had the opposite effects in SMAD4-positive PDAC. This observation suggests that genetic context affects the roles of autophagy in PDAC [12].
Notably, TGFB1 has dual roles in cell growth [32]. In addition to inducing EMT by increasing the metastatic potential [8], TGFB1 can also induce lethal EMT [33]. We also found that the dual roles might be associated with autophagy. In SMAD4-positive cells, TGFB1-induced autophagy degraded SQSTM1, which is involved in the nuclear translocation of SMAD4 [20]. Thus, decreasing nuclear SMAD4 contributed to cell growth and inhibited TGFB1-induced EMT [34,35]. However, in SMAD4-negative cells, the MAPK/ERK pathway was the main regulator of TGFB1-induced autophagy. As previous studies have shown, mutual activation of SQSTM1 and MAPK/ERK form a positive feedback axis to promote tumorigenesis [36]. Although the autophagic degradation of SQSTM1 by TGFB1 inhibited MAPK/ERK activation, it significantly enhanced TGFB1-induced MAPK/ERK activation. Thus, TGFB1-induced autophagy promoted migration and inhibited cell growth.
Indeed, higher levels of autophagy are present in most aggressive forms of human cancers and sustain tumor growth. Thus, blocking autophagy in mouse models of cancer restrains growth and progression towards more aggressive types of tumors [30]. These pro-tumorigenic and tumor-suppressive roles make autophagy complicated in PDAC progression. The association of autophagy with prognosis in PDAC patients remains controversial. Many investigators used different strategies and markers to assess the level of autophagy in PDAC tissue [37–39]. LC3B is regarded as one of important markers in the autophagic process and is evaluated to reflect the level of autophagy [40,41]. Consistent with other studies [38], we also demonstrated that LC3B had no prognostic value in PDAC patients, indicating that its combination with other markers was likely to improve its prediction. In our stratified analysis with 110 PDAC patients, LC3B correlated with tumor stage and was a predictor of poor prognosis in SMAD4-negative patients. Our results suggested that a high level of autophagy could be involved in metastatic potential and might indicate a short survival time in SMAD4-negative PDAC. However, in SMAD4-positive PDAC, LC3B correlated with tumor volume. Moreover, patients with a high level of LC3B showed longer OS and DFS times, although these differences were not significant. This finding indicated that autophagy was mainly involved in primary tumor growth in SMAD4-positive PDAC. Therefore, autophagy had different effects on disease progression depending on SMAD4 status. Further prospective studies designed to confirm and extend this finding have been proposed.
Taken together, the distinct roles of TGFB1-induced autophagy in SMAD4-positive and SMAD4-negative PDAC (Figure 9G) and contribute to efforts to improve patient survival with identification of critical prognostic factors leading to the development of molecular-targeting therapies for pancreatic cancer patients.
Materials and methods
TCGA dataset analysis
PDAC patient TCGA data on RNA expression (Level 3) in terms of RNA-seq by expectation-maximization were downloaded from the Cancer Genomics Brower of the University of California, Santa Cruz (UCSC; https://genome-cancer.ucsc.edu/). In total, 177 primary pancreatic cancer samples from patients with detailed gene expression data were chosen from the updated TCGA database according to the referenced parameters. The detailed demographics of these patients were characterized by the TCGA consortium. SMAD4 mutations and copy number, which were downloaded from c-BioPortal, were assessed. Given that the IHC results may also exhibit positive labels in PDAC with heterozygous SMAD4 deletion, samples were categorized as a dichotomous output, namely, positive (PDAC with wild-type SMAD4 and heterozygous SMAD4 deletion) or negative (homozygous SMAD4 deletion). Moreover, the median value of LC3B expression was used as a cutoff point to classify PDAC as ‘low LC3B expression’ or ‘high LC3B expression.’
Gene set enrichment analysis (GSEA)
GSEA was performed using GSEA version 3.0 from the Broad Institute at MIT, based on the TCGA dataset comprising 177 PDAC samples. Genes were classified by their correlation with phenotype, and every gene set ultimately received an enrichment score (ES). The indicated gene sets (c2.cp.kegg.v6.1 and c6.all.v6.1) were used to run GSEA, and 1000 gene permutations were used to generate a null distribution for ES. Then, each pathway received a normalization enrichment score (NES). A result was considered significant when the false discovery rate (FDR) was < 5% and the P-value was < 0.05.
Tissue microarray
The TMA was generated from formalin-fixed, paraffin-embedded tissues of 110 patients with PDAC, which were collected at the FUSCC in 2012. Patients were followed up regularly. Prior patient consent and approval from the Institutional Research Ethics Committee were obtained. The clinical information for the samples is presented in Table S3. The pathological grading was performed by two independent pathologists at our center.
Immunohistochemical staining
IHC staining of paraffin-embedded tissues with antibodies against LC3B (1:100; Cell Signaling Technology, 3868) and TGFB1/TGF-β1 (1:200; Proteintech, 21898–1-AP) was performed and scored to determine the protein expression profiles according to previously described standard procedures [42]. Nerve fiber was used as a positive control for LC3B. The following expression levels were based on the score obtained by the intensity and percentage of the IHC staining. The intensity was recorded as 0, 1, 2, and 3, referring to negative, weak, moderate, and strong staining, respectively. The percentage of positive cells was recorded from 0 to 100%. The results of staining were scored using the quick (Q) score, which was obtained by multiplying the percentage of positive cells by the intensity. The median values of the Q scores (Q = 150) were used as cutoff points to classify PDAC as ‘low expression’ or ‘high expression.’
Cell culture
The human pancreatic cancer cell lines MIA PaCa-2, CFPAC-1, BxPC-3, PANC-1 and SW1990 were obtained from American Type Culture Collection (ATCC, CRL-1420, CRL-1918, CRL-1687, CRL-1469 and CRL-2172). BxPC-3 was cultured in RPMI 1640 (Gibco, 21875158) at 37°C and 5% CO2, CFPAC-1 was cultured in IMDM (Gibco, 12440061), and the other cell lines were cultured in DMEM (Gibco, 11965–084). All cell culture media were supplemented with 10% heat-inactivated fetal bovine serum (FBS; Gibco, 10270–106), 100 U/mL penicillin (Gibco, 15140163). and 100 mg/mL streptomycin (Gibco, 15140163). The cell lines were authenticated by DNA fingerprinting in 2016 and were passaged in our laboratory fewer than 6 months after their receipt.
Reagents and antibodies
Recombinant human TGFB1/TGF-β1 (PeproTech, 100-21c) was added to the PANC-1 cell culture with a final concentration of 5 ng/ml. UO126 (S1102; used at 10 μM for 4 h), SP600125 (used at 10 μM for 2 h; S1460) and SB203580 (used at 20 μM for 2 h; S1076) were purchased from Selleck Chemicals. Chloroquine (CQ; C6628) and rapamycin (RAP; R0395) were purchased from Sigma-Aldrich and used at 10 μM and 100 nM for 24 h, respectively.
All commercial antibodies were purchased from the following resources. Antibodies against LC3B (3868) and SQSTM1 (88588) were purchased from Cell Signaling Technology (CST). All MAPK family antibodies were provided by the Phospho-MAPK Family Antibody Sampler Kit and the MAPK Family Antibody Sampler Kit (CST, 9910 and 9926). All SMAD family antibodies were provided by SMAD2/3 Antibody Sampler Kit (CST, 12747). Anti-CDH1 (E-cadherin; ab1416), anti-CDH2 (N-cadherin; ab18203) and anti-VIM/vimentin (ab8978) were purchased from Abcam. HIST2H3A/Histone H3 (Histone Cluster 2 H3 Family Member A; 17168–1-AP), ACTB (beta-actin; 60008–1-lg), TGFB1 (21898–1-AP) and SNAI1 (snail1; 13099–1-AP) antibodies were purchased from Proteintech.
RNA isolation and quantitative real-time PCR
Total RNA was extracted from cells and tumor samples, and cDNA was synthesized by reverse transcription using a TaKaRa PrimeScript RT reagent kit (Takara, RR014). The real time PCR analysis were performed using SYBR® Premix Ex Taq™ II (Takara, RR037A). The expression status of the candidate genes and ACTB were determined using an ABI 7900HT Real-Time PCR system (Applied Biosystems, Inc., USA). Primer sequences are listed in Table S4.
Western blot analysis
Western blot analysis was performed as previously described [42]. HIST2H3A and ACTB were used as the loading controls for nuclear protein and cytoplasmic protein, respectively. The grayscale of indicated protein was quantified by image analysis software (ImageJ 1.51e, NIH Image). All antibodies, including each target and loading control, were experimentally determined and validated in the linear range. The combined linear range was then used to determine how much sample should be loaded to produce a linear signal response for both the target protein and the internal loading control to ensure that the band intensity was detected within the same linear range to perform quantitative western blot analysis.
Transmission electron microscopy (TEM)
Cell pellets were fixed in 2% glutaraldehyde at 4°C overnight and washed three times with 0.1 M phosphate-buffered saline (PBS; Gibco, 10010023). The pellets were postfixed with 1% OsO4 for 2 h at room temperature (RT) and washed three times again with 0.1 M PBS. The samples were dehydrated using a series of graded ethanol and 100% acetone (Sigma, 650501) and were placed in acetone/Epon 812 (Sigma, 45359) (2:1) overnight at RT. Finally, the samples were embedded at 60°C for 48 h. Ultrathin sections (60–80-nm thick) were prepared using a Leica Ultracut UCT Ultramicrotome with a diamond knife and stained with uranyl acetate (2%) for 15 min, followed by Reynold’s lead citrate staining for 15 min. The samples were viewed via TEM (HITACHI, HT7700, Japan).
Combination index (CI)
The CIs of TGFB1 with CQ in pancreatic cancer cells were assessed as previously described [43,44], where CI < 1, CI = 1, and CI > 1 indicate synergism, an additive effect, and antagonism, respectively.
Constructs and transfection
A lentiviral vector containing GFP-LC3B reporter or GFP-RFP-LC3B plasmid was constructed by HANBIO (Shanghai, China). To silence SMAD4 expression, the pLKO.1 TRC cloning vector (Addgene_10878; deposited by David Root) was used to generate shRNA-expressing constructs against SMAD4. The 21-bp targets against SMAD4 were CAGATTGTCTTGCAACTTCAG. The short hairpin RNAs (shRNAs) were chemically synthesized from GeneChem (Shanghai, China) and resuspended in RNase-free water to a concentration of 20 mM. The GV248 vector was used to generate shRNA-expressing constructs against SQSTM1 by GeneChem (Shanghai, China). The 19-bp targets against SQSTM1 were TCTGGGCATTGAAGTTGAT (sh-SQSTM1#1) and AGG-AATTGACAATGGCCAT (sh-SQSTM1#2). Wild-type SMAD4 (WT SMAD4) and mutant SMAD4K45A/K46A/K48A without nuclear localization capacity (SMAD4ΔNLS) were cloned separately into the pCDH-CMV-MCS-EF1-Puro vector (System Biosciences, USA) [45]. Transfection experiments were performed according to the manufacturer’s instructions. In brief, cells were seeded into 6-well plates overnight and transfected with constructs using Lipofectamine 2000 (Invitrogen, 11668019) according to the manufacturer’s instructions. After 48 h of transfection, the cells were incubated with the indicated reagents for further experiments.
Confocal microscopy
Cells transfected with GFP-LC3B or GFP-RFP-LC3B were cultured in six-well plates with cover slips at a density of 5 × 10⁴ cells per well and treated with TGFB1, CQ or RAP for 24 h. After fixation with 4% paraformaldehyde, the cover slips were mounted over a microscope slide in ProLong Gold Antifade Reagent containing 4′,6-diamidino-2-phenylindole (DAPI; Life Technologies, P-36,931). The change in LC3B localization was examined using confocal microscopy (LEICA SP5, Leica Biosystems, USA).
Immunofluorescence staining
Cells seeded on coverslips were fixed in 4% paraformaldehyde and permeabilized with 0.1% Triton X-100 (Sigma, T9284). Then, cells were blocked with 5% bovine serum albumin (BSA; Sigma, B2064) for 1 h and incubated with primary antibody (SMAD4; abcam, ab40759) at a dilution of 1:200 overnight at 4°C, followed by incubation with Alexa Fluor 594-conjugated goat anti-rabbit IgG (Jackson, 111–585-003) for 1 h. Nuclei was stained by 4′-6-diamidino-2-phenylindole (DAPI; Sigma, 32670) for 15 min. Finally, images were taken under a fluorescence microscopy (OLYMPUS, Tokyo, Japan).
Apoptosis analysis and cell count kit-8 (CCK-8) assays
Flow cytometric analysis was conducted to determine cell apoptosis with PE Annexin V Apoptosis Detection Kit I (Becton Dickinson and Company, 559763), according to the manufacturer’s protocol. Cell viability was determined every day by using CCK-8 (Dojindo Laboratories, CK04) according to the manufacturer’s instructions. All observations were reproduced at least three times in independent experiments.
EdU incorporation assay
Dissociated cells were exposed to 25 µM of 5-ethynyl-2′-deoxyuridine (EdU; RiboBio, C10310-1) for 4 h at 37°C, and then the cells were fixed in 4% paraformaldehyde. After permeabilization with 0.1% Triton-X-100, the cells were reacted with 1× Apollo reaction cocktail (RiboBio, C10310-1) for 30 min. Subsequently, the DNA contents of the cells were stained with Hoechst 33342 for 30 min and visualized under a fluorescence microscopy (OLYMPUS, Tokyo, Japan).
Transwell migration assay
A 24-well transwell chamber with an 8-mm-pore PET membrane (Corning, 353097) was used to conduct the migration assays. The lower chamber was filled with 800 μL of media containing 10% FBS. Subsequently, approximately 6 × 10⁴ cells were seeded in 200 μL of medium without serum in the top chamber for migration assay. The cells were allowed to migrate at 37°C with 5% CO2 over 24 h. After removal of the non-migrating cells, the remaining cells were washed, fixed, and stained with crystal violet. We counted the number of migrating and invading cells in six randomly selected fields at 200× magnification. Experiments were performed at least in triplicate.
Statistical analysis
Statistical analyses were performed using SPSS software (version 17.0, IBM Corp., Armonk, NY, USA) and the independent Student’s t-test (two-tailed) or one-way analysis of variance (ANOVA). Spearman correlation analysis was used to determine the correlation between LC3B and TGFB1 expression level. Fisher’s exact test was used to determine the correlation between LC3B and clinicopathological characteristics. Kaplan-Meier analysis was used to analyze OS and DFS. Statistical significance was based on two-sided P values of < 0.05. The data are presented as the mean ± SD.
Funding Statement
This study was jointly funded by the National Science Foundation for Distinguished Young Scholars of China [No. 81625016]; the National Natural Science Foundation of China [No. 81502031] and the Shanghai Sailing Program [NO.17YF1402500].
Acknowledgments
The authors would like to thank Prof. Yi Qin from the Cancer Research Institute (Fudan University) for the contribution of plasmid constructs and Huanyu Xia for assistance in collecting the patient data.
Disclosure statement
No potential conflict of interest was reported by the authors.
Supplementary Material
The supplementary material for this article can be accessed here.
References
- [1].Siegel RL, Miller KD, Jemal A.. Cancer statistics, 2018. CA Cancer J Clin. 2018;68:7–30. [DOI] [PubMed] [Google Scholar]
- [2].Wray CJ, Ahmad SA, Matthews JB, et al. Surgery for pancreatic cancer: recent controversies and current practice. Gastroenterology. 2005;128:1626–1641. [DOI] [PubMed] [Google Scholar]
- [3].Ryan DP, Hong TS, Bardeesy N.. Pancreatic adenocarcinoma. N Engl J Med. 2014;371:1039–1049. [DOI] [PubMed] [Google Scholar]
- [4].Bilimoria KY, Bentrem DJ, Ko CY, et al. National failure to operate on early stage pancreatic cancer. Ann Surg. 2007;246:173–180. [DOI] [PMC free article] [PubMed] [Google Scholar]
- [5].Iacobuzio-Donahue CA, Fu B, Yachida S, et al. DPC4 gene status of the primary carcinoma correlates with patterns of failure in patients with pancreatic cancer. J Clin Oncol. 2009;27:1806–1813. [DOI] [PMC free article] [PubMed] [Google Scholar]
- [6].Jones S, Zhang X, Parsons DW, et al. Core signaling pathways in human pancreatic cancers revealed by global genomic analyses. Science. 2008;321:1801–1806. [DOI] [PMC free article] [PubMed] [Google Scholar]
- [7].Wilentz RE, Su GH, Dai JL, et al. Immunohistochemical labeling for dpc4 mirrors genetic status in pancreatic adenocarcinomas: a new marker of DPC4 inactivation. Am J Pathol. 2000;156:37–43. [DOI] [PMC free article] [PubMed] [Google Scholar]
- [8].Massague J. TGFB1eta in Cancer. Cell. 2008;134:215–230. [DOI] [PMC free article] [PubMed] [Google Scholar]
- [9].Mizushima N, Komatsu M. Autophagy: renovation of cells and tissues. Cell. 2011;147:728–741. [DOI] [PubMed] [Google Scholar]
- [10].White E. Deconvoluting the context-dependent role for autophagy in cancer. Nat Rev Cancer. 2012;12:401–410. [DOI] [PMC free article] [PubMed] [Google Scholar]
- [11].Galluzzi L, Pietrocola F, Bravo-San Pedro JM, et al. Autophagy in malignant transformation and cancer progression. Embo J. 2015;34:856–880. [DOI] [PMC free article] [PubMed] [Google Scholar]
- [12].Rosenfeldt MT, O’Prey J, Morton JP, et al. p53 status determines the role of autophagy in pancreatic tumour development. Nature. 2013;504:296–300. [DOI] [PubMed] [Google Scholar]
- [13].Yang S, Wang X, Contino G, et al. Pancreatic cancers require autophagy for tumor growth. Genes Dev. 2011;25:717–729. [DOI] [PMC free article] [PubMed] [Google Scholar]
- [14].Mowers EE, Sharifi MN, Macleod KF. Autophagy in cancer metastasis. Oncogene. 2017;36:1619–1630. [DOI] [PMC free article] [PubMed] [Google Scholar]
- [15].Li L, Chen H, Gao Y, et al. Long noncoding RNA MALAT1 promotes aggressive pancreatic cancer proliferation and metastasis via the stimulation of autophagy. Mol Cancer Ther. 2016;15:2232–2243. [DOI] [PubMed] [Google Scholar]
- [16].Ravikumar B, Sarkar S, Davies JE, et al. Regulation of mammalian autophagy in physiology and pathophysiology. Physiol Rev. 2010;90:1383–1435. [DOI] [PubMed] [Google Scholar]
- [17].Pankiv S, Clausen TH, Lamark T, et al. p62/SQSTM1 binds directly to Atg8/LC3 to facilitate degradation of ubiquitinated protein aggregates by autophagy. J Biol Chem. 2007;282:24131–24145. [DOI] [PubMed] [Google Scholar]
- [18].Klionsky DJ, Abdalla FC, Abeliovich H, et al. Guidelines for the use and interpretation of assays for monitoring autophagy. Autophagy. 2012;8:445–544. [DOI] [PMC free article] [PubMed] [Google Scholar]
- [19].Moustakas A, Heldin CH. Non-SMAD TGF-beta signals. J Cell Sci. 2005;118:3573–3584. [DOI] [PubMed] [Google Scholar]
- [20].Bertrand M, Petit V, Jain A, et al. SQSTM1/p62 regulates the expression of junctional proteins through epithelial-mesenchymal transition factors. Cell Cycle. 2015;14:364–374. [DOI] [PMC free article] [PubMed] [Google Scholar]
- [21].Yamada S, Fujii T, Shimoyama Y, et al. SMAD4 expression predicts local spread and treatment failure in resected pancreatic cancer. Pancreas. 2015;44:660–664. [DOI] [PubMed] [Google Scholar]
- [22].Shin SH, Kim HJ, Hwang DW, et al. The DPC4/SMAD4 genetic status determines recurrence patterns and treatment outcomes in resected pancreatic ductal adenocarcinoma: A prospective cohort study. Oncotarget. 2017;8:17945–17959. [DOI] [PMC free article] [PubMed] [Google Scholar]
- [23].Crane CH, Varadhachary GR, Yordy JS, et al. Phase II trial of cetuximab, gemcitabine, and oxaliplatin followed by chemoradiation with cetuximab for locally advanced (T4) pancreatic adenocarcinoma: correlation of SMAD4(DPC4) immunostaining with pattern of disease progression. J Clin Oncol. 2011;29:3037–3043. [DOI] [PMC free article] [PubMed] [Google Scholar]
- [24].Winter JM, Tang LH, Klimstra DS, et al. Failure patterns in resected pancreas adenocarcinoma: lack of predicted benefit to SMAD4 expression. Ann Surg. 2013;258:331–335. [DOI] [PMC free article] [PubMed] [Google Scholar]
- [25].Qian ZR, Rubinson DA, Nowak JA, et al. Association of alterations in main driver genes with outcomes of patients with resected pancreatic ductal adenocarcinoma. JAMA Oncol. 2018;4:e173420. [DOI] [PMC free article] [PubMed] [Google Scholar]
- [26].Kiyono K, Suzuki HI, Matsuyama H, et al. Autophagy is activated by TGF-beta and potentiates TGF-beta-mediated growth inhibition in human hepatocellular carcinoma cells. Cancer Res. 2009;69:8844–8852. [DOI] [PubMed] [Google Scholar]
- [27].Heldin CH, Miyazono K, Ten Dijke P. TGF-beta signalling from cell membrane to nucleus through SMAD proteins. Nature. 1997;390:465–471. [DOI] [PubMed] [Google Scholar]
- [28].Tecalco-Cruz AC, Rios-Lopez DG, Vazquez-Victorio G, et al. Transcriptional cofactors Ski and SnoN are major regulators of the TGF-beta/SMAD signaling pathway in health and disease. Signal Transduct Target Ther. 2018;3:15. [DOI] [PMC free article] [PubMed] [Google Scholar]
- [29].Chen WB, Lenschow W, Tiede K, et al. SMAD4/DPC4-dependent regulation of biglycan gene expression by transforming growth factor-beta in pancreatic tumor cells. J Biol Chem. 2002;277:36118–36128. [DOI] [PubMed] [Google Scholar]
- [30].Guo JY, Chen HY, Mathew R, et al. Activated RAS requires autophagy to maintain oxidative metabolism and tumorigenesis. Genes Dev. 2011;25:460–470. [DOI] [PMC free article] [PubMed] [Google Scholar]
- [31].Yang S, Kimmelman AC. A critical role for autophagy in pancreatic cancer. Autophagy. 2011;7:912–913. [DOI] [PubMed] [Google Scholar]
- [32].Suzuki HI, Kiyono K, Miyazono K. Regulation of autophagy by transforming growth factor-beta (TGF-beta) signaling. Autophagy. 2010;6:645–647. [DOI] [PubMed] [Google Scholar]
- [33].David CJ, Huang YH, Chen M, et al. TGF-beta tumor suppression through a lethal EMT. Cell. 2016;164:1015–1030. [DOI] [PMC free article] [PubMed] [Google Scholar]
- [34].Vincent T, Neve EP, Johnson JR, et al. A SNAIL1-SMAD3/4 transcriptional repressor complex promotes TGF-beta mediated epithelial-mesenchymal transition. Nat Cell Biol. 2009;11:943–950. [DOI] [PMC free article] [PubMed] [Google Scholar]
- [35].Sakamoto T, Kobayashi S, Yamada D, et al. A histone deacetylase inhibitor suppresses epithelial-mesenchymal transition and attenuates chemoresistance in biliary tract cancer. PLoS One. 2016;11:e0145985. [DOI] [PMC free article] [PubMed] [Google Scholar]
- [36].Xu H, Sun L, Zheng Y, et al. GBP3 promotes glioma cell proliferation via SQSTM1/p62-ERK1/2 axis. Biochem Biophys Res Commun. 2018;495:446–453. [DOI] [PubMed] [Google Scholar]
- [37].Kim HS, Lee SH, Do SI, et al. Clinicopathologic correlation of beclin-1 expression in pancreatic ductal adenocarcinoma. Pathol Res Pract. 2011;207:247–252. [DOI] [PubMed] [Google Scholar]
- [38].Ko YH, Cho YS, Won HS, et al. Prognostic significance of autophagy-related protein expression in resected pancreatic ductal adenocarcinoma. Pancreas. 2013;42:829–835. [DOI] [PubMed] [Google Scholar]
- [39].Fujii S, Mitsunaga S, Yamazaki M, et al. Autophagy is activated in pancreatic cancer cells and correlates with poor patient outcome. Cancer Sci. 2008;99:1813–1819. [DOI] [PMC free article] [PubMed] [Google Scholar]
- [40].Liu JL, Chen FF, Lung J, et al. Prognostic significance of p62/SQSTM1 subcellular localization and LC3B in oral squamous cell carcinoma. Br J Cancer. 2014;111:944–954. [DOI] [PMC free article] [PubMed] [Google Scholar]
- [41].Niklaus M, Adams O, Berezowska S, et al. Expression analysis of LC3B and p62 indicates intact activated autophagy is associated with an unfavorable prognosis in colon cancer. Oncotarget. 2017;8:54604–54615. [DOI] [PMC free article] [PubMed] [Google Scholar]
- [42].Liang C, Shi S, Meng Q, et al. MiR-29a, targeting caveolin 2 expression, is responsible for limitation of pancreatic cancer metastasis in patients with normal level of serum CA125. Int J Cancer. 2018;143:2919–2931. [DOI] [PubMed] [Google Scholar]
- [43].Chou TC. Theoretical basis, experimental design, and computerized simulation of synergism and antagonism in drug combination studies. Pharmacol Rev. 2006;58:621–681. [DOI] [PubMed] [Google Scholar]
- [44].Chou TC. Drug combination studies and their synergy quantification using the Chou-Talalay method. Cancer Res. 2010;70:440–446. [DOI] [PubMed] [Google Scholar]
- [45].Xiao Z, Latek R, Lodish HF. An extended bipartite nuclear localization signal in SMAD4 is required for its nuclear import and transcriptional activity. Oncogene. 2003;22:1057–1069. [DOI] [PubMed] [Google Scholar]
Associated Data
This section collects any data citations, data availability statements, or supplementary materials included in this article.


