

ABSTRACT
Glucosamine (GlcN), a dietary supplement widely utilized to promote joint health and effective in the treatment of osteoarthritis, is an effective macroautophagy/autophagy activator in vitro and in vivo. Previous studies have shown that autophagy is required for hepatitis B virus (HBV) replication and envelopment. The objective of this study was to determine whether and how GlcN affects HBV replication, using in vitro and in vivo experiments. Our data demonstrated that HBsAg production and HBV replication were significantly increased by GlcN treatment. Confocal microscopy and western blot analysis showed that the amount of autophagosomes and the levels of autophagic markers MAP1LC3/LC3-II and SQSTM1 were clearly elevated by GlcN treatment. GlcN strongly blocked autophagic degradation of HBV virions and proteins by inhibiting lysosomal acidification through its amino group. Moreover, GlcN further promoted HBV replication by inducing autophagosome formation via feedback inhibition of mechanistic target of rapamycin kinase complex 1 (MTORC1) signaling in an RRAGA (Ras related GTP binding A) GTPase-dependent manner. In vivo, GlcN application promoted HBV replication and blocked autophagic degradation in an HBV hydrodynamic injection mouse model. In addition, GlcN promoted influenza A virus, enterovirus 71, and vesicular stomatitis virus replication in vitro. In conclusion, GlcN efficiently promotes virus replication by inducing autophagic stress through its dual effects in suppressing autophagic degradation and inhibiting MTORC1 signaling. Thus, there is a potential risk of enhanced viral replication by oral GlcN intake in chronically virally infected patients.
Abbreviations: ACTB: actin beta; ATG: autophagy-related; CMIA: chemiluminescence immunoassay; ConA: concanavalin A; CQ: chloroquine; CTSD: cathepsin D; DAPI: 4ʹ,6-diamidino-2-phenylindole; EV71: enterovirus 71; GalN: galactosamine; GFP: green fluorescence protein; GlcN: glucosamine; GNPNAT1: glucosamine-phosphate N-acetyltransferase 1; HBP: hexosamine biosynthesis pathway; HBV: hepatitis B virus; HBcAg: hepatitis B core antigen; HBsAg: hepatitis B surface antigen; HBeAg: hepatitis B e antigen; HBV RI: hepatitis B replicative intermediate; IAV: influenza A virus; LAMP1: lysosomal associated membrane protein 1; LAMTOR: late endosomal/lysosomal adaptor, MAPK and MTOR activator; ManN: mannosamine; MAP1LC3/LC3: microtubule associated protein 1 light chain 3; MTORC1: mechanistic target of rapamycin kinase complex 1; PHH: primary human hepatocyte; RAB7: RAB7A, member RAS oncogene family; RPS6KB1: ribosomal protein S6 kinase B1; RRAGA: Ras related GTP binding A; RT-PCR: reverse transcriptase polymerase chain reaction; SEM: standard error of the mean; siRNA: small interfering RNA; SQSTM1/p62: sequestosome 1; UAP1: UDP-N-acetylglucosamine pyrophosphorylase 1; VSV: vesicular stomatitis virus.
KEYWORDS: Autophagy, glucosamine, HBV, lysosomal acidification, MTORC1 signaling
Introduction
Hexosamines, including glucosamine (GlcN), mannosamine (ManN), galactosamine (GalN), and fructosamine (FruN), are amino sugars generated through the addition of an amine group to a hexose [1]. Among them, GlcN is a natural compound that is currently widely utilized as a dietary supplement to promote joint health, particularly in the elderly [2,3]. This dietary supplement has numerous biological and pharmacological properties, including anti-cancer, anti-aging, anti-inflammatory, and cardioprotective activities [4]. Except for mild gastrointestinal disorders, no serious adverse effects or toxicity have been observed in patients under GlcN treatment in clinical trials [2,4,5]. A few studies have indicated that oral GlcN intake may cause hepatotoxicity or other severe disease outcomes in a minority of patients with liver disease [6,7]. Despite its widespread use and large popularity, the safety of GlcN supplementation in patients with viral infection remains unclear and has not been well evaluated.
GlcN can activate the hexosamine biosynthesis pathway (HBP) to generate the end product uridine diphosphate N-acetyl-glucosamine (UDP-GlcNAc), which is used in glycan synthesis, and can induce O-linked GlcNAc (O-GlcNAc) protein modifications [8]. GlcN effectively activates autophagy in vitro and in vivo in both MTOR (mammalian target of rapamycin)-dependent and -independent ways, although the mechanisms have not been elucidated [9–11]. Thus, the exact mechanisms of GlcN regulating autophagic flux remain to be resolved.
Autophagy is a conserved catabolic process by which long-lived proteins and damaged organelles are sequestered in the cytoplasm and removed for recycling that is important for maintenance of cellular homeostasis [12]. Cellular autophagy functions as an intrinsic antiviral defense and contributes to the control of replication of some viruses, including vesicular stomatitis virus (VSV), human parainfluenza virus type 3, and Sindbis virus [13–15]. However, some viruses, including hepatitis B virus (HBV), influenza A virus (IAV), and enterovirus 71 (EV71), subvert or even enhance the autophagic machinery to promote viral replication and pathogenesis [16–19].
In this study, we focused mainly on the effects of GlcN on HBV replication and explored the underlying mechanisms. HBV is an enveloped DNA virus with a 3.2-kb circular, partially double-stranded DNA genome that causes hepatitis, liver cirrhosis, and hepatocellular carcinoma [20]. With an estimated 240 million chronically infected people worldwide, HBV infection is still a serious public health problem [21]. Recent studies have demonstrated that efficient HBV replication and envelopment depend on autophagy [18,19,22–24]. HBV replication and HBsAg production were strongly increased by interfering with autophagosome–lysosome fusion through silencing of either the RAB7 (RAB7, member RAS oncogene family) complex [24] or the SNAP29 (synaptosome associated protein 29) complex [25], suggesting that a relevant portion of viral products is degraded in the late phase of autophagy.
We investigated whether and how GlcN affects HBV replication in vitro and in vivo. We firstly found that GlcN treatment efficiently promotes HBV replication and HBsAg production in vitro and in vivo. GlcN blocks autophagosome maturation by inhibiting lysosomal acidification through its amino group. Moreover, GlcN further increases autophagosome formation via feedback inhibition of MTOR complex 1 (MTORC1) signaling in an RRAGA (Ras related GTP binding A) GTPase-dependent manner. GlcN treatment also promotes IAV, EV71, and VSV replication in vitro. Thus, GlcN may induce autophagic stress in host cells and thereby enhance the replication of certain viruses.
Results
GlcN promotes HBsAg expression and HBV replication
We first examined whether the hexosamines GlcN, ManN, and GalN [1] affect HBV replication in cell models. Primary human hepatocytes (PHHs) infected with HBV virions (Figure 1A) or human hepatoma cells HepG2.2.15 with stable HBV replication (Figure 1B) were treated with 5 mM of GlcN, ManN, or GalN. The effects of the hexosamines on HBV gene expression were assessed by measuring the levels of intracellular HBsAg and secreted HBsAg and HBeAg in cell culture supernatants. Interestingly, only GlcN significantly increased the amounts of secreted and intracellular HBsAg, by about twofold, without affecting HBeAg production, whereas ManN and GalN had no effect on HBsAg and HBeAg production. Next, cell viability was measured by CCK8 assay at 0, 24, 48, or 72 h after treatment with GlcN at different concentrations. GlcN was not cytotoxic at concentrations below 10 mM at all indicated time points in HepG2.2.15 cells (Figure 1C). Therefore, we used 5 mM GlcN in subsequent experiments.
Figure 1.

GlcN promotes HBV replication and HBsAg expression. (A) PHHs infected with HBV virions (multiplicity of infection [MOI] = 30) were treated with 5 mM GlcN, ManN, or GalN and harvested after 48 h. (B) HepG2.2.15 cells were treated with 5 mM GlcN, ManN, or GalN for 48 h. HBsAg and HBeAg from culture supernatants and intracellular HBsAg from cell lysates were quantified by CMIA. (C) Cell viability was measured by CCK8 assay at 0, 24, 48, or 72 h after treatment with GlcN at different concentrations (1, 2, 5, and 10 mM). (D–E) HepG2.2.15 cells were treated with 0, 1, 2, or 5 mM GlcN for 48 h. (E) Encapsidated HBV replicative intermediates were detected by Southern blotting. The levels of HBV genomes in culture supernatants were determined by qPCR. (F) HBV RNA levels in HepG2.2.15 cells were analyzed by northern blotting. S:CO, signal to cutoff ratio; RC, relaxed circular DNA; SS, single-stranded DNA. *P < 0.05; **P < 0.01; ns, not significant.
The effects of GlcN on HBsAg production and viral replication were further assessed at different doses in HepG2.2.15 cells with stable HBV replication and Huh7 cells with transient transfection of HBV plasmid. GlcN increased the amounts of secreted and intracellular HBsAg in a dose-dependent manner in HepG2.2.15 (Figure 1D) and Huh7 cells (Figure S1A). Intracellular HBV replication intermediates and HBV DNA in culture supernatants were determined by Southern blotting and quantitative real-time polymerase chain reaction (qPCR) analysis, respectively. The results revealed that intracellular and secreted HBV DNA were significantly increased by GlcN treatment (Figure 1E; S1B).
We examined the effects of GlcN on HBV production in other cell models, including HepG2 human hepatoma cells transfected with HBV plasmid pSM2 (Figure S2A), and Huh7 cells transfected with different HBV plasmids (Figure S2B and S2C). Consistently, GlcN significantly increased HBsAg, but not HBeAg production in these cell models. Moreover, a Dual-Glo luciferase reporter assay showed that GlcN had no significant effect on HBV promoter activity (Figure S3). Next, the effect of GlcN on HBV transcription was further examined by northern blotting. HBV RNA levels were slightly increased by GlcN treatment (Figure 1F), which may partially contribute to increased HBV replication. However, the effect of GlcN on HBV transcript levels did not sufficiently explain the enhanced HBV replication, indicating that some other mechanism(s) exist(s).
GlcN promotes HBV replication by suppressing autophagic degradation
It is well known that GlcN can activate the HBP to generate the end product UDP-GlcNAc and influences various cellular biosynthetic processes by glycosylation [8]. Therefore, we analyzed whether GlcN modulates HBV replication through regulating the HBP. O-GlcNAcylation is regulated by 2 enzymes, OGT (O-linked N-acetylglucosamine [GlcNAc] transferase) and OGA (O-GlcNAcase) [26,27]. Thus, HepG2.2.15 cells were treated with GlcN with or without the OGA inhibitor PUGNAc or OGT inhibitor OSMI-1 for 24 h [27]. Western blotting analysis revealed that PUGNAc and OSMI-1 increased and decreased, respectively, the O-GlcNAcylation of cells treated with GlcN (Figure 2A, right panel). However, these 2 inhibitors did not affect the effect of GlcN on HBsAg production (Figure 2A, left panel). Further, UDP-GlcNAc, the donor of O-GlcNAc for OGT activity, did not promote HBsAg production in HepG2.2.15 cells (Figure S4). To confirm that GlcN treatment does not modulate HBV replication through the HBP, HepG2.2.15 cells were transfected with specific siRNAs to knock down UAP1 (UDP-N-acetylglucosamine pyrophosphorylase 1) and GNPNAT1 (glucosamine-phosphate N-acetyltransferase 1), which are critically involved in the HBP, followed by GlcN treatment. Effective Uap1 and Gnpnat1 knockdown was verified by western blotting (Figure 2B, right panel). Knockdown of Uap1 and Gnpnat1 did not change the effect of GlcN on HBsAg production (Figure 2B, left panel). These results indicated that GlcN treatment acts on HBV replication independently of the HBP.
Figure 2.

GlcN promotes HBV replication by suppressing autophagic degradation. (A) HepG2.2.15 cells were treated with 5 mM GlcN with or without 100 µM OGT inhibitor PUGNAc or 10 µM OGA inhibitor OSMI-1 for 24 h. (B) HepG2.2.15 cells were transfected with specific siRNAs against UAP1 (siUAP1) and GNPNAT1/GNA1 (siGNPNAT1), or siRNA negative control (siNC) at 40 nM, followed by treatment with 5 mM GlcN for 48 h. HBsAg and HBeAg secreted in culture supernatants and intracellular HBsAg were quantified by CMIA. O-GlcNAc, UAP1, and GNPNAT1 expression was analyzed by western blotting, using ACTB as a loading control. (C and D) HepG2.2.15 cells were treated with 5 mM GlcN for 48 h. (C) The cells were fixed, incubated with primary antibody horse anti-HBsAg and rabbit anti-LC3, followed by staining with Alexa Fluor 488-conjugated anti-rabbit and Alexa Fluor 594-conjugated anti-horse secondary antibody IgG, respectively. Finally, the cells were imaged by confocal microscopy. Scale bar: 5 μm. (D) LC3, SQSTM1, and HBcAg expression were analyzed by western blotting. LC3-II:ACTB ratios were determined by densitometry. (E) Huh7 cells were transfected with mCherry-GFP-LC3 plasmid and then treated with 5 mM GlcN for 24 h. Cells cultured with 10 µM chloroquine (CQ) for 24 h were used as a positive control. The expression of mCherry and GFP was determined by confocal microscopy. Scale bar: 5 μm. (F) HepG2.2.15 cells were treated as in (C), followed by incubation with 10 μg/ml DQ-BSA for 30 min. The accumulating fluorescent signal of DQ-BSA was analyzed by confocal microscopy. Cells treated with EBSS for 2 h were used as a positive control. Scale bar: 5 μm. S:CO, signal to cutoff ratio. *P < 0.05; **P < 0.01; ns, not significant.
GlcN is an effective autophagy activator [10]. We and others have demonstrated that the HBV life cycle is closely related to the autophagy process [22]. Thus, we asked whether GlcN enhances HBV replication and HBsAg production through regulating autophagic flux. To investigate the effect of GlcN on autophagic flux and HBV replication and gene expression, HepG2.2.15 cells (Figure 2C,D) and Huh7 cells transfected without (Figure S5A) or with HBV plasmid pSM2 (Figure S5B and S5C) were treated with GlcN. Immunofluorescence microscopy revealed that the number of MAP1LC3/LC3 (microtubule associated protein 1 light chain 3) puncta as well as HBsAg expression were significantly increased by GlcN treatment (Figure 2C; S5A and S5B). LC3 puncta and HBsAg colocalized in hepatic cells, consistent with previous findings [19,24]. Moreover, GlcN also strongly increased the levels of the autophagic cargo LC3-II and SQSTM1, as well as HBcAg, as detected by western blotting (Figure 2D; S3C). These data suggested that GlcN treatment increased the number of LC3 puncta and HBsAg likely by blocking autophagic degradation, similarly to chloroquine (CQ) treatment and RAB7 silencing [24].
To strengthen the evidence that GlcN influences autophagic degradation, Huh7 cells were transfected with a plasmid expressing mCherry-GFP-LC3 and then treated with 5 mM GlcN or 10 µM CQ for 48 h. CQ inhibits acidification of the lysosomal compartment and prevents cargo degradation in lysosomes [24,28]. Like CQ treatment, GlcN led to an accumulation of LC3 puncta with strong expression of both GFP and mCherry, indicating incomplete autophagy and reduced cargo degradation in autophagosomes (Figure 2E). Confocal microscopy analysis showed the fluorescent signal of dye quenched-bovine serum albumin (DQ-BSA) decreased upon GlcN treatment, but increased upon treatment with Earle’s balanced salt solution (EBSS) (Figure 2F), suggesting that GlcN blocks autolysosomal proteolysis. These results consistently demonstrated that GlcN treatment increases the number of autophagosomes by blocking autophagic degradation.
GlcN suppresses autophagic degradation by suppressing lysosomal acidification
GlcN may interfere with autophagic degradation by blocking autophagosome–lysosome fusion or altering lysosomal proteolysis activity. Thus, it is necessary to distinguish these 2 modes of action. Firstly, the colocalization of LC3 and LAMP1 (lysosomal associated membrane protein 1), a lysosome marker, was analyzed by confocal microscopy. Colocalization of GFP-LC3 and LAMP1 was markedly elevated upon GlcN treatment in Huh7 cells (Figure S6). As previous studies from our laboratory and other groups have validated that there is a direct interaction between HBsAg and LC3 [19,24], the colocalization of HBsAg and LAMP1 was further analyzed by confocal microscopy in HepG2.2.15 cells. Colocalization of HBsAg and LAMP1 was increased upon GlcN treatment (Figure 3A). Thus, GlcN did not prevent autophagosome-lysosome fusion. Interestingly, LAMP1 expression was markedly increased in Huh7 cells after GlcN treatment. The LAMP1 level has been shown to be elevated by HBx-induced autophagy [18]. This is consistent with the finding that GlcN strongly promotes autophagosome formation and enhances lysosome production to form autolysosomes [12,29].
Figure 3.

GlcN suppresses autophagic degradation mediated by suppressing lysosomal acidification. (A) Huh7 cells were transfected with HBV plasmid pSM2, followed by treatment with 5 mM GlcN for 24 h. Cells treated with 5 µM CID1067700 (CID) for 24 h were used as a positive control. The cells were fixed, incubated with horse anti-HBsAg and rabbit anti-LAMP1 antibodies, and stained with Alexa Fluor 488-conjugated anti-rabbit and Alexa Fluor 594-conjugated anti-horse secondary antibody IgG, respectively. Colocalization of HBsAg and LC3 or LAMP1 was imaged by confocal microscopy. Scale bar: 5 μm. (B) HepG2.2.15 cells were treated with 5 mM GlcN for 24 h. The cells were stained with 100 nM LysoTracker Red or 1 μM LysoBeacon Green for 1 h. Cells treated with EBSS for 2 h were used as a positive control. The fluorescence intensity of LysoTracker Red or LysoBeacon Green was analyzed by confocal microscopy. Scale bar: 5 μm. (C) HepG2.2.15 cells were treated with 5 mM GlcN for 24 h. The cells were stained with acridine orange (AO) for 15 min. AO fluorescence was detected by confocal microscopy using a 488-nm (green) or a 561-nm (red) laser. Scale bar: 5 μm. (D) HepG2.2.15 cells were treated with 5 mM GlcN for 48 h. The levels of mature CTSD expression were analyzed by western blotting, using ACTB as a loading control. CTSD:ACTB ratios were quantified by densitometry. (E–G) HepG2.2.15 cells were treated with 5 mM GlcN with or without 10 µM CQ for 24 h. (E) Transfected cells were imaged by confocal microscopy using LC3-specific antibody. Scale bar: 5 μm. (F) LC3, SQSTM1, and HBcAg expression were analyzed by western blotting, using ACTB as a loading control. LC3-II:ACTB ratios were quantified by densitometry. (G) HBsAg and HBeAg secreted in culture supernatants were analyzed by CMIA. S:CO, signal to cutoff ratio. *P < 0.05; **P < 0.01; ns, not significant.
Likely, GlcN treatment may protect lysosomal degradation by preventing the acidification of lysosomal compartments. Thus, we determined changes in lysosomal functions in the course of autophagy by staining lysosomes with fluorescent dyes and measuring lysosomal enzyme activity. First, HepG2.2.15 cells were treated with 5 mM GlcN for 24 h or EBSS for 2 h, and then stained with 100 nM LysoTracker Red or 1 μM LysoBeacon Green for 1 h. The fluorescence intensities of LysoTracker and LysoBeacon staining were significantly decreased in cells treated with GlcN, but increased in EBSS-treated cells (Figure 3B), indicating low acidification of lysosomes. The effect of GlcN on lysosomal acidification was further examined by staining with acridine orange (AO), which emits bright red fluorescence when entering acidic lysosomes. HepG2.2.15 cells were treated with GlcN or CQ as described above, and then stained with 5 μM AO. Confocal microscopy revealed that lysosomal acidification was reduced in cells treated with GlcN or CQ when compared with control cells (Figure 3C). In addition, GlcN treatment clearly reduced the levels of the maturated form of lysosomal hydrolase CTSD (cathepsin D), as indicated by western blotting (Figure 3D).
Given that both GlcN and CQ may enhance HBV replication by inhibiting lysosomal degradation, we investigated whether these 2 chemicals would have any additive effect if applied simultaneously. HepG2.2.15 cells were treated with GlcN with or without CQ. Consistent with previous data (Figure 1D, 2C,D), the number of LC3 puncta (Figure 3E), levels of LC3-II, SQSTM1, and HBcAg (Figure 3F), and secreted HBsAg in culture supernatants (Figure 3G) were markedly elevated by GlcN or CQ treatment. However, there was no significant additional elevation when the cells treated with GlcN and CQ simultaneously. Thus, GlcN and CQ together did not have an additive effect on autophagic process at the concentrations used in the experiment.
The amino group of GlcN contributes to inhibition of lysosomal degradation and promotion of HBV replication
As GlcN suppressed lysosomal acidification and blocked autophagic degradation, we suspected that the presence of an amino group in the GlcN structure may contribute to the blockage of lysosomal proteolysis. Thus, we examined the function of the amino group of GlcN on HBV production. HepG2.2.15 cells were treated with 5 mM of GlcN or N-acetyl-d-glucosamine (Ace-GlcN), which is acetylated on the amino group. Unlike GlcN, Ace-GlcN showed no significant effect on LC3-II, SQSTM1, and HBcAg expression and HBsAg secretion in HepG2.2.15 cells (Figure 4A,B). Similar results were obtained in PHHs infected with HBV virions (Figure 4C,D). These results suggested that the amino group of GlcN may be required for inhibition of lysosomal degradation.
Figure 4.

GlcN promotes HBV replication by inhibiting lysosomal degradation through its amino group. (A and B) HepG2.2.15 cells were treated with 5 mM GlcN or N-Acetyl-d-glucosamine (Ace-GlcN) for 48 h, respectively. (C and D) PHHs with HBV virion infection (MOI = 30) were treated with 5 mM GlcN or Ace-GlcN for 48 h. (A and C) LC3, SQSTM1, and HBcAg expression were analyzed by western blotting, using ACTB as a loading control. LC3-II:ACTB ratios were quantified by densitometry. (B and D) HBsAg and HBeAg secreted in culture supernatants were analyzed by CMIA. S:CO, signal to cutoff ratio. *P < 0.05; **P < 0.01; ns, not significant.
GlcN promotes HBV replication by inducing autophagy via feedback inhibition of MTORC1 signaling
Previous studies have reported that inhibition of lysosome function may affect the MTORC1 signaling pathway in different cell systems [30,31]. In the present study, we observed that GlcN decreased the phosphorylation of MTOR as well as of 2 downstream kinases, RPS6KB1/p70-S6K (ribosomal protein S6 kinase B1) and ULK1/Atg1 (unc-51 like autophagy activating kinase 1), in HepG2.2.15 cells at 48 h after treatment (Figure S7A). This indicated that GlcN may enhance autophagy induction and autophagosome formation through inhibiting MTORC1 signaling. To confirm the feedback inhibition of MTORC1 signaling by GlcN treatment, HepG2.2.15 cells were treated with 5 mM GlcN and harvested at 0, 6, 12, 24, and 48 h after treatment. Western blotting analysis clearly indicated that the levels of phosphorylated MTOR decreased, whereas the levels of LC3-II and SQSTM1 increased by GlcN treatment (Figure 5A). Kinetically, GlcN treatment may block autophagic degradation at an early time point (< 6 h after adding GlcN), followed by feedback inhibition of MTORC1 activity at a later time point (24–48 h after adding GlcN).
Figure 5.
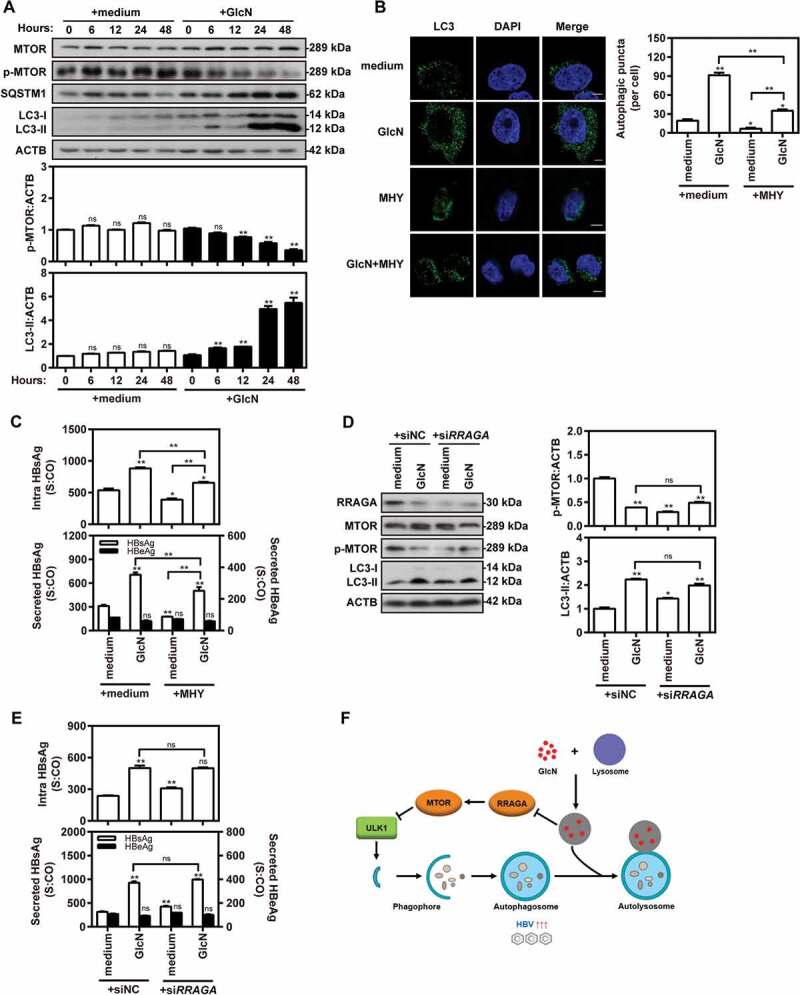
GlcN promotes HBV replication by inducing autophagy via feedback inhibition of MTOR signaling. (A) HepG2.2.15 cells were treated with 5 mM GlcN and harvested at 0, 6, 12, 24, and 48 h after treatment. Western blot analysis was conducted to detect MTOR, p-MTOR, LC3, and SQSTM1 expression, using ACTB as a loading control. LC3-II:ACTB and p-MTOR:ACTB ratios were quantified by densitometry. (B and C) HepG2.2.15 cells were treated with 5 mM GlcN with or without 2 µM MTOR activator MHY1485 (MHY) for 48 h. (B) Cells were fixed, incubated with rabbit anti-LC3 antibodies, followed by staining with Alexa Fluor 488-conjugated anti-rabbit secondary antibody IgG. Finally, the cells were imaged by confocal microscopy. Scale bar: 5 μm. (C) HBsAg and HBeAg secreted in culture supernatants and intracellular HBsAg from cell lysates were analyzed by CMIA. (D–E) HepG2.2.15 cells were transfected with specific siRNAs against RRAGA (siRRAGA) or siNC at 40 nM. After 24 h, the transfected cells were treated with 5 mM GlcN for 48 h. (D) RRAGA, MTOR, p-MTOR, LC3, and SQSTM1 expression were analyzed by western blotting. The LC3-II:ACTB and p-MTOR:ACTB ratios were quantified as described above. (E) HBsAg and HBeAg secreted in culture supernatants and intracellular HBsAg from cell lysates were analyzed as described above. S:CO, signal to cutoff ratio. *P < 0.05; **P < 0.01; ns, not significant. (F) A proposed model of how GlcN effectively promotes virus replication by inducing autophagic stress through its dual effects in suppressing autophagic degradation and inhibiting MTORC1 signaling pathway. On the one hand, GlcN blocks autophagic degradation by inhibiting lysosomal acidification through its amino group. On the other hand, GlcN further induces autophagosome formation via feedback inhibition of MTORC1 signaling in a RRAGA GTPase-dependent manner.
Based on the above findings, the promotion of HBV replication by GlcN treatment would depend on autophagy induction via MTORC1-dependent signaling. To prove this hypothesis, HepG2.2.15 cells were treated with GlcN with or without the MTOR activator MHY1485. Confocal microscopy revealed that MHY1485 suppressed the number of LC3 puncta in GlcN-treated cells (Figure 5B). MHY1485 also suppressed HBsAg production in GlcN-treated cells (Figure 5C). To confirm that GlcN inhibits MTORC1 or ULK1 signaling in the context of complete autophagic flux, HepG2.2.15 cells were treated with GlcN and the class III phosphatidylinositol 3-kinase inhibitor 3-MA or the MTOR inhibitor rapamycin. The data showed that rapamycin further enhanced HBsAg production induced by GlcN treatment (Figure S7B). However, 3-MA largely reversed the promotive effect of GlcN on HBsAg production. These data suggested that GlcN promotes HBV production by activating autophagy initiation signaling, leading to the nucleation, elongation, and closure of vesicles and autophagosome formation [12,32].
As a feedback mechanism, the RRAGA (Ras-related GTP-binding A) GTPase signaling pathway may also contribute to the inhibition of MTORC1 signaling caused by some classic lysosome inhibitors [30]. This mechanism may be also active when lysosomal functions are inhibited by GlcN. To analyze this, HepG2.2.15 cells were treated with 5 mM GlcN for 48 h after siRNA-mediated knockdown of RRAGA. Interestingly, both RRAGA silencing and GlcN treatment decreased RRAGA levels and MTOR phosphorylation (Figure 5D). However, there was no significant additional elevation when RRAGA-knockdown cells were treated with GlcN. HBsAg production was measured to assess the impact of RRAGA knockdown on HBV gene expression (Figure 5E). RRAGA knockdown significantly increased HBsAg production, but it did not increase the positive effect of GlcN on HBsAg production. These data suggested that GlcN induces lysosomal impairment and then forms a feedback loop to inhibit MTORC1 signaling via RRAGA GTPase signaling.
Collectively, besides its direct lysosomal degradation-inhibiting effect, GlcN induces autophagy via feedback inhibition of MTORC1 signaling in an RRAGA GTPase-dependent manner and thus promotes HBV replication (Figure 5F).
GlcN promotes HBV replication in an HBV hydrodynamic injection mouse model
To test the effect of GlcN application in vivo, an HBV hydrodynamic injection (HI) mouse model was established in C57BL/6 mice. At 14 days post HI with plasmid pAAV-HBV1.2, the mice were treated with PBS or 50 mg/kg/day GlcN by intraperitoneal injection for 3 weeks (Figure 6A). Mouse serum was collected at 0, 1, 2, or 3 weeks after GlcN treatment. The kinetics of serum HBsAg and HBV DNA indicated that GlcN treatment enhanced HBV replication and gene expression in mice (Figure 6B,C). While serum HBV markers in animals of the control group gradually decreased, most GlcN-treated mice retained higher levels of HBsAg and HBV DNA throughout the observation period (Figure 6B; S8A). Serum HBeAg levels were very low, and no significant difference in HBeAg levels was found between GlcN- and PBS-treated mice. To determine whether HI or GlcN may cause liver damage, GPT/ALT (glutamic-pyruvic transaminase) and GOT1/AST (glutamic-oxaloacetic transaminase 1) were determined by fully automated biochemical analysis. Mice of both the PBS- and GlcN-treated groups had low serum GPT/ALT (0–20 IU/ml) and GOT1/AST (0–20 IU/ml) levels around the normal cut-off level of 10 IU/ml (Figure S8B), indicating that neither HI nor GlcN caused measurable liver damage.
Figure 6.

Glucosamine promotes HBV replication in an HBV HI mouse model. (A) C57BL/6 mice received HI with 10 µg of plasmid pAAV-HBV1.2. At 14 days after HI, the mice were treated with PBS or 50 mg/kg/d GlcN by intraperitoneal injection for 3 weeks. Mouse serum samples were collected at 0, 1, 2, and 3 weeks after GlcN treatment. (B) Serological markers of HBV infection HBsAg, and HBV DNA were assayed at the indicated time points. Serum HBsAg was analyzed by CMIA. Positivity for HBsAg was defined as ≥ 1*. (C) Serum HBV DNA was quantified by qPCR. (D–F) Liver tissues were collected on day 21 after GlcN treatment. Two samples from each group were separately labeled with the indicated numbers and were used in further experiments. (D) Liver tissue sections were stained with an anti-HBc antibody (magnification, 200×). HBcAg-positive hepatocytes were counted. (E) HBV replicative intermediates were extracted and detected by Southern blotting. HBV DNA levels in the mouse liver were also measured by qPCR. (F) Western blot analysis was conducted to detect the MTOR, LC3, and SQSTM1 proteins, using ACTB as a loading control. LC3-II:ACTB ratios were quantified by densitometry. *P < 0.05; **P < 0.01; ns, not significant.
The effects of GlcN application on HBV replication and gene expression in the mouse liver tissue were also analyzed. HBcAg expression and HBV DNA levels were measured at day 21 after GlcN treatment. HBcAg-positive hepatocytes in mouse liver sections were quantified by immunohistochemical staining; they were significantly increased by GlcN as compared with PBS treatment (Figure 6D). Consistently, HBV DNA levels in mouse liver tissue samples were significantly increased by GlcN treatment as indicated by Southern blot and qPCR at day 21 after treatment (Figure 6E). LC3-II and SQSTM1 levels in liver tissues were strongly elevated, whereas MTOR phosphorylation was decreased by GlcN treatment (Figure 6F). These results indicated that GlcN application can enhance HBV replication by both suppressing autophagic degradation and inhibiting MTORC1 signaling in vivo.
GlcN promotes VSV, IAV, and EV71 replication in vitro
While viruses are degraded by complete autophagy, others utilize this process to enhance their replication or envelopment [15–17]. The interplay between autophagy and IAV, EV71, or VSV has been studied in recent years. IAV and EV71 can activate autophagy and induce autophagosome formation to promote their replication [16,17]. However, VSV infection is sensed by the host cell, which consequently activates antiviral autophagy [15]. We investigated the effects of GlcN on the replication of these 3 viruses.
Madin-Darby canine kidney (MDCK), rhabdomyosarcoma (RD), and Huh7 cells were all treated with GlcN. LC3-II and SQSTM1 levels were strongly increased in all 3 cell lines treated with GlcN as indicated by western blotting (Figure 7A-C). MDCK, RD, and Huh7 cells were infected with IAV, EV71, and VSV, respectively, followed by GlcN treatment. GlcN treatment promoted IAV transcription and replication, based on measurement of the production of two forms of IAV RNA (mRNA and cRNA; Figure 7D). Similarly, GlcN treatment increased EV71 replication (Figure 7E) and VSV replication (Figure 7F). In conclusion, GlcN promotes the replication of a broad range of viruses.
Figure 7.

GlcN enhances IAV, EV71, and VSV replication in vitro. (A–C) MDCK, RD, and Huh7 cells were treated with 10, 1, or 1 mM GlcN and harvested at 24 h after treatment. The levels of LC3 and SQSTM1 were detected by western blotting, using ACTB as a loading control. LC3-II:ACTB ratios were quantified by densitometry. (D) MDCK cells were infected with IAV (H3N2; MOI = 0.1) and treated with 10 mM GlcN for 24 h. The mRNA levels of the IAV NP gene were quantified by RT-qPCR. (E) RD cells were infected with EV71 (MOI = 1) and treated with 1 mM GlcN for 12 h before harvesting the cells. EV71 RNA levels were determined by RT-qPCR with EV71 VP1-specific primers. (F) Huh7 cells were infected with VSV (MOI = 1) and treated with 1 mM GlcN for 24 h. The culture medium was harvested, and the viral loads were determined by RT-qPCR with VSV-specific primers. *P < 0.05; **P < 0.01; ns, not significant. IAV, influenza A virus; EV71, enterovirus 71; VSV, vesicular stomatitis virus.
Discussion
The present study revealed that GlcN effectively promotes HBV replication and gene expression in vitro and in vivo by interfering with lysosomal acidification and degradation and by promoting autophagy initiation through feedback inhibition of MTORC1 signaling. Moreover, GlcN promotes IAV, EV71, and VSV replication in vitro. Our present study provides a rational explanation for potential side effects caused by GlcN supplementation in chronic HBV carriers.
GlcN is frequently used as a dietary supplement to promote joint health or treat osteoarthritis [1,3], often without any medical judgment and/or in a poorly purified form [7]. Clinical trials have shown no serious adverse effects and toxicity in patients receiving GlcN treatment [2,4,5]. Because of a lack of thorough clinical examination in patients complaining of joint pain before and during treatment with GlcN, mild forms of hepatotoxicity may remain undiagnosed. Only a few studies reported hepatotoxicity or other severe disease outcomes in patients with liver disease [6,7]. It remained unknown whether GlcN supplementation poses an extra risk of adverse effects, such as enhanced viral replication or rebound, in patients with chronic viral infection. Our findings indicate potential side effects caused by GlcN supplementation in patients with viral infections, including chronic HBV carriers, and suggest careful examination of clinical cases is needed in future.
O-GlcNAcylation plays an important role in different cellular processes [8]. However, we excluded a direct role of the HBP in GlcN-mediated enhancement of HBV replication. As indicated by previous studies, GlcN may induce autophagy via MTOR-dependent or -independent pathways [10,11,33]. Jiang et al. found that GlcN activates autophagy in rat nucleus pulposus cells by inhibiting the MTOR signaling pathway [11]. However, Shintani et al. showed that GlcN induced autophagy via an MTOR-independent pathway [33]. In the present study, GlcN blocked autophagic degradation of HBV virions and proteins by inhibiting lysosomal acidification, followed by further promotion of HBV replication through feedback inhibition of MTORC1 signaling in the lysosomes. Thus, GlcN can modulate autophagy in hepatocytes in a dual way. By using different fluorescent dyes, to stain lysosomes in GlcN-treated cells, we were able to demonstrate that GlcN suppresses acidification of lysosomal compartments, likely owing to the presence of its amino group. We cannot exclude that different cell types respond differently to GlcN treatment.
As GlcN, ManN, and GalN belong to a class of structural isomers among hexosamines, we originally reasoned they would have a similar effect on HBV production. However, surprisingly, only GlcN strongly increased HBV replication and HBsAg production in cell models, indicating that the specific spatial structure of GlcN is crucial to its effect. Moreover, the amino group of GlcN may also contribute to its effects. Indeed, Ace-GlcN had no significant effect on HBV production in HepG2.2.15 cells or PHHs. Thus, the amino group of GlcN causes the inhibition of lysosomal degradation and promotion of HBV replication. Although the amino group seems required for the inhibitory effect of GlcN on lysosomal acidification, the exact mechanisms underlying the action of GlcN need to be deeply investigated in future. Alkaline agents such as ammonium chloride and CQ can inhibit lysosomal degradation by reducing lysosomal acidity [30]. GlcN may have a direct inhibitory effect on the pH decrease and hydrolase activity in the lysosomes as an acid-neutralizing agent. However, we cannot exclude that ammonia generated from GlcN catabolism might also contribute to its effect [9]. GlcN can be taken up by glucose transporters and phosphorylated by hexokinase, and there is a competitive relationship between the HBP and glycolysis [34]. Although a portion of glucosamine enters the HBP, GlcN also enters glycolysis after glucosamine-6-phosphate (GlcN-6-P) is deaminated by GNPDA1 (glucosamine-6-phosphate deaminase 1), resulting in ammonia production [34]. Ammonia can cause autophagosome accumulation by interfering with lysosomal function [35]. In addition, ammonia may contribute to the activation of autophagy [9,36]. A study by Thompson’s group [9] revealed that GlcN is partially catabolized and leads to ammonia accumulation in MEF cells treated with GlcN. They also found that ammonia-induced autophagy depends on ATG5, but not ULK1/2. Thus, GlcN may inhibit lysosomal acidification through its amino group via a direct or indirect way.
Blockade of lysosomal functions can lead to enhanced autophagy initiation via inhibition of MTORC1 signaling [30]. Previous studies have reported that the disturbance of lysosomal function may ultimately affect v-ATPase or other molecules that are critical for MTORC1 activation [30,37]. The lysosome inhibitors BafA1 and concanavalin A (ConA) inhibit MTORC1 activity via direct anti-v-ATPase activity, which is closely linked to the LAMTOR (late endosomal/lysosomal adaptor, MAPK and MTOR activator)-RRAG-MTORC1 signaling axis [30,37]. However, CQ, E64D, and pepstatin A inhibit MTORC1 activity but do not act through a direct inhibitory effect on v-ATPase activity [30]. Thus, lysosomes are not only required for the autophagic machinery, but also affect autophagy induction. In the present study, we confirmed that GlcN acts as a lysosome inhibitor by interfering with lysosomal acidification, and inhibits MTORC1 signaling in an RRAGA-dependent manner. Both reduced lysosomal degradation and the consequent autophagy induction via MTOR-ULK1 signaling by GlcN facilitate HBV replication and HBsAg production.
Early autophagy is required for HBV replication and envelopment, whereas late autophagy is responsible for degrading the cargoes, including HBV virions and proteins [18,19,24]. These findings can explain why GlcN had a strong positive effect on HBV replication and increased HBV DNA amounts in cells and HBsAg by more than twofold. We confirmed that GlcN had no specific effect on HBV promoter activity, but a slight effect on the levels of HBV transcripts. The slightly elevated HBV transcript levels may partially contribute to the increase in HBV replication caused by GlcN, but does not explain the strong effect of GlcN on HBV production. Thus, other mechanisms related to post-transcriptional regulation, including autophagy, are expected to be involved. Again, the autophagic process is important for HBV replication, assembly, and release [18,19,24,38]. Thus, autophagy is a primary driving force for HBV replication and HBsAg production.
The effect of GlcN on HBsAg production by autophagy was investigated in HepG2.2.15 cells with stable HBV replication and Huh7 cells transiently transfected with HBV replicating plasmid. Consistently, previous studies by our lab and other groups have shown that autophagy regulates the production of HBsAg, but not HBeAg [18,24]. It is possible that the increased HBsAg RNA level may contribute to HBsAg production, but it does not explain the strong increase in HBsAg expression in GlcN-treated cells. The elevated 3.5-kb HBV transcript is responsible for HBeAg expression [20,39]. However, pregenomic mRNAs are substrates for formation of nucleocapsids and may partly be sequestered from the translation process if they are efficiently directed to the packaging process and form HBV nucleocapsids [39–41]. Certainly, a changed translation efficiency of HBsAg-specific RNA could be considered, but yet is not supported by experimental evidence. At the same time, HBeAg expression from 3.5-kb HBV transcripts was not enhanced in the presence of GlcN. Moreover, the degradation of HBsAg and HBV virions occurs after autophagosome–lysosome fusion and depends on lysosomal functions [24,42]. In the current study, GlcN prevented autophagic degradation of HBsAg and HBV virions by inhibiting the lysosomal functions. This process certainly contributes to the productivity of HBsAg and HBV virions. In contrast, HBeAg biosynthesis does not occur through the autophagic process, but the endoplasmic reticulum–golgi pathway, and therefore, is only marginally influenced by autophagy [24,43,44].
An important finding of this study is that GlcN treatment promotes IAV, EV71, and VSV replication (Figure 7). Thus, GlcN may have a broad effect on viral replication through preventing autophagic degradation. Thus, there may be some risks for enhanced viral infection related to oral GlcN supplementation in patients with chronic viral infections. This aspect should be considered and monitored in future.
Materials and methods
Mice
Male 6–8-week-old C57BL/6 mice were purchased from Beijing HFK Bioscience (China) and were maintained under specific pathogen-free conditions at the Central Animal Laboratory of Wuhan Institute of Virology, Chinese Academy of Sciences (WIV, CAS; license number: S03418030D). All animal experiments were approved by the Institutional Animal Ethical Committee of WIV, CAS (license number: WIVA02201801). This study was performed in strict accordance with recommendations in the Guide for the Care and Use of Laboratory Animals according to the regulation in the People’s Republic of China.
Hydrodynamic injection
Briefly, 10 μg of HBV plasmid pAAV/HBV1.2 was hydrodynamically injected into the tail vein of C57BL/6 mice in a volume of phosphate-buffered saline (PBS) solution equivalent to 10% of the body weight within 5–8 s [45]. Fourteen days after the injection, the mice were treated daily with 50 mg/kg/day glucosamine (GlcN) or PBS by intraperitoneal injection for 3 weeks. Mouse serum and liver samples were collected at the indicated time points.
Materials
The plasmids pSM2, pAAV/HBV1.2, and GFP-LC3 have been described previously [23,24,45]. The plasmids pHBV1.3, HBs-2-S, and HK-188 for HBsAg expression were kindly provided by Drs. Xinwen Chen (WIV, CAS, China), Reinhold Schirmbeck (University of Ulm, Germany), and Willian F. Carman (University of Glasgow, Scotland), respectively [46–48]. The mCherry-GFP-LC3 plasmid was purchased from Addgene (22,418; deposited by Jayanta Debnath). Acridine orange (A9231), 3-MA (M928), chloroquine (CQ, C6628), CID1067700 (SML0545), d-(+)-glucosamine hydrochloride (G4875), N-acetyl-d-glucosamine (A3286), d-mannosamine hydrochloride (M4670), d-(+)-galactosamine hydrochloride (G1639), rapamycin (R8781), and UDP-GlcNAc (U4375), were purchased from Sigma-Aldrich. LysoBeacon Green (Gene Copoeia, C048) and LysoTracker Red (Thermo Fisher, L12492) were provided by the indicated manufacturers. The MTOR activator MHY1485 was purchased from Selleckchem. EBSS (14,155,048) was provided by Thermo Fisher. Sequence information on siRNAs used is shown in Table S1.
Cell culture
HepG2.2.15 human hepatoma cells, harboring integrated dimers of the HBV genome (GenBank accession number, U95551), were cultured in RPMI-1640 medium (Gibco, 21,875–034) with 10% heat-inactivated fetal bovine serum (FBS; Merck Millipore, S0615), 1× MEM non-essential amino acids (NEAA) solution (Gibco, 11,140–035), 100 U/ml penicillin-streptomycin (Gibco, 15,140–122), and 500 µg/ml G418 (Merck Millipore, A2912) at 37°C in 5% CO2 [24]. Huh7 and HepG2 human hepatoma cells were grown in Dulbecco’s Modified Eagle’s Medium (DMEM; Gibco, 41,966–029) supplemented with 10% FBS, 1× MEM NEAA solution, and 100 U/ml penicillin-streptomycin as described above [24].
Cell transfection and GlcN treatment
As described previously [23,24], cells were seeded into 6-well or 12-well plates 1 day before transfection. When the cells reached 80–90% confluence, they were transfected with plasmids or siRNAs at indicated concentrations using Lipofectamine 2000 (Invitrogen, 11,668–019) according to the manufacturer’s instructions. After 4–6 h, the cells were transferred to fresh complete medium and incubated at 37°C in a humidified atmosphere. At the indicated time points, GlcN (with a stock concentration of 1 M) was added directly into the medium of transfected cells at different concentrations (1, 2, 5, or 10 mM) for different periods (6, 12, 24, or 48 h). Culture supernatants or cells were harvested at 72 h after transfection.
Virus infection
As described previously [49,50], the HBV particles used for primary human hepatocyte (PHH) infection were harvested from HepG2.117 cells. PHHs isolated from human liver specimens were kindly provided by Dr. Ruth Broering (University Hospital Essen, Germany). For HBV infection, PHH cells were cultured in primary hepatocyte maintenance medium (PMM) for 24 h and then inoculated with HBV particles (multiplicity of infection [MOI] = 30) in PMM with 4% PEG 8000 at 37°C for 24 h. After HBV infection, the cells were washed with PBS 3 times and maintained in PMM containing 2% dimethylsulfoxide (Sigma, D5879). The culture medium was renewed every other day. The influenza virus strain A/Hong Kong/498/97 (H3N2) and the Indiana serotype of VSV were provided by the China Center Type Culture Collection. EV7`as kindly provided by Renmin Hospital of Wuhan (Hubei, China). As described previously [50,51], Madin-Darby canine kidney (MDCK), rhabdomyosarcoma (RD), and Huh7 cells were separately cultured and infected with influenza A virus (IAV, H3N2; MOI = 0.1), enterovirus 71 (EV71; MOI = 1), or vesicular stomatitis virus (VSV; MOI = 1). Cells and supernatants were harvested at the indicated time points.
Analysis of HBV replication, transcription, and gene expression
For HBV DNA analysis, HBV replication intermediates of intracellular core particles were extracted from hepatoma cells and mouse liver tissue and were detected by Southern blotting according to published protocols [23,24,52]. Cells were lysed with lysis buffer containing 50 mM Tris-HCl, pH 7.4, 1 mM EDTA, and 1% NP-40 (Sigma-Aldrich, 74,385) at 4°C for 10 min. Cell debris and nuclei were removed by centrifugation, and the supernatant was mixed with 10 mM MgCl2 and 100 μg/ml DNase I (Roche, 000000010,104,159,001) at 37°C for 30 min. The reaction was stopped by the addition of 25 mM EDTA, and then, 0.5 mg/ml proteinase K (Qiagen, 19,133) and 1% sodium dodecyl sulfate (SDS) were added and the mixture was incubated at 55°C for 2 h. DNA was extracted with phenol/chloroform (1:1) and precipitated with isopropanol. The DNA was washed with 75% ethanol and dissolved in TE buffer (10 mM Tris-HCl, pH 8.0, 1 mM EDTA). DNA samples were resolved in 1% agarose gels and transferred to positively charged nylon membranes (GE Healthcare, RPN303B). The membranes were hybridized with a 32P-labeled full-length HBV probe prepared using a random priming labeling kit (GE Healthcare, RPN1633) in hybridization buffer (G-Biosciences, 786–160). Hybridization signals were visualized and analyzed using a Phospho-Imager (Cyclon, Packard Instrument). For HBV transcription analysis, HBV RNA was extracted and detected by northern blotting as described previously [23]. Briefly, total cellular RNA was extracted with TRIzol (Ambion, 15,596–018). Next, 10 μg total RNA was resolved in a 1% agarose gel containing Gly gel prep/running buffer (Ambion, AM8678) and was transferred onto a positively charged nylon membrane (GE Healthcare, RPN303B). The levels of intracellular HBsAg from cell lysates and secreted HBsAg and HBeAg in culture supernatants and mouse sera were determined using the Architect System and HBsAg and HBeAg chemiluminescence immunoassay (CMIA) kits (Abbott Diagnostics, 06C3622 and 06C3237) according to the manufacturer’s instructions [24].
Immunohistochemical staining for HBcAg
Livers were taken from mice sacrificed at the indicated time points, fixed in 10% formalin (Sigma, F1635), and embedded in paraffin (Sigma, 1,071,501,000). HBcAg expression in mouse liver tissue was visualized by immunohistochemical staining of thin liver tissue sections using rabbit anti-HBc antibody (Dako, B0586) and the Envision-System (Dako, K500711–2). HBcAg-positive hepatocytes were counted as described previously [45,53].
Western blot analysis
Western blot analysis was carried out as described previously [24]. Antibodies against the following proteins were used: HBcAg (Abcam, ab8637), HBsAg (Abcam, ab9193), SQSTM1 (Abcam, ab91526), LC3B (Cell Signaling Technology, 2775), Flag (Cell Signaling Technology, 2368), MTOR (Cell Signaling Technology, 2972), phospho-MTOR (Cell Signaling Technology, 2971), ULK1 (Cell Signaling Technology, 8054), phospho-ULK1 (Ser757; Cell Signaling Technology, 6888), RPS6KB1 (Cell Signaling Technology, 9202), phospho-RPS6KB1 (Cell Signaling Technology, 9234), RRAGA (Cell Signaling Technology, 4357), CTSD (Santa Cruz Bioechnology, sc-13,148), GNPNAT1 (Sigma, SAB1105945), LAMP1 (Sigma, 9091), UAP1 (Sigma, HPA014659), and ACTB (Sigma, A5441). Membranes were incubated (as appropriate) with Peroxidase-AffiniPure rabbit anti-mouse IgG antibody (Jackson ImmunoResearch, 315–035–048) or Peroxidase-AffiniPure goat anti-rabbit IgG antibody (Jackson ImmunoResearch, 111–035–045). Immunoreactive bands were visualized using an enhanced chemiluminescence system (GE Healthcare, RPN2106).
Quantitative real-time (q)PCR and quantitative reverse-transcription (RT-q)PCR
HBV progeny DNA was extracted from culture supernatants using the DNA Blood Mini Kit (Qiagen, 51,106) and was quantified by qPCR (Invitrogen, 11,733–046). The primer pair 5ʹ-GTTGCCCGTTTGTCCTCTAATTC-3ʹ (forward) and 5ʹ-GGAGGGATACATAGAGGTTCCTT-3ʹ (reverse) was used.
Total RNA was extracted with TRIzol, followed by digestion with DNase (Roche, 10104159001). For each sample, RT-PCR was performed in duplicate, using RT-qPCR assays (Qiagen, 204,154). ACTB (QT01680476, Qiagen) was amplified as an internal control. The primers used were: NP (IAV) forward 5′-ATCAG ACCGAACGAGAATCCAGC-3′, reverse 5′-GGAGGCCCTCTGTTGATTAGTGT-3′; cRNA (IAV) -NP-Rev 5′-AGTAGAAACAAGGGTATTTTTCTTTAATTGTCGT-3′; VP1 (EV71) forward 5′-AATTGAGTTCCATAGGTG-3′, reverse 5′-CTGTGCGAA TTAAGGACAG-3′; VSV forward 5′-ATGTCTGTTACAGTCAAGAGAATC-3′, reverse 5′-AGAGGAATCTCCTTTGATTTTCTGA-3′.
Confocal microscopy
Immunofluorescence staining was conducted as described previously [24]. Transfected cells were fixed in 4% paraformaldehyde and permeabilized with 0.1% Triton X-100 (Sigma, T8787). The cells were incubated with primary antibodies and then stained with Alexa Fluor 488-conjugated goat anti-rabbit IgG (H + L) (Jackson ImmunoResearch, 111–545–003), Alexa Fluor 594-conjugated goat anti-horse IgG (H + L) (Jackson ImmunoResearch, 108–585–003) or conjugated goat anti-mouse IgG (H + L) (Cell Signaling Technology, 8890). Nuclei were stained with 6-diamidino-2-phenylindole, and the distribution of LC3 puncta was visualized with an LSM 710 confocal microscope (Zeiss, Jena, Germany) with a Plan-Apochromat 63×/1.40 oil Iris M27 objective. LC3 puncta in cells were quantified as described previously [24]. Colocalization of LC3 with HBsAg or organelle marker proteins was analyzed using ImageJ software.
Dye quenched-bovine serum albumin (DQ-BSA) degradation assay
The protocol for the DQ-BSA degradation assay has been described previously [24,25]. Briefly, treated cells were incubated with 10 μg/ml DQ Red BSA (Invitrogen, D-12,051) for 30 min at 37°C in a humidified atmosphere. The fluorescent signal generated by lysosomal proteolysis of DQ Red BSA was quantified with an LSM 710 confocal microscope (Zeiss, Germany) as described above.
Acridine orange staining
The protocol for acridine orange staining has been described previously [24]. Briefly, treated cells were stained with 5 μM acridine orange (Sigma, A9231) for 15 min at 37°C in a humidified atmosphere. Finally, the signal read at 488 nm (green) or 561 nm (red) was detected by confocal microscopy.
Cytotoxicity assay
The cell counting kit-8 (Sigma, 96,992) was used for cytotoxicity assay according to the manufacturer’s instructions. Briefly, HepG2.2.15 cells were seeded in 96-well plates at 2 × 10⁴ cells/well and cultured in the presence of the indicated concentrations of GlcN for the indicated periods. Next, CCK-8 solution was added into each well for 2 h at 37°C. Finally, the absorbance of the lysates was read at 570 nm using a microplate reader.
Statistical analyses
Data are presented as the mean and standard error of the mean. Statistical analyses were conducted using Graph Pad Prism software (GraphPad Software Inc., La Jolla, CA, USA). Analysis of variance with two-tailed Student’s t-test or nonparametric one-way ANOVA with a Dunn post-test was used to determine significant differences. Differences were considered statistically significant when P < 0.05. All experiments were repeated independently at least 3 times.
Funding Statement
This work was supported by grants from the Deutsche Forschungsgemeinschaft (RTG1949/2 and Transregio TRR60); Deutsche Forschungsgemeinschaft (DFG) [Transregio TRR60]; Deutsche Forschungsgemeinschaft (DFG) [RTG1949/2].
Acknowledgments
We thank Prof. Huimin Yan, Dr. Ejuan Zhang, and Dr. Hu Yan (Wuhan Institute of Virology, Chinese Academy of Science) for technical assistance. We thank Ms. Xuefang An and Mr. Fan Zhang (The Core Facility and Technical Support, Wuhan Institute of Virology) for support in animal experiments. We thank Dr. Ruth Broering from the University Hospital Essen for providing PHHs.
Disclosure statement
No potential conflict of interest was reported by the authors.
Supplementary material:
Supplementary data for this article can be accessed here
References
- [1].Skarbek K, Milewska MJ.. Biosynthetic and synthetic access to amino sugars. Carbohydr Res. 2016;434:44–71. [DOI] [PubMed] [Google Scholar]
- [2].Reginster JY, Deroisy R, Rovati LC, et al. Long-term effects of glucosamine sulphate on osteoarthritis progression: a randomised, placebo-controlled clinical trial. Lancet. 2001;357:251–256. [DOI] [PubMed] [Google Scholar]
- [3].Galvin R, Cousins G, Boland F, et al. Prescribing patterns of glucosamine in an older population: a national cohort study. BMC Complement Altern Med. 2013;13:316. [DOI] [PMC free article] [PubMed] [Google Scholar]
- [4].Zahedipour F, Dalirfardouei R, Karimi G, et al. Molecular mechanisms of anticancer effects of Glucosamine. Biomed Pharmacother. 2017;95:1051–1058. [DOI] [PubMed] [Google Scholar]
- [5].Liu X, Machado GC, Eyles JP, et al. Dietary supplements for treating osteoarthritis: a systematic review and meta-analysis. Br J Sports Med. 2018;52:167–175. [DOI] [PubMed] [Google Scholar]
- [6].Ebrahim V, Albeldawi M, Chiang DJ.. Acute liver injury associated with glucosamine dietary supplement. BMJ Case Rep. 2012;2012:bcr2012007665. [DOI] [PMC free article] [PubMed] [Google Scholar]
- [7].Cerda C, Bruguera M, Pares A. Hepatotoxicity associated with glucosamine and chondroitin sulfate in patients with chronic liver disease. World J Gastroenterol. 2013;19:5381–5384. [DOI] [PMC free article] [PubMed] [Google Scholar]
- [8].Denzel MS, Storm NJ, Gutschmidt A, et al. Hexosamine pathway metabolites enhance protein quality control and prolong life. Cell. 2014;156:1167–1178. [DOI] [PubMed] [Google Scholar]
- [9].Cheong H, Lindsten T, Wu J, et al. Ammonia-induced autophagy is independent of ULK1/ULK2 kinases. Proc Natl Acad Sci U S A. 2011;108:11121–11126. [DOI] [PMC free article] [PubMed] [Google Scholar]
- [10].Carames B, Kiosses WB, Akasaki Y, et al. Glucosamine activates autophagy in vitro and in vivo. Arthritis Rheum. 2013;65:1843–1852. [DOI] [PMC free article] [PubMed] [Google Scholar]
- [11].Jiang L, Jin Y, Wang H, et al. Glucosamine protects nucleus pulposus cells and induces autophagy via the mTOR-dependent pathway. J Orthop Res. 2014;32:1532–1542. [DOI] [PubMed] [Google Scholar]
- [12].Mizushima N, Komatsu M. Autophagy: renovation of cells and tissues. Cell. 2011;147:728–741. [DOI] [PubMed] [Google Scholar]
- [13].Orvedahl A, MacPherson S, Sumpter R Jr., et al. Autophagy protects against Sindbis virus infection of the central nervous system. Cell Host Microbe. 2010;7:115–127. [DOI] [PMC free article] [PubMed] [Google Scholar]
- [14].Ding B, Zhang G, Yang X, et al. Phosphoprotein of human parainfluenza virus type 3 blocks autophagosome-lysosome fusion to increase virus production. Cell Host Microbe. 2014;15:564–577. [DOI] [PubMed] [Google Scholar]
- [15].Olagnier D, Lababidi RR, Hadj SB, et al. Activation of Nrf2 signaling augments vesicular stomatitis virus oncolysis via autophagy-driven suppression of antiviral immunity. Mol Ther. 2017;25:1900–1916. [DOI] [PMC free article] [PubMed] [Google Scholar]
- [16].Chen D, Feng C, Tian X, et al. Promyelocytic leukemia restricts enterovirus 71 replication by inhibiting autophagy. Front Immunol. 2018;9:1268. [DOI] [PMC free article] [PubMed] [Google Scholar]
- [17].Yeganeh B, Ghavami S, Rahim MN, et al. Autophagy activation is required for influenza A virus-induced apoptosis and replication. Biochim Biophys Acta. 2018;1865:364–378. [DOI] [PubMed] [Google Scholar]
- [18].Sir D, Tian YJ, Chen WL, et al. The early autophagic pathway is activated by hepatitis B virus and required for viral DNA replication. Proc Natl Acad Sci U S A. 2010;107:4383–4388. [DOI] [PMC free article] [PubMed] [Google Scholar]
- [19].Li J, Liu Y, Wang Z, et al. Subversion of cellular autophagy machinery by hepatitis B virus for viral envelopment. J Virol. 2011;85:6319–6333. [DOI] [PMC free article] [PubMed] [Google Scholar]
- [20].Tong S, Revill P. Overview of hepatitis B viral replication and genetic variability. J Hepatol. 2016;64:S4–16. [DOI] [PMC free article] [PubMed] [Google Scholar]
- [21].Tang LSY, Covert E, Wilson E, et al. Chronic hepatitis B infection: a review. JAMA. 2018;319:1802–1813. [DOI] [PubMed] [Google Scholar]
- [22].Lan SH, Wu SY, Zuchini R, et al. Autophagy suppresses tumorigenesis of hepatitis B virus-associated hepatocellular carcinoma through degradation of microRNA-224. Hepatology. 2014;59:505–517. [DOI] [PMC free article] [PubMed] [Google Scholar]
- [23].Lin Y, Deng W, Pang J, et al. The microRNA-99 family modulates hepatitis B virus replication by promoting IGF-1R/PI3K/Akt/mTOR/ULK1 signaling-induced autophagy. Cell Microbiol. 2017;19:e12709. [DOI] [PubMed] [Google Scholar]
- [24].Lin Y, Wu C, Wang X, et al. Hepatitis B virus is degraded by autophagosome-lysosome fusion mediated by Rab7 and related components. Protein Cell. 2019;10:60–66. [DOI] [PMC free article] [PubMed] [Google Scholar]
- [25].Lin Y, Wu C, Wang X, et al. Synaptosomal-associated protein 29 is required for the autophagic degradation of hepatitis B virus. Faseb J. 2019;33:6023–6034. [DOI] [PubMed] [Google Scholar]
- [26].Guo B, Liang Q, Li L, et al. O-GlcNAc-modification of SNAP-29 regulates autophagosome maturation. Nat Cell Biol. 2014;16:1215–1226. [DOI] [PubMed] [Google Scholar]
- [27].Park SK, Zhou X, Pendleton KE, et al. A conserved splicing silencer dynamically regulates O-GlcNAc transferase intron retention and O-GlcNAc homeostasis. Cell Rep. 2017;20:1088–1099. [DOI] [PMC free article] [PubMed] [Google Scholar]
- [28].Pellegrini P, Strambi A, Zipoli C, et al. Acidic extracellular pH neutralizes the autophagy-inhibiting activity of chloroquine: implications for cancer therapies. Autophagy. 2014;10:562–571. [DOI] [PMC free article] [PubMed] [Google Scholar]
- [29].Liu B, Fang M, Hu Y, et al. Hepatitis B virus X protein inhibits autophagic degradation by impairing lysosomal maturation. Autophagy. 2014;10:416–430. [DOI] [PMC free article] [PubMed] [Google Scholar]
- [30].Li M, Khambu B, Zhang H, et al. Suppression of lysosome function induces autophagy via a feedback down-regulation of MTOR complex 1 (MTORC1) activity. J Biol Chem. 2013;288:35769–35780. [DOI] [PMC free article] [PubMed] [Google Scholar]
- [31].Newton PT, Vuppalapati KK, Bouderlique T, et al. Pharmacological inhibition of lysosomes activates the MTORC1 signaling pathway in chondrocytes in an autophagy-independent manner. Autophagy. 2015;11:1594–1607. [DOI] [PMC free article] [PubMed] [Google Scholar]
- [32].Klionsky DJ, Abdelmohsen K, Abe A, et al. Guidelines for the use and interpretation of assays for monitoring autophagy (3rd edition). Autophagy. 2016;12:1–222. [DOI] [PMC free article] [PubMed] [Google Scholar]
- [33].Shintani T, Yamazaki F, Katoh T, et al. Glucosamine induces autophagy via an mTOR-independent pathway. Biochem Biophys Res Commun. 2010;391:1775–1779. [DOI] [PubMed] [Google Scholar]
- [34].Kim YH, Nakayama T, Nayak J. Glycolysis and the hexosamine biosynthetic pathway as novel targets for upper and lower airway inflammation. Allergy Asthma Immunol Res. 2018;10:6–11. [DOI] [PMC free article] [PubMed] [Google Scholar]
- [35].Seglen PO, Reith A. Ammonia inhibition of protein degradation in isolated rat hepatocytes quantitative ultrastructural alterations in the lysosomal system. Exp Cell Res. 1976;100:276–280. [DOI] [PubMed] [Google Scholar]
- [36].Eng CH, Yu K, Lucas J, et al. Ammonia derived from glutaminolysis is a diffusible regulator of autophagy. Sci Signal. 2010;3:ra31. [DOI] [PubMed] [Google Scholar]
- [37].Zoncu R, Bar-Peled L, Efeyan A, et al. mTORC1 senses lysosomal amino acids through an inside-out mechanism that requires the vacuolar H(+)-ATPase. Science. 2011;334:678–683. [DOI] [PMC free article] [PubMed] [Google Scholar]
- [38].Zhang ZW, Li ZL, Yuan S. The role of secretory autophagy in Zika virus transfer through the placental barrier. Front Cell Infect Microbiol. 2016;6:206. [DOI] [PMC free article] [PubMed] [Google Scholar]
- [39].Jones SA, Hu J. Hepatitis B virus reverse transcriptase: diverse functions as classical and emerging targets for antiviral intervention. Emerg Microbes Infect. 2013;2:e56. [DOI] [PMC free article] [PubMed] [Google Scholar]
- [40].Yao Y, Yang B, Cao H, et al. RBM24 stabilizes hepatitis B virus pregenomic RNA but inhibits core protein translation by targeting the terminal redundancy sequence. Emerg Microbes Infect. 2018;7:86. [DOI] [PMC free article] [PubMed] [Google Scholar]
- [41].Yao Y, Yang B, Chen Y, et al. RNA-binding motif protein 24 (RBM24) is involved in pgRNA packaging by mediating interaction between HBV polymerase and the epsilon element. J Virol. 2019;93:e02161-18. [DOI] [PMC free article] [PubMed] [Google Scholar]
- [42].Xie N, Yuan KF, Zhou L, et al. PRKAA/AMPK restricts HBV replication through promotion of autophagic degradation. Autophagy. 2016;12:1507–1520. [DOI] [PMC free article] [PubMed] [Google Scholar]
- [43].Inoue J, Krueger EW, Chen J, et al. HBV secretion is regulated through the activation of endocytic and autophagic compartments mediated by Rab7 stimulation. J Cell Sci. 2015;128:1696–1706. [DOI] [PMC free article] [PubMed] [Google Scholar]
- [44].Jiang B, Himmelsbach K, Ren H, et al. Subviral hepatitis B virus filaments, like infectious viral particles, are released via multivesicular bodies. J Virol. 2015;90:3330–3341. [DOI] [PMC free article] [PubMed] [Google Scholar]
- [45].Lin Y, Huang X, Wu J, et al. Pre-activation of toll-like receptor 2 enhances CD8(+) T-cell responses and accelerates hepatitis B virus clearance in the mouse models. Front Immunol. 2018;9:1495. [DOI] [PMC free article] [PubMed] [Google Scholar]
- [46].Schirmbeck R, Bohm W, Ando K, et al. Nucleic acid vaccination primes hepatitis B virus surface antigen-specific cytotoxic T lymphocytes in nonresponder mice. J Virol. 1995;69:5929–5934. [DOI] [PMC free article] [PubMed] [Google Scholar]
- [47].Carman WF, Van Deursen FJ, Mimms LT, et al. The prevalence of surface antigen variants of hepatitis B virus in Papua New Guinea, South Africa, and Sardinia. Hepatology. 1997;26:1658–1666. [DOI] [PubMed] [Google Scholar]
- [48].Wu C, Deng W, Deng L, et al. Amino acid substitutions at positions 122 and 145 of hepatitis B virus surface antigen (HBsAg) determine the antigenicity and immunogenicity of HBsAg and influence in vivo HBsAg clearance. J Virol. 2012;86:4658–4669. [DOI] [PMC free article] [PubMed] [Google Scholar]
- [49].Zhang X, Zhang E, Ma Z, et al. Modulation of hepatitis B virus replication and hepatocyte differentiation by MicroRNA-1. Hepatology. 2011;53:1476–1485. [DOI] [PubMed] [Google Scholar]
- [50].Wan Y, Cao W, Han T, et al. Inducible Rubicon facilitates viral replication by antagonizing interferon production. Cell Mol Immunol. 2017;14:607–620. [DOI] [PMC free article] [PubMed] [Google Scholar]
- [51].Liu S, Hao Q, Peng N, et al. Major vault protein: a virus-induced host factor against viral replication through the induction of type-I interferon. Hepatology. 2012;56:57–66. [DOI] [PubMed] [Google Scholar]
- [52].Meng Z, Xu Y, Wu J, et al. Inhibition of hepatitis B virus gene expression and replication by endoribonuclease-prepared siRNA. J Virol Methods. 2008;150:27–33. [DOI] [PMC free article] [PubMed] [Google Scholar]
- [53].Huang S, Zou S, Chen M, et al. Local stimulation of liver sinusoidal endothelial cells with a NOD1 agonist activates T cells and suppresses hepatitis B virus replication in mice. J Immunol. 2018;200:3170–3179. [DOI] [PubMed] [Google Scholar]
Associated Data
This section collects any data citations, data availability statements, or supplementary materials included in this article.