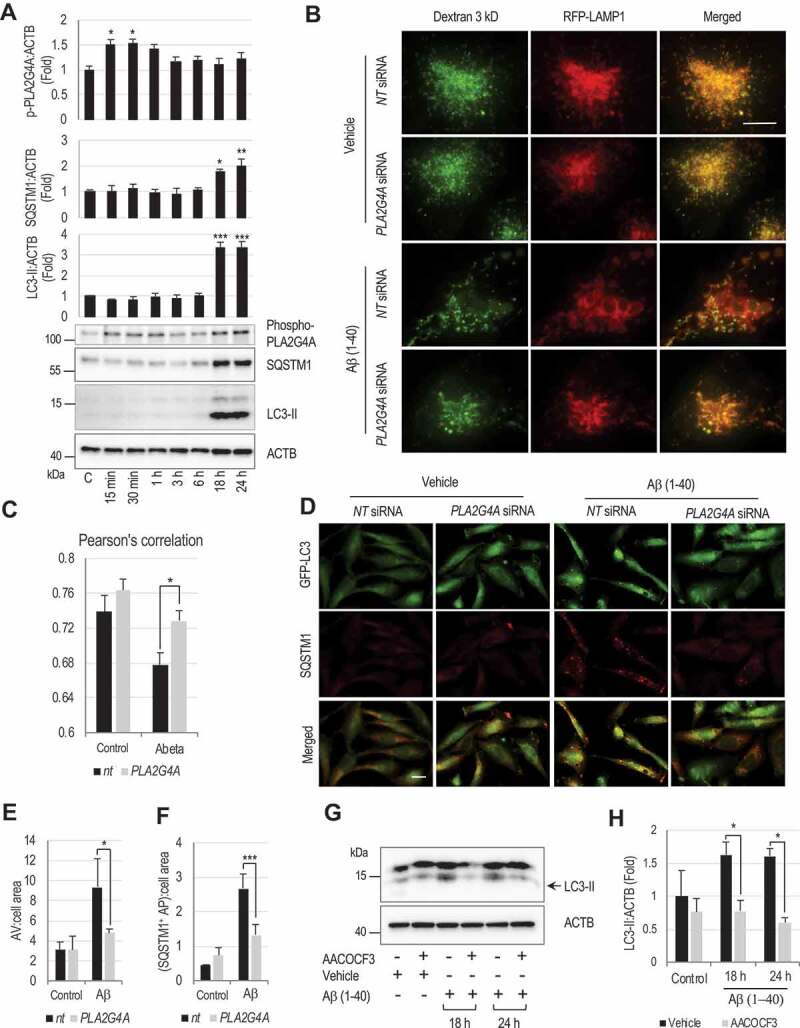
Figure 7.

Amyloid-β activates PLA2G4A leading to LMP and subsequent autophagy impairment.
(A) Western blot demonstrating activating phosphorylation of PLA2G4A, and accumulation of SQSTM1 and LC3-II in amyloid-β(1–40) (5 μM) treated H4 neuroglioma cells and corresponding quantification. Data are mean ± SEM, n = 3, *p < 0.05, **p < 0.01, ***p < 0.001, (One-way ANOVA with Turkey’s multiple comparison test). (B and C) Amyloid-β-induced PLA2G4A activation causes lysosomal abnormalities and LMP. (B) Images (60×) of H4 cells expressing RFP-LAMP1 treated with amyloid-β(1–40) (5 μM) or vehicle control. Cells were transfected with either non-targeting (NT) or PLA2G4A siRNA for 48 h, loaded with Alexa Fluor 488-dextran (3 kDa) and then treated with amyloid β(1–40) for 18 h. Enlarged lysosomes with low dextran levels were detected in amyloid-β treated cells. Lysosomal abnormalities were attenuated in cells transfected with PLA2G4A siRNA. Scale bar: 10 μm. (C) Pearson’s correlation analysis of Alexa fluor 488 dextran co-localization to RFP-LAMP1 lysosomes. (*p < 0.05), n = 10. (D-F) Knock down of PLA2G4A attenuated inhibition of autophagy flux induced by amyloid-β treatment. (D) Images (20×) of GFP-LC3 expressing H4 cells treated amyloid-β for 24 h and stained with antibody against SQSTM1. Cells were transfected with either NT or PLA2G4A siRNA 48 h prior to treatment. Scale bar: 20 μm. (E-F) Quantification of (E) GFP-LC3 positive autophagic vesicles (AV) and (F) SQSTM1 positive cells. Data are mean ± SEM, n = 3; *p < 0.05, ***p < 0.001, (Two-way ANOVA with Bonferroni posttests). (G and H) PLA2G4A/inhibition prevents amyloid-β-induced autophagosome accumulation in rat cortical neurons. (G) Western blot of LC3 in rat cortical neuron cells treated with amyloid β in presence or absence of AACOCF3 for 18 or 24 h. (H) Corresponding quantification of LC3-II. Data are presented as mean ± SEM, n = 4; *p < 0.05, (Two-way ANOVA with Bonferroni posttests).
