Abstract
The surface reflectance, i.e., satellite derived top of atmosphere (TOA) reflectance corrected for the temporally, spatially and spectrally varying scattering and absorbing effects of atmospheric gases and aerosols, is needed to monitor the land surface reliably. For this reason, the surface reflectance, and not TOA reflectance, is used to generate the greater majority of global land products, for example, from the Moderate Resolution Imaging Spectroradiometer (MODIS) and Visible Infrared Imaging Radiometer Suite (VIIRS) sensors. Even if atmospheric effects are minimized by sensor design, atmospheric effects are still challenging to correct. In particular, the strong impact of aerosols in the Visible and Near Infrared spectral range can be difficult to correct, because they can be highly discrete in space and time (e.g., smoke plumes) and because of the complex scattering and absorbing properties of aerosols that vary spectrally and with aerosol size, shape, chemistry and density.
This paper presents the Landsat 8 Operational Land Imager (OLI) atmospheric correction algorithm that has been developed using the Second Simulation of the Satellite Signal in the Solar Spectrum Vectorial (6SV) model, refined to take advantage of the narrow OLI spectral bands (compared to Thematic Mapper/Enhanced Thematic Mapper (TM/ETM+)), improved radiometric resolution and signal-to-noise. In addition, the algorithm uses the new OLI Coastal aerosol band (0.433–0.450μm), which is particularly helpful for retrieving aerosol properties, as it covers shorter wavelengths than the conventional Landsat, TM and ETM+ blue bands. A cloud and cloud shadow mask has also been developed using the “cirrus” band (1.360–1.390 μm) available on OLI, and the thermal infrared bands from the Thermal Infrared Sensor (TIRS) instrument. The performance of the surface reflectance product from OLI is analyzed over the Aerosol Robotic Network (AERONET) sites using accurate atmospheric correction (based on in situ measurements of the atmospheric properties), by comparison with the MODIS Bidirectional Reflectance Distribution Function (BRDF) adjusted surface reflectance product and by comparison of OLI derived broadband albedo from United States Surface Radiation Budget Network (US SURFRAD) measurements.
1. Introduction
The need for standard products was recognized early in the National Aeronautics and Space Administration (NASA) Earth Observation Satellite (EOS) program and considerable resources have been allocated for the generation of geophysical products. The objective being, to take away the burden of data processing from the user community and facilitate uptake of the data by modelers and operational users. For the MODIS, three suites of geophysical peer-reviewed products were developed in the areas of vegetation parameterization, energy balance and land cover and change (Justice and Townshend 2002). Several of these MODIS products are derived using the Surface Reflectance product.
Atmospheric effects introduce a non-negligible perturbation to the reflectance observed by Landsat TM. This perturbation depends on the wavelength, the geometry of illumination and observation, and the concentration of aerosols and gases at a given time and location. In the visible part if the Spectrum, aerosols dominates and at longer wavelengths water vapor can greatly absorb radiation in specific regions. This perturbation can easily reach up to 15% relative and 0.05 unit of reflectance for the TM (Vermote et al., 1997a). Even for comparative studies that do not retrieve biophysical parameters, atmospheric correction should be applied to prevent changes due to atmospheric effects being interpreted as changes in the surface conditions.
A number of atmospheric correction methodologies have been developed but those using radiative transfer algorithms and atmospheric characterization data provide the greatest potential for automated large area application. The approach proposed here is a physically based atmospheric correction technique that aims at producing the reflectance that would be measured at ground level if there were no atmosphere. However, it is limited to uniform and flat targets. For heterogeneous landscapes, adjacency effects can be corrected in a subsequent step that is computationally expensive and will only improve the quality of the product under specific conditions (Vermote, 2003) and as a result, this correction is not performed operationally. For rugged terrain, topographic effects can introduce important artifacts if not accounted for (Tan et al., 2013) but can also be corrected after standard atmospheric correction and will not be discussed in this paper. Such an approach has been applied to MODIS since 2000 to generate daily and 8-day surface reflectance products. It is based on a rigorous radiative transfer model, the vectorial version of the 6S code (Vermote et al. 1997b, Kotchenova et al. 2006), a description of the atmosphere properties based on ancillary data for the less critical part of the atmospheric constituents (i.e. Rayleigh scattering, gaseous absorption) and on retrieval of the aerosol concentration using the bands centered at the shortest wavelengths (blue) where the surface reflectance is generally small and the aerosol signal is strong.
A similar approach has been successfully applied to Landsat data in the operational environment of the Landsat Ecosystem Disturbance Adaptive Processing System (LEDAPS) Project where a version of the algorithm has been implemented, tested, validated and widely distributed (Masek et al., 2006). Application to Landsat has demonstrated a performance comparable to the MODIS algorithm for the aerosol retrieval over land, when compared to AERONET, with a one sigma uncertainty lower than 0.05+0.2AOT (where AOT stands for Aerosol Optical Thickness) (Masek et al. 2006, Remer et al. 2005) as well as for the surface reflectance product (Claverie et al., 2015). For Landsat 8/OLI, the recent developments and improvements of MODIS surface reflectance Collection 6 were implemented, taking advantage of the improved radiometric performance and spectrally narrow bands located at wavelengths that are less subject to atmospheric absorption, as well as using better ancillary datasets (Section 2). The improvements translated into enhanced performance in terms of accuracy, precision and uncertainty metrics of the Landsat8/OLI surface reflectance, as compared to its precursors (Landsat 7/ETM+ and 5/TM) and as shown by the comparison with the reference dataset obtained over AERONET sites (Section 3.1). The accuracy of the surface reflectance was further assessed by inter-comparison with the MODIS Surface Reflectance product (Section 3.2) and by comparing a Landsat 8 derived broadband albedo to US SURFRAD network measurements (Section 3.3.).
2. Methodology
2.1. Surface reflectance inversion / atmospheric correction
The method adopted for atmospheric correction relies on the inversion of the relatively simple equation in the Lambertian case, with no adjacency effects that account for a simplified coupling of the absorption by atmospheric gases and scattering by molecules and aerosols as it is implemented in the 6SV radiative transfer code (Vermote et al. 1997b, Kotchenova et al. 2006):
| [1a] |
where
ρTOA is the reflectance at the top of the atmosphere, ρatm is the atmosphere intrinsic reflectance, Tratm is the total atmosphere transmission (downward and upward), Satm is the atmosphere spherical albedo, and ρs is the surface reflectance to be retrieved by the atmospheric correction procedure:
the geometric conditions are described by the solar zenith angle θs, the view zenith angle θv, and the relative azimuth ϕ (or the difference between the solar and view azimuth angles);
P is the pressure that influences the number of molecules and the concentration of absorbing gases in the atmosphere, Tg designates the gaseous transmission by water vapor (TgH2O), ozone (TgO3), or other gases (TgOG), UH2O is the integrated water vapor content, UO3 is the integrated ozone content, and m is the so-called “air-mass” computed as 1/cos(θs)+1/cos(θv);
τA, ω0 and PA describe the aerosol properties and are spectrally dependent: τa is the aerosol optical thickness, ω0 is the aerosol single scattering albedo, and PA is the aerosol phase function.
Equation [1a] is a modified form of the original equation of transfer for a lambertian uniform target of reflectance ρs:
| [1b] |
Equation [1b] is valid under all conditions but the computation of the atmospheric terms in the equation necessitate a radiative transfer code that has limitations. The main limitation of 6SV is the plane parallel assumption for the atmosphere, which limits the quoted accuracy (0.4%) to Sun and view zenith angles lower than 75 degrees. In addition to this limitation, Equation [1a] supposes that scattering and absorption could be decoupled, which is not true where both strong absorption and scattering regimes occur, for example near strong water vapor absorption lines in the near-infrared (e.g. in MODIS band 18 and 19).
So for Landsat 8 bands 1 to 8, the effect of water vapor on the atmosphere intrinsic reflectance can be approximated as:
| [2] |
where ρR represents the reflectance of the atmosphere due to molecular (Rayleigh) scattering and ρR+Aer represents the reflectance of the mixture of molecules and aerosol particles. Accounting correctly for the mixing and the so-called coupling effect [2] is important for achieving a high accuracy of atmospheric effect modeling. This approximation conserves the correct computation of the coupling and assumes that water vapor is mixed with aerosol particles and that molecular scattering is not affected by water vapor absorption. It should be noted that Equation [2] represents an average case where we consider that half of the water vapor present in the atmosphere absorbs the aerosol path radiance. Two additional extreme cases are computed by 6SV, the water vapor above the aerosol layer (maximum absorption) and the water vapor under the aerosol layer (minimum absorption) (Vermote et al. 1997b). These additional cases could be used in the error budget computation.
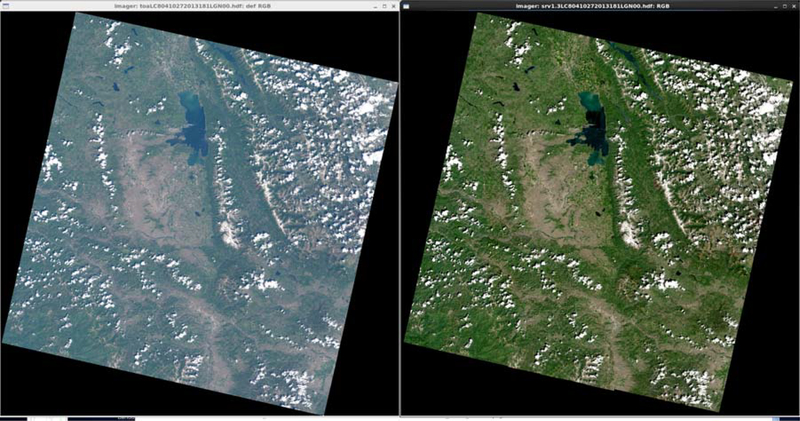
Figure 1 shows a visual illustration of the inversion of Equation [1a], the left side of the figure corresponds to the top of the atmosphere reflectance (the term ρTOA on the left side of equation [1a]) in OLI band 4,3 and 2 displayed as a RGB color composite, whereas the right side corresponds to the same bands but using the surface reflectance (the term ρs inside Equation [1a]).
Figure 1:
Landsat 8/OLI RGB composite (Red Band 4, Green Band 3, Blue Band 2), over Missoula, MT, acquired on June 30, 2013. The left side corresponds to the reflectance at the top of the atmosphere, the right side to the surface reflectance. The “color stretch” used for both sides is the same. The logarithm of the reflectance in each band is scaled linearly between 5 (digital count 0) and 8.5 (Digital count 255).
As the scheme of the atmospheric correction is relatively simple in terms of input and inversion (see Equation [1a]), the challenge lies in estimating the atmospheric parameters of Equation [1a] and [2].
The atmospheric pressure P is obtained from a combination of data available from a coarse-resolution (one deg., six hours time step) weather prediction model available from NCEP GDAS (2015), sea level pressure Psl and the altitude z [km] given by a Digital Elevation Model at 0.05 degree resolution (ETOPO5, 1988) and computed as:
| [3] |
The pressure should be representative of the average atmospheric pressure along the path from the Sun to the target and back to the satellite for primary scattering, and along a even more complicated path for multiple scattering. Given the fact the Sun is usually not at nadir but more often at 45 degree on average and that the height of the atmosphere is about 10km, the resolution used in the pressure field should be about 10km on average. That is why using a spatial resolution much higher than a few kilometers is not needed nor desirable. In practice the pressure at sea level is taken directly from the MODIS Terra ancillary information already re-gridded at 0.05 degree at the time of overpass of Terra (approximately 10:30AM).
The ozone amount UO3 is obtained via NCEP GDAS (2015) (at 1deg., 6 hours time step) via the ancillary information included in the MODIS surface reflectance Climate Modeling Grid (MOD09CMA). The surface reflectance Climate Modeling Grid (CMG) adopted a simple Geographic latitude/longitude projection at 0.05 degree (~ 5.5 km).
The water vapor is also extracted from the ancillary information included in the MODIS surface reflectance Climate Modeling Grid (MOD09CMA) for Terra, which is itself computed from the MODIS near-infrared band 18 (931–941 nm) and 19 (915–965 nm) at 1 km spatial resolution (Gao and Kaufman, 2003). Using the MODIS derived water vapor is preferred to using the GDAS data for two reasons (i) the high spatial and temporal variability of water vapor (a couple of hours and a few tens of kilometers) compared to ozone for example (days and a hundred of kilometers) (ii) the established good performance of the MODIS water vapor retrieval (5 to 10% errors) (Gao and Kaufman, 2003). This however assumes that MODIS water vapor retrieval is possible, as it requires cloud free conditions The assumption is that cloud distribution is the same for Landsat and MODIS Terra which might not be the case and will necessitate further improvement of the ancillary dataset (e.g. using GDAS in lieu of MODIS over cloudy pixels).
The aerosol characteristics (τA, ω0 and PA ) pose a greater challenge. The problem is first simplified by assuming a standard dynamic aerosol model, “Urban Clean” which was the model proposed by Dubovik in his analysis of the AERONET results (Dubovik et al., 2002). The choice of this aerosol model worldwide is due to the limited number of bands available to attempt a model inversion and the relatively preliminary nature of the OLI surface reflectance product. Then the aerosol optical thickness is inverted using the two blue bands available on Landsat8/OLI (band 1 and 2) for each non-water pixel that has not been flagged as cirrus. The inversion scheme is adapted from the MODIS Collection 6 surface reflectance algorithm, which is based on the Collection 5 algorithm and stems from the work of Kaufman et al., (1997). The basic principle of this method was to use an a-priori relationship between the reflectance observed in the middle infra-red (mid-IR) (2.1μm) and the blue (0.47μm) and Red (0.66μm) bands of MODIS to constrain the inversion. That relationship is connected by the fact that the vegetation liquid water content that influences the signal in the mid-IR is related to the photosynthetic activity that absorbs the radiation in the blue and red. However, both the MODIS aerosol group (see Figure 1 of Levy et al., 2007), and the MODIS surface reflectance group (Vermote and Saleous, 2006, Vermote and Kotchenova, 2008) found that there was a stronger relationship between red and blue MODIS bands than the blue and mid-IR. Consequently, the approach implemented in MODIS Collection 6 and the current version of LEDAPS surface reflectance use the relationship between the blue and red band to invert AOT. This approach is naturally the one used for this first version of the Landsat8/OLI surface reflectance product and the details of the implementation are given in the next section.
2.2. Landsat 8/OLI aerosol optical thickness inversion
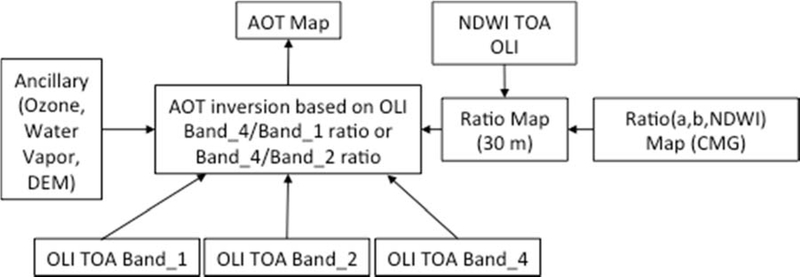
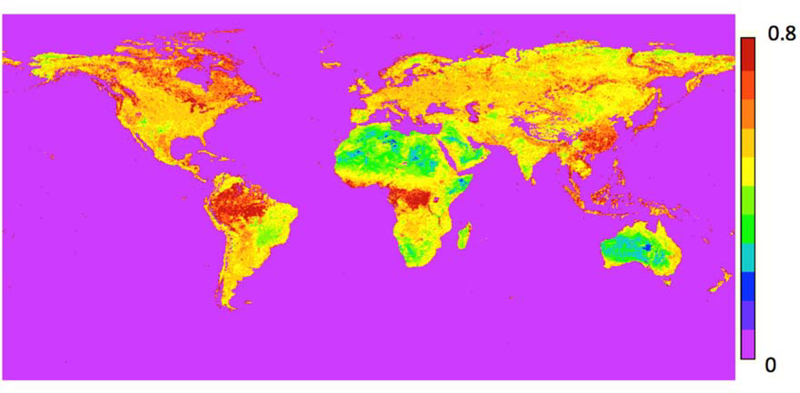
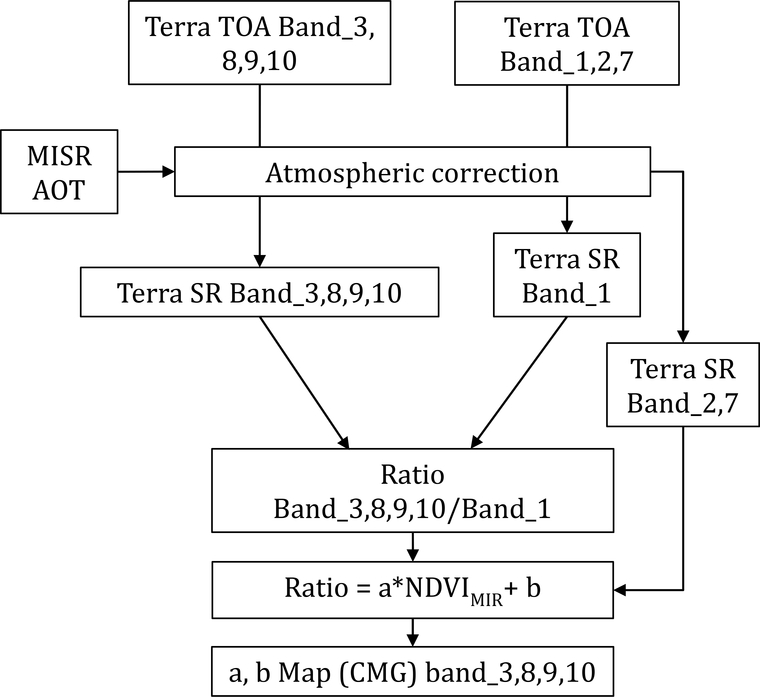
The method for inverting the AOT from OLI is relatively simple if the ratio between the red and blue bands of OLI can be known for every 30m pixel (Figure 3c). First, this ratio is computed at coarse resolution (0.05 degree) from 10 years of MODIS (Terra) and MISR data (see Figure 2). The MISR AOT product is used as input to the atmospheric correction of the MODIS TOA data for each valid observation, providing the MODIS surface reflectances that can be used to derive a ratio at 0.05 degree. The data are carefully filtered for clouds and high AOT values. This data processing enables one to account for the accuracy of that ratio globally and across several years and seasons. The ratio is computed for each valid observation and subsequently fitted as a linear function of NDVIMIR (Figure 3b), a vegetation index that uses the Mid-IR (2.1μm) channel instead of Red:
| [4] |
The advantage of this index is that it is much less sensitive to aerosols because of the use of Mid-IR in lieu of red but still close to the original NDVI as the Mid-IR and red ratio is around 0.5 over most surfaces (See Levy et al. 2007).
Figure 3c:
Flowchart of the OLI AOT retrieval.
Figure 2:
Map of the ratio between MODIS Terra band 3 (0.47μm) and band 1 (0.67μm). This is the average ratio observed over a period of 10 years using coincident MODIS/MISR observations and the optical thickness from MISR to perform atmospheric correction.
Figure 3b:
Flowchart of the MODIS retrieval of the “Ratio” Map parameterized versus NDWI at 0.05 degree.
Second, this parameterization of the ratio as a function of NDVIMIR at the CMG level in addition to capturing the potential seasonal/annual variability of the ratio, enables one to scale this quantity down to the spatial resolution of OLI and use it in the retrieval of AOT at the OLI pixel level (Figure 3c). In addition to retrieving the AOT for each OLI pixel, a measure of the goodness of inversion is provided by computing the inversion “residual” using the two blue bands available on OLI (band 1 and 2) as:
| [5] |
where , and are the surface reflectance in OLI band 1,2,4 derived using the AOT inverted using red (band 4) and blue (band 1) and r1,4 (resp. r2,4) is the ratio between band 1 (resp. band 2) and band 4 of OLI.
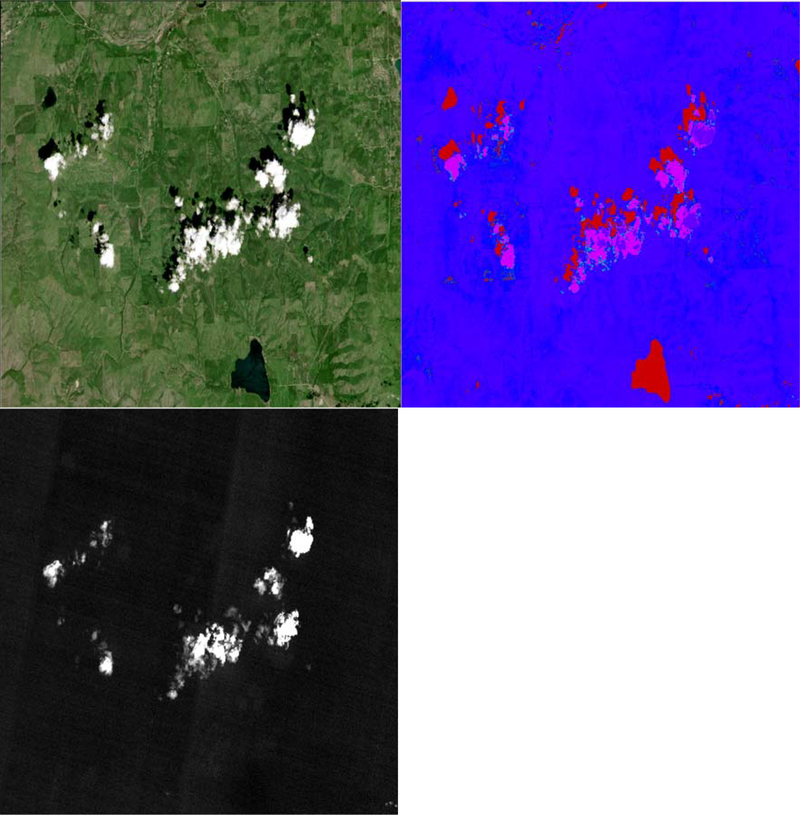
This residual turned out to be very useful to detect clouds, as in the case of thick clouds, either the inversion did not converge or the residual was very high. A threshold as a function of the AOT retrieved was set to screen all the inversions for which the residual exceeded 0.005+0.05AOT, in that case further testing was done to investigate cloud contamination. Figure 3d illustrates a detail of a scene from Missoula, Montana which shows how the residual can indeed catch some of the most obvious cloud in the image (also shown is the cirrus band).
Figure 3d:
RGB detail of the Missoula scene (top left), (top right) color scaled residual: the magenta pixels correspond to higher residual (Equation [5]) later flagged as cloud, the red pixels were not flagged as cloud but discarded (in that case water and cloud shadow), the purple pixels are clouds flagged early in the processing by the cirrus band (note the threshold on the cirrus band has been set very conservatively ~ 0.02 reflectance unit). (Bottom left) Cirrus band 9.
After cloud and cloud shadow masking, residual and water masking is performed. Then, a gap filling process is performed using all valid AOT values. This gap filling process is implemented within an initial window of 10×10 pixels, which is grown by a factor 2 until all the pixels in the image have a valid AOT. At each step the pixels within this window with no valid AOT retrieval are filled with the average of the valid AOT and flagged accordingly.
3. Validation
The direct validation of land surface reflectance is problematic since there are no systematic measurements at the adequate spatial and spectral resolution that could be used as it is the case for example for validating aerosol optical thickness (AERONET). Recognizing this problem, we have adopted, as many others, an indirect approach using three different sources of information to validate the Landsat8/OLI surface reflectance product: (i) The AERONET data associated with a accurate radiative transfer code, (ii) the MODIS surface reflectance product adjusted for BRDF effect and spectral differences with OLI, (iii) the SURFRAD measurements of the shortwave albedo over five different sites. The details of each analysis are given hereafter.
3.1. Assessment of the performance of the Landsat 8/OLI surface reflectance product using AERONET data
Key steps in developing a science quality, long-term dataset are establishing the pre and post-launch uncertainty estimates and validating the product. In addition to tracking the calibration of the sensor, which is seminal to the atmospheric correction, the current approach relied first on the validation of the radiative transfer approach (Kotchenova et al. 2006,2008; Kotchenova and Vermote, 2007), validating the 6SV code by inter-comparison with other codes, including the unambiguous Monte Carlo approach (Kotchenova et al., 2006 which shows 6SV to agree within 0.4% of the Monte Carlo results, http://rtcodes.ltdri.org/ ) and the application of the radiative transfer code over sites with detailed descriptions of the atmospheric properties from the AERONET (Holben et al., 1998). This allowed us to retrieve very accurate reflectance standards, such as measurements of water reflectance from MOBY off the coast of Lanai Island, Hawaii (Kotchenova et al. 2006). Once the radiative transfer approach is established, a practical means of validation is to establish a reference dataset based on the best possible atmospheric correction of the data of interest. In practice, the full radiative transfer code, 6SV, is used and not the look up tables and parameterization of the gaseous transmission used in the operational surface reflectance product of any sensor. The best possible source of water vapor and aerosol information is used as input to the code, which is achieved whenever two valid AERONET observations that bracket the satellite data within 15 minutes can be obtained. This reference dataset can then be used to determine the accuracy, precision and uncertainty (APU) of the surface reflectance product originally defined by the National Polar-Orbiting Operational Environmental Satellite System (NPOESS) project to evaluate a variety of Earth Data Records (EDR) and are computed as follows:
| [6] |
| [7] |
| [8] |
Where in this case, μe is the operational surface reflectance of the sensor considered and μt is the surface reflectance ‘truth’.
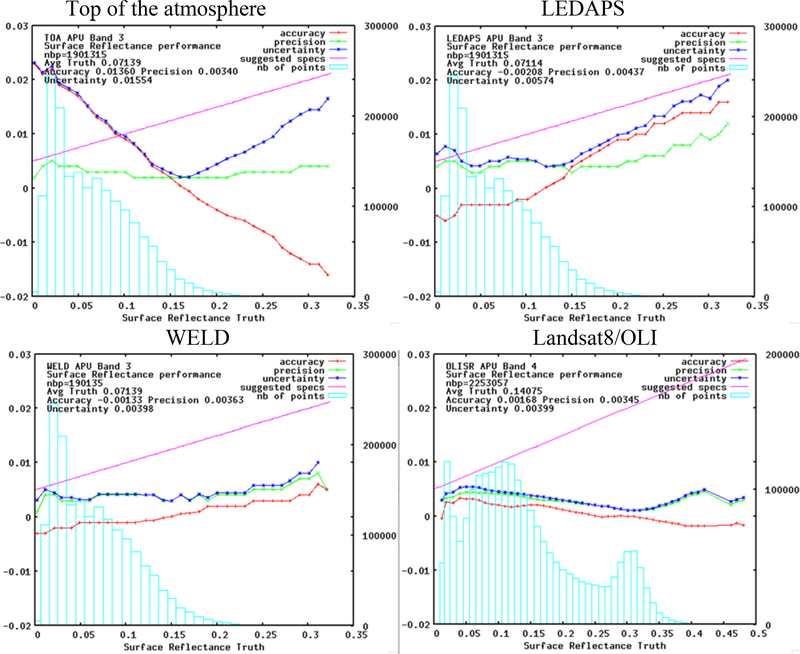
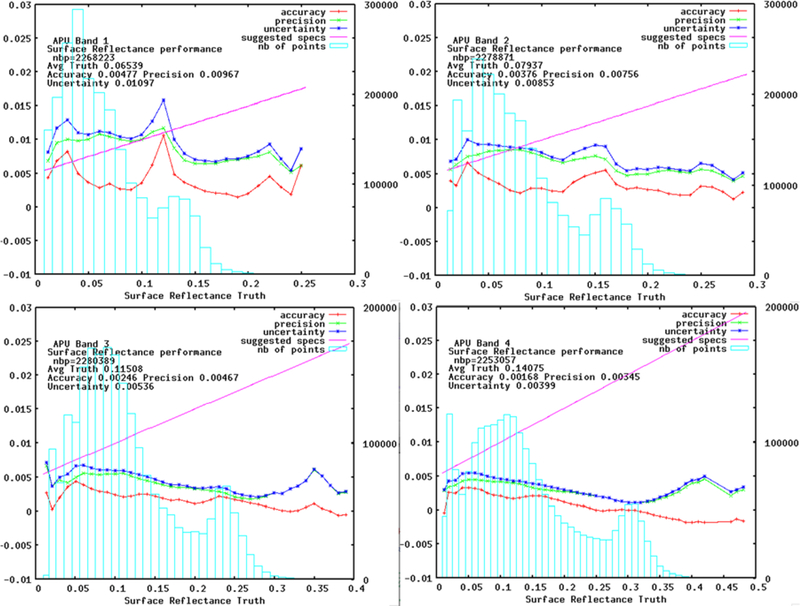
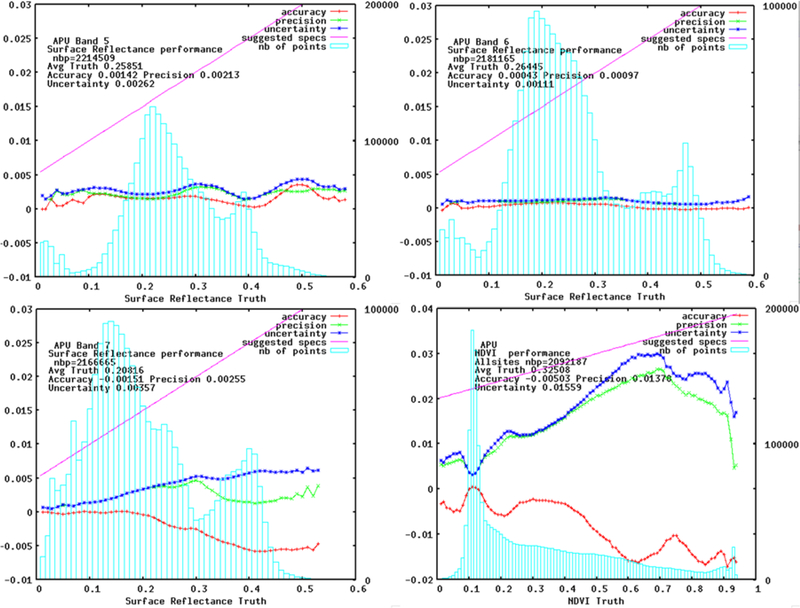
This type of analysis has been undertaken on a global sample basis for the MODIS Surface Reflectance products and Vegetation Indices, as well as for VIIRS (Vermote et al., 2014). It has also been performed for previous Landsat products such as the WELD (Roy et al., 2010) and the LEDAPS (Masek et al., 2006) products over CONUS (Ju et al. 2012). Figure 4 shows the unambiguous conclusions that could be derived from such statistical metrics. The top left of figure 4 is the APU for the top of the atmosphere reflectance observed in the red (0.66μm), whereas the top right, bottom left and bottom right are APU for the surface reflectance for LEDAPS, WELD and Landsat 8. The magenta line on each quadrant is the specified uncertainty based on a conservative error budget derived for MODIS (Vermote and Saleous, 2006). From figure 4, one can clearly see that the top of the atmosphere uncertainty (blue curve) exceeds the specification mainly because of a large bias (accuracy, red curve), whereas LEDAPS and WELD for Landsat 7/ETM+ meet the MODIS specification. The WELD product is slightly better than the LEDAPS but necessitates the MODIS aerosol product as input, but the LANDSAT 8 newly developed surface reflectance that uses the previously described aerosol inversion (section 2.2) shows even better performance. Figures 5a–b confirm the good performance of the Landsat 8/OLI surface reflectance product across almost all bands. Also shown is the good performance of the Normalized Difference Vegetation Index (NDVI) derived from the Surface Reflectance band 4 and 5, which have shown to be sensitive to atmospheric effects when using top of the atmosphere reflectance (Justice et al., 1991).
Figure 4:
Comparison of the Accuracy, Precision and Uncertainty of the different surface reflectance products in the red band, LEDAPS (Landsat 7/ETM+), WELD (Landsat7/ETM+) using MODIS aerosol and Landsat8/OLI (this work). The reflectance truth is obtained by correcting the TOA reflectance with 6SV using AERONET as input for water vapor and aerosol. For reference also shown is the performance of the top of the atmosphere data (same dataset as LEDAPS and WELD). The blue bars show the number of point used in each bin of reflectance. The pink line represents the specified uncertainty based on a theoretical error budget of the collection 5 MODIS surface reflectance. The time period and sites used for Landsat8/OLI are different than the ones used for LEDAPS, WELD and TOA datasets.
Figure 5a:
Same as Figure 4 but for Landsat8/OLI band 1 (top left), 2 (Top right), 3 (Bottom left), 4 (Bottom right).
Those results only indicate preliminary performances of the OLI surface reflectance product as the dataset used are limited to a relatively modest number of AERONET sites and the selection of the data followed strictly the MODIS protocol in term of rejecting high aerosol cases. A first step forward for a meaningful comparison will be to use the same AERONET selection as a reference as was done by Ju et al., (2012). The complexity in the present case is that we are not only looking at two different algorithms but also two different instruments. To complement this preliminary estimate, results across all bands with the addition of the performance estimates for TM/ETM+ from (Claverie et al., 2015 and Ju et al., 2012) are provided in Table 1, showing that the OLI surface reflectance performances are either close or better than the precursor surface reflectance products. This needs to be confirmed over a larger dataset comparable to the one used by Claverie et al., (2015).
Table 1:
OLI surface reflectance APU scores expressed in 10−3 reflectance (compared to TM and ETM+ surface reflectance APU by Claverie et al. (2015) over AERONET Site and Ju et al., 2012 analysis for WELD and LEDAPS algorithm. Band number corresponds to OLI band number designation and equivalent TM/ETM+ bands were reported.
| OLI Band | TM LEDAPS (Claverie et al., 2015) | ETM+ LEDAPS (Claverie et al., 2015) | ETM+ LEDAPS (Ju et al. 2012) | ETM+ WELD (Ju et al. 2012) | OLI This work | ||||||||||
|---|---|---|---|---|---|---|---|---|---|---|---|---|---|---|---|
| A | P | U | A | P | U | A | P | U | A | P | U | A | P | U | |
| 01 | 4.8 | 9.7 | 11. | ||||||||||||
| 02 | 3.7 | 5.7 | 6.8 | 6.7 | 7.7 | 10. | 5.3 | 5.8 | 7.9 | 6.0 | 5.2 | 7.9 | 3.8 | 7.6 | 8.5 |
| 03 | 0.1 | 5.4 | 5.4 | 1.6 | 6.7 | 6.8 | 3.9 | 4.3 | 5.8 | 3.9 | 3.4 | 5.2 | 2.5 | 4.7 | 5.4 |
| 04 | 0.1 | 4.1 | 4.1 | 1.2 | 6.8 | 6.9 | 4.2 | 3.9 | 5.7 | 3.0 | 2.6 | 4.0 | 1.7 | 3.5 | 4.0 |
| 05 | 3.2 | 6.1 | 6.8 | 3.0 | 6.8 | 7.4 | 1.0 | 7.9 | 8.0 | 4.1 | 3.9 | 5.7 | 1.4 | 2.1 | 2.6 |
| 06 | 3.7 | 5.9 | 7.0 | 2.4 | 4.1 | 4.8 | 5.6 | 4.9 | 7.4 | 1.5 | 1.5 | 2.1 | 0.4 | 1.0 | 1.1 |
| 07 | 3.8 | 4.5 | 5.9 | 4.3 | 4.6 | 6.3 | 5.1 | 5.1 | 7.2 | 1.6 | 1.6 | 2.3 | 1.5 | 2.6 | 3.6 |
3.2. Inter-comparison with MODIS
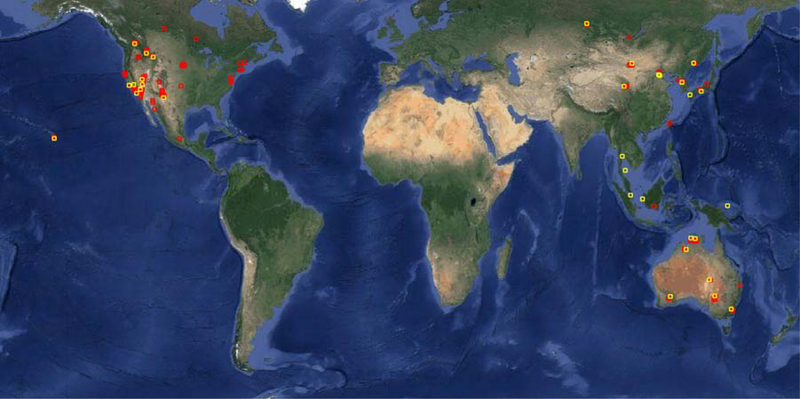
The previous section illustrated the validation that can be achieved using AERONET sites. Although robust, this validation is limited to coincident observations and given the relatively low revisit frequency of Landsat 8 (16 days) leads to 71 cases where the comparison was possible. Figure 6 gives an overview of the spatial distribution of those cases (yellow squares). In order to increase the sample, an alternative approach is to inter-compare the Landsat 8/OLI surface reflectance with an already validated product, here the MODIS Aqua Surface Reflectance. Figure 6 shows (red squares) the OLI scenes selected for inter-comparison. The details of the inter-comparison procedure developed for Landsat 5/TM and Landsat 7/ETM+ LEDAPS products involve the normalization of the surface reflectance for directional effects and some basic filtering on the atmospheric conditions (eliminate high aerosol). This approach accounts for spectral band differences between OLI and MODIS and it also involves a spatial aggregation of both datasets to a 0.05 degree grid, limiting the MODIS and OLI collocation error. Details concerning the inter-comparison methodology can be found in Claverie et al. (2015).
Figure 6:
Map of the AERONET sites (yellow squares) used for the validation and the OLI scenes (red squares) used for the OLI-MODIS inter-comparison.
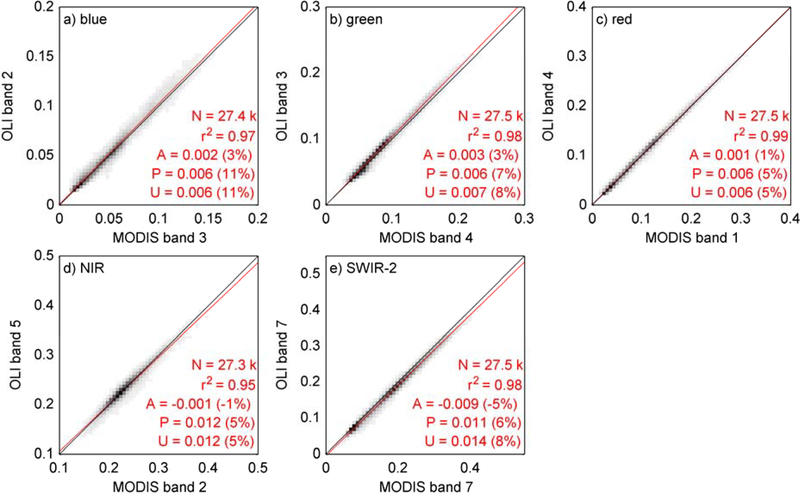
More importantly, it should be noted that the “error” observed in this inter-comparison is a combination of errors in both the surface reflectance product (MODIS and OLI), as well as residuals from the spectral and directional effect normalization. In this case, we have compared the data to those from Aqua (although band 6 is not compared because of several detector problems with Aqua) because it was found that the geometry of observation was closer between Aqua and OLI than for Terra and OLI, therefore the noise from the directional correction was smaller. The results are presented in Figure 7; the correlation between two dataset is high and the accuracy (bias) might be largely due to spectral and BRDF residuals (1 to 5% across all the bands); the precision is mostly around 5% but is largest in the blue (OLI band 2, MODIS band 3) consistent with the decreased performance of both reflectance products at those wavelengths. Overall, the inter-comparison did not point out any problems with the OLI products that can’t be explained by the limitations of such an approach (the BRDF residual noise, for example has been shown to be around 5% (Bréon and Vermote, 2012 and Bréon et al., 2015). Table 2 summarizes the same analysis performed with TM and ETM+, by comparing LEDAPS surface reflectance to Aqua from (Claverie et al., 2015) and confirms the good performance of OLI especially in the visible, where the aerosol effect dominates.
Figure 7:
Cross-comparison between Aqua MODIS BRDF and spectrally adjusted SR CMG product and OLI SR aggregated over the CMG. The five subplots correspond to five OLI spectral bands used for the cross-comparison. Plots are represented through density functions from light gray (minimum) to black (maximum); white means no data. Red lines correspond to the linear fits. r2, A, P and U refer to the statistical metrics given in Section 4. Relatives A, P and U are reported in parentheses. N is the number of points.
Table 2:
OLI surface reflectance APU scores expressed in 10−3 reflectance (compared to TM and ETM+ surface reflectance APU by Claverie et al. (2015) using Aqua MODIS BRDF and spectrally adjusted surface reflectance CMG product as reference, the OLI surface reflectance was aggregated over the CMG. Band number corresponds to OLI band number designation and equivalent TM/ETM+ bands were reported.
| OLI Band | TM LEDAPS (Claverie et al., 2015) | ETM+ LEDAPS (Claverie et al., 2015) | OLI This work | ||||||
|---|---|---|---|---|---|---|---|---|---|
| A | P | U | A | P | U | A | P | U | |
| 2 | 7 | 9 | 11 | 9 | 7 | 12 | 2 | 6 | 6 |
| 3 | 1 | 9 | 9 | 6 | 9 | 11 | 3 | 6 | 7 |
| 4 | 9 | 10 | 14 | 1 | 9 | 9 | 1 | 6 | 6 |
| 5 | 5 | 17 | 17 | 3 | 14 | 15 | 2 | 12 | 12 |
| 7 | 1 | 14 | 14 | 5 | 15 | 16 | 9 | 11 | 14 |
3.3. Landsat 8/OLI – MODIS Shortwave Albedo product performance
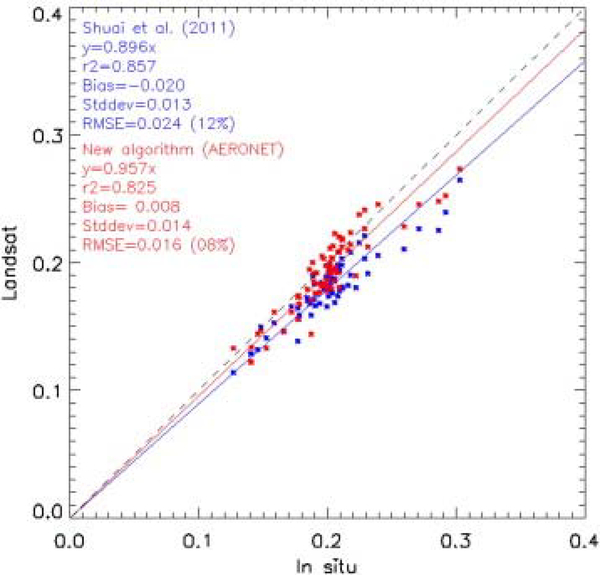
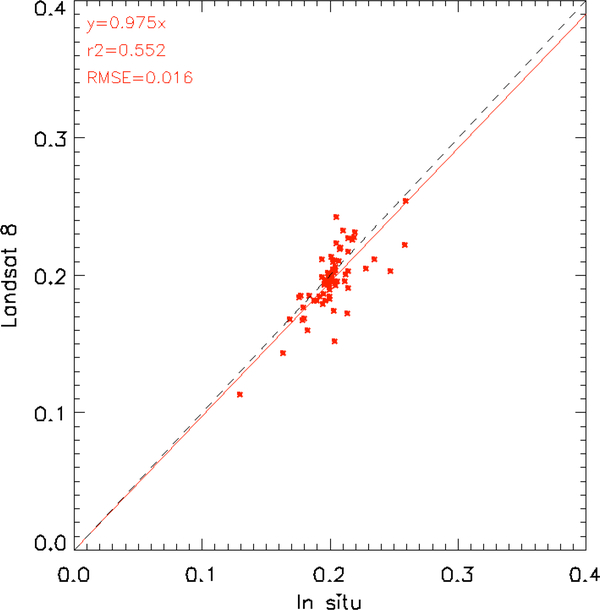
As in the previous section, the goal of this section is to provide additional evidence of the performance of the Landsat 8/OLI surface reflectance product by looking at downstream products that could be in turn be compared to independent “truth”. The Landsat class of sensors by themselves could not derive albedo, which by definition necessitates the integration of several different viewing geometries. However, the Albedo can be estimated using MODIS by the inversion of the Bidirectional Reflectance Distribution Function model (Schaaf et al., 2002). By combining MODIS BRDF information and Landsat data and spatially disaggregating the coarse resolution information, one can derive a reasonable estimate of a Landsat spatial scale Broadband Albedo, as shown by several authors by comparison to flux tower measurements (Shuai et al., 2011, Franch et al., 2014). The Franch et al., (2014) algorithm derives a Landsat surface albedo based on the BRDF parameters estimated from the MODerate Resolution Imaging Spectroradiometer (MODIS) Climate Modeling Grid (CMG) surface reflectance product (M{O,Y}D09) using the VJB method (Vermote, Justice, & Bréon, 2009). The algorithm uses a Landsat unsupervised classification to disaggregate the BRDF parameters to the Landsat spatial resolution. In this section, the method of Franch et al., (2014) is directly applied to both Landsat 8/OLI and Landsat 5 and 7/ETM+ dataset over five SURFRAD sites (i.e. Desert Rock, Table Mountain, Bondville, Goodwin Creek and Penn State University). The results are presented in Figures 8a–b. Figure 8a is taken directly from Franch et al., (2014) where it is shown that using AERONET aerosol data in the atmospheric correction, among other factors can provide a better broadband albedo from Landsat 5/7. Figure 8b shows that even without AERONET data Landsat 8 achieves slightly better performance, although it must be recognized that this validation study should be extended to more cases in the future, as the Landsat 8 archive grows.
Figure 8a:
Validation of Landsat (5/7) Albedo derived by Shuai et al. (2011) and Franch et al. (2014). Note that Franch used AERONET data to improve the surface reflectance of the LEDAPS reflectance product used as input. From Franch et al. 2014
Figure 8b:
Same as Figure 8a but for Landsat8 Albedo, no AERONET data were used to improve the surface reflectance product.
4. Conclusion
This paper described an approach for atmospheric correction of Landsat 8 that takes advantage of the improved sensor characteristics, the latest development in the state of the art of atmospheric correction (MODIS Collection 6), that is traceable and associated with a strong validation background (NASA EOS heritage). The results presented clearly show an improvement of Landsat 8 surface reflectance product over the ad-hoc Landsat 5/7 LEDAPS product. Indubitably, this effort will be a corner-stone in a series of science products based on the Landsat class of sensors. This method would also be applicable to European Sentinel 2 sensor (Drusch et al., 2012).
Figure 3a:
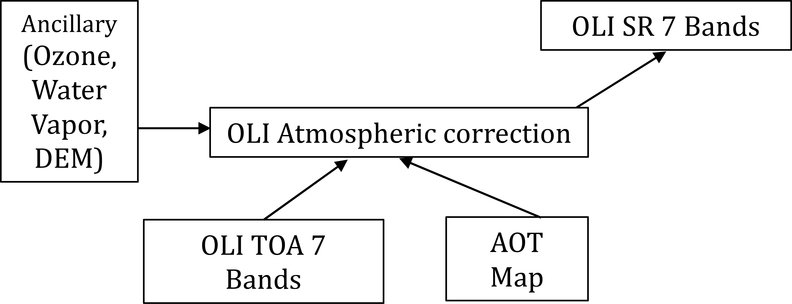
Flowchart of the Landsat8/OLI atmospheric correction scheme.
Figure 5b:
Same as Figure 4 but for Landsat8/OLI band 5 (top left), 6 (Top right), 7 (Bottom left), NDVI (Bottom right).
Acknowledgement
This work was supported by NASA grant NNX12AP82G.
5. References
- Bréon FM, & Vermote E (2012). Correction of MODIS surface reflectance time series for BRDF effects. Remote Sensing of Environment, 125, 1–9. [Google Scholar]
- Bréon F-M; Vermote E, Murphy EF & Franch B (2015). Measuring the Directional Variations of Land Surface Reflectance From MODIS. IEEE Transactions on Geoscience and Remote Sensing, 53 (8), 4638–4649. [Google Scholar]
- Claverie M, Vermote EF, Franch B & Masek JG, 2015. Evaluation of the Landsat-5 TM and Landsat-7 ETM+ surface reflectance products. Remote Sensing of Environment, 169, 390–403. [DOI] [PMC free article] [PubMed] [Google Scholar]
- ETOPO5, Data Announcement 88-MGG-02, Digital relief of the Surface of the Earth. NOAA, National Geophysical Data Center, Boulder, Colorado, 1988. [Google Scholar]
- Dubovik O, Holben B, Eck TF, Smirnov A, Kaufman YJ, King MD, … & Slutsker I (2002). Variability of absorption and optical properties of key aerosol types observed in worldwide locations. Journal of the atmospheric sciences, 59(3), 590–608. [Google Scholar]
- Franch B, Vermote EF, & Claverie M (2014). Intercomparison of Landsat albedo retrieval techniques and evaluation against in situ measurements across the US SURFRAD network. Remote Sensing of Environment, 152, 627–637. [Google Scholar]
- Gao BC, & Kaufman YJ (2003). Water vapor retrievals using Moderate Resolution Imaging Spectroradiometer (MODIS) near-infrared channels. Journal of Geophysical Research: Atmospheres (1984–2012), 108(D13). [Google Scholar]
- Ju J, Roy DP, Vermote E, Masek J, & Kovalskyy V (2012). Continental-scale validation of MODIS-based and LEDAPS Landsat ETM+ atmospheric correction methods. Remote Sensing of Environment, 122, 175–184. [Google Scholar]
- Justice CO, Eck TF, Tanre D, & Holben BN (1991). The effect of water vapour on the normalized difference vegetation index derived for the Sahelian region from NOAA AVHRR data. International Journal of Remote Sensing, 12(6), 1165–1187. [Google Scholar]
- Justice C, & Townshend J (2002). Special issue on the moderate resolution imaging spectroradiometer (MODIS): a new generation of land surface monitoring. Remote sensing of environment, 83(1), 1–2. [Google Scholar]
- Kaufman YJ, Tanré D, Remer LA, Vermote EF, Chu A, & Holben BN (1997). Operational remote sensing of tropospheric aerosol over land from EOS moderate resolution imaging spectroradiometer. Journal of Geophysical Research: Atmospheres (1984–2012), 102(D14), 17051–17067. [Google Scholar]
- Kotchenova SY, Vermote EF, Matarrese R, & Klemm FJ Jr (2006). Validation of a vector version of the 6S radiative transfer code for atmospheric correction of satellite data. Part I: Path radiance. Applied optics, 45(26), 6762–6774. [DOI] [PubMed] [Google Scholar]
- Kotchenova SY, & Vermote EF (2007). Validation of a vector version of the 6S radiative transfer code for atmospheric correction of satellite data. Part II. Homogeneous Lambertian and anisotropic surfaces. Applied optics, 46(20), 4455–4464. [DOI] [PubMed] [Google Scholar]
- Kotchenova SY, Vermote EF, Levy R, & Lyapustin A (2008). Radiative transfer codes for atmospheric correction and aerosol retrieval: intercomparison study. Applied Optics, 47(13), 2215–2226. [DOI] [PubMed] [Google Scholar]
- Levy RC, Remer LA, Mattoo S, Vermote EF, & Kaufman YJ (2007). Second generation operational algorithm: Retrieval of aerosol properties over land from inversion of Moderate Resolution Imaging Spectroradiometer spectral reflectance. Journal of Geophysical Research: Atmospheres (1984–2012), 112(D13). [Google Scholar]
- Masek JG, Vermote EF, Saleous NE, Wolfe R, Hall FG, Huemmrich KF, Gao F, Kutler J & Lim TK, 2006. A Landsat surface reflectance dataset for North America, 1990–2000. Geoscience and Remote Sensing Letters, IEEE, 3(1), pp.68–72. [Google Scholar]
- Roy DP, Ju J, Kline K, Scaramuzza PL, Kovalskyy V, Hansen M, Loveland TR, Vermote E & Zhang C (2010). Web-enabled Landsat Data (WELD): Landsat ETM+ composited mosaics of the conterminous United States. Remote Sensing of Environment, 114(1), 35–49. [Google Scholar]
- Schaaf CB, et al. (2002), First operational BRDF, albedo nadir reflectance products from MODIS, Remote Sensing of Environment, 83(1–2), 135–148. [Google Scholar]
- Shuai Y, Masek JG, Gao F, & Schaaf CB (2011). An algorithm for the retrieval of 30-m snow-free albedo from Landsat surface reflectance and MODIS BRDF. Remote Sensing of Environment, 115(9), 2204–2216. [Google Scholar]
- Tan B, Masek JG, Wolfe R, Gao F, Huang C, Vermote EF, Sexton JO and Ederer G (2013). Improved forest change detection with terrain illumination corrected Landsat images. Remote Sensing of Environment, 136, pp.469–483. [Google Scholar]
- Vermote EF, 2003, Adjacency effect In Encyclopedia of Optical Engineering, pp. 39–48 (New York: Marcel Decker; ). [Google Scholar]
- Vermote EF, El Saleous N, Justice CO, Kaufman YJ, Privette JL, Remer L, Roger JC & Tanre D, 1997a. Atmospheric correction of visible to middle-infrared EOS-MODIS data over land surfaces: Background, operational algorithm and validation. Journal of Geophysical Research: (1984–2012), 102(D14), 17131–17141. [Google Scholar]
- Vermote EF, Tanré D, Deuze JL, Herman M, & Morcette JJ (1997b). Second simulation of the satellite signal in the solar spectrum, 6S: An overview. Geoscience and Remote Sensing, IEEE Transactions on, 35(3), 675–686. [Google Scholar]
- Vermote EF, & Saleous MN (2006). Operational atmospheric correction of MODIS visible to middle infrared land surface data in the case of an infinite Lambertian target In Earth Science Satellite Remote Sensing (pp. 123–153). Springer Berlin Heidelberg. [Google Scholar]
- Vermote E, Justice CO, Breon FM, 2009. Towards a Generalized Approach for Correction of the BRDF Effect in MODIS Directional Reflectances. IEEE Transactions on Geoscience and Remote Sensing, 47(3), 898–908. [Google Scholar]
- Vermote E, Justice C, & Csiszar I (2014). Early evaluation of the VIIRS calibration, cloud mask and surface reflectance Earth data records. Remote Sensing of Environment, 148, 134–145. [Google Scholar]


