Abstract
Aircraft observations and ozonesonde profiles collected on July 14 and 27, 2011, during the Maryland month-long DISCOVER-AQ campaign, indicate the presence of stratospheric air just above the planetary boundary layer (PBL). This raises the question of whether summer stratospheric intrusions (SIs) elevate surface ozone levels and to what degree they influence background ozone levels and contribute to ozone production. We used idealized stratospheric air tracers, along with observations, to determine the frequency and extent of SIs in Maryland during July 2011. On 4 of 14 flight days, SIs were detected in layers that the aircraft encountered above the PBL from the coincidence of enhanced ozone, moderate CO, and low moisture. Satellite observations of lower tropospheric humidity confirmed the occurrence of synoptic scale influence of SIs as do simulations with the GEOS-5 Atmospheric General Circulation Model. The evolution of GEOS-5 stratospheric air tracers agree with the timing and location of observed stratospheric influence and indicate that more than 50% of air in SI layers above the PBL had resided in the stratosphere within the previous 14 days. Despite having a strong influence in the lower free troposphere, these events did not significantly affect surface ozone, which remained low on intrusion days. The model indicates similar frequencies of stratospheric influence during all summers from 2009–2013. GEOS-5 results suggest that, over Maryland, the strong inversion capping the summer PBL limits downward mixing of stratospheric air during much of the day, helping to preserve low surface ozone associated with frontal passages that precede SIs.
1. Introduction
Intrusions of stratospheric air have long been known to influence the composition of the troposphere (e.g., Danielsen, 1968; Johnson and Viezee, 1981) and, occasionally, to enhance surface ozone (e.g. Viezee et al., 1983). Stratospheric intrusions (SIs) that rapidly transport air from the stratosphere deep into the troposphere are typically associated with the development of low-pressure systems and cold fronts near the surface (e.g., Reed, 1955; Shapiro and Keyser, 1990; Appenzeller and Davies, 1992). Relative to surface air, stratospheric air has lower concentrations of moisture, hydrocarbons, methane, nitrous oxide (N2O), and carbon monoxide (CO), but higher concentrations of ozone (O3) and potential vorticity. This distinct chemical signature of SIs has been observed during numerous aircraft field campaigns throughout the subtropics and mid-latitudes (e.g., Browell et al., 1992; Jacob et al., 1992; Newell et al., 1996; Pan et al., 2006; Tilmes et al., 2010; Sullivan et al., 2015). Though the impact of deep SIs are greatest in the free troposphere during winter (e.g., Holton et al., 1995, Stohl et al., 2000, Cristofanelli et al., 2006, Yates et al., 2013, Škerlak et al., 2015) and at the surface during spring (e.g., Lin et al., 2012a, 2015), a growing body of evidence suggests that they play an important role in determining the summertime tropospheric ozone budget over North America (e.g., Langford et al., 2012, 2015; Thompson et al., 2007, 2014). However, the impact of summer intrusions on ozone may be moderated because the difference in ozone mixing ratio between the lower troposphere and lower stratosphere is less during summer than during spring.
Several recent studies have shown that SIs can periodically enhance surface ozone, particularly at the higher elevations of the Western U.S. in late spring through early summer when deep mixed layers facilitate the transport of free tropospheric ozone to the surface. Using aircraft data, ozonesondes, satellite, and surface observations in conjunction with high-resolution simulations by the GFDL AM3 model, Lin et al. (2012a) showed that thirteen SIs increased surface ozone over high-elevation regions of the Western U.S. in April-June 2010. In a longer analysis (1990– 2012) using a coarser resolution model, Lin et al. (2015) found that the frequency of deep SIs plays a key role in year-to-year variability in springtime high-ozone events in Western U.S. surface air. Using a trajectory-based model, Lefohn et al. (2012) found that stratospheric air frequently influenced surface sites across the U.S. Langford et al. (2015) used a combination of lidar, surface observations, and model analysis to show that stratosphere-troposphere transport contributed to three events in Nevada during May-June 2013 where ozone exceeded the 75-ppbv U.S. Environmental Protection Agency (EPA) National Ambient Air Quality Standard (NAAQS). Langford et al. (2009, 2012) previously demonstrated that some air quality exceedances over Colorado and California in May were associated with stratosphere-troposphere transport. While most SI events during winter do not reach the surface due to boundary layer inversions, Dempsey (2014) showed that several winter high-ozone events in Ontario, Canada were linked to stratospheric influence.
Despite decades of research, it remains challenging to diagnose SI impacts on the lower troposphere and to quantify their contribution to surface ozone concentrations. SIs have an episodic, transient, and localized nature and can mix with polluted air masses (e.g., Stohl and Trickl, 1999; Cho et al., 2001; Cooper et al., 2004; Lin et al., 2012b). Once mixed into polluted air in the planetary boundary layer (PBL), this air gradually loses its stratospheric character (e.g., high ozone, low CO), which complicates the diagnosis of SI impacts solely based on observations. Mixing of stratospheric air into the PBL is infrequently observed and can be difficult for models to simulate (e.g. Eisele et al., 1999). In addition to the transport of stratospheric ozone to the PBL, there is also uncertainty associated with the impact of SIs on PBL ozone production because stratospheric air is depleted in trace gases known to influence ozone production, such as methane, hydrocarbons, and water vapor. Uncertainty in stratosphere-troposphere transport contributes to uncertainty in levels of background ozone which complicates efforts to set stringent yet attainable air quality standards (Emery et al., 2012; Fiore et al., 2014).
Atmospheric models have matured to the point where they can play a role in understanding the evolution and impact of SI events, but the utility of such models is computationally limited. Several studies have previously noted that the fine spatial scale of intrusion features poses a challenge for models (e.g. Elbern et al., 1998; Roelofs et al., 2003; Trickl et al. 2010, 2014). Global chemistry-climate model (CCM) simulations, which often run at resolutions of several hundred km, are unable to resolve small-scale SI features. Lin et al. (2012a) showed that global high-resolution (approximately 50 km) CCM simulations are capable of realistically simulating low level ozone increases associated with SIs, but comprehensive chemistry simulations at this resolution remain computationally costly. In addition, because SIs are associated with the development of large-scale weather patterns, regional air quality models with limited domains may not represent the dynamical and chemical environment from which SIs are generated.
The research presented here is motivated by a need to understand the frequency of stratospheric intrusions over the Eastern U.S. and their potential to influence air quality. Though Eastern SIs have received less attention than SIs in the Western U.S., several studies have indicated that they may play an important role in determining free tropospheric ozone mixing ratios. The climatology of cross-tropopause events compiled by Sprenger and Wernli (2003) highlighted the role of rapid stratosphere-troposphere transport events during winter over the southeastern U.S. An updated climatology by Skerlak et al. (2014) suggested that such events affect air within the PBL over the Eastern U.S. during spring, but likely exert a much smaller influence during summer. Bourqui and Trepanier (2010) and Bourqui et al. (2012) discussed SIs observed by ozonesondes during August in eastern Canada demonstrating the potential importance of SIs outside of the Western U.S.
We report on 1) the occurrence of two SIs observed over Maryland during July 2011 as part of NASA’s Deriving Information on Surface conditions from Column and Vertically Resolved Observations Relevant to Air Quality (DISCOVER-AQ) campaign, and 2) the ability of NASA’s Goddard Earth Observing System, version 5 (GEOS-5) general circulation model (GCM) to simulate their dynamical evolution. These events are noteworthy because they demonstrate that SIs occur during summer and over the Eastern U.S. and that stratospherically-influenced air in such cases can reach as low as 2–4 km above the surface and have some influence on near surface air. This manuscript examines the extent to which surface ozone and the chemistry important for ozone formation may be affected by SIs. We also study the utility of the GEOS-5 GCM, augmented with passive, computationally-efficient tracers for identifying air masses influenced by the stratosphere.
In Section 2, we describe the DISCOVER-AQ field campaign and the GEOS-5 model configuration used for this study. In Section 3, we present an analysis of aircraft, ozonesonde, surface observations, and model results documenting the SI cases. We discuss our results and their implications in Section 4.
2. Data and Model Description
2.1. DISCOVER-AQ
NASA’s Earth Venture DISCOVER-AQ (http://discover-aq.larc.nasa.gov/; Crawford and Pickering, 2014; Crawford et al., 2014) investigation was designed to acquire atmospheric data needed to improve the use of satellite observations for air quality applications. Data were collected during four field campaigns in Maryland (2011), California (2013), Texas (2013), and Colorado (2014). The first campaign was conducted during July 2011, consisting of aircraft data, in situ, and remote sensing observations at six surface monitoring sites in Maryland. At Edgewood, MD (8 m above sea level), the Nittany Atmospheric Trailer and Integrated Validation Experiment (NATIVE; Martins et al., 2012; Stauffer et al., 2012) platform provided one-minute averaged meteorological observations and mixing ratios of ozone, CO, and NOy. Ozonesondes (Thompson et al., 2014) were also launched from Edgewood either once or twice daily, and provided profiles of ozone and moisture throughout the campaign. The NASA P-3B aircraft (Flynn et al., 2014) collected in situ meteorological and chemical data on 14 flight days. Flying below 5 km, the P-3B sampled air in the lower troposphere and PBL down to 250m, performing 3 spirals over each surface site per flight. The mean elevation of the Maryland DISCOVER-AQ study region was 33 m above sea level.
2.2. AIRS
The Atmospheric Infrared Sounder (AIRS) aboard NASA’s Aqua satellite provides temperature, humidity, and ozone profiles (Aumann et al., 2003; Susskind et al. 2006; Chahine et al. 2006). Because data are collected during both day and night (1330 and 0130 LT) and retrievals are performed in the presence of clouds, AIRS data provide global views of the evolution of large-scale weather systems. In this analysis, we use AIRS level 2, version 6 retrievals that have a spatial resolution of 0.5°, include improvements in the retrieval of temperature and moisture properties (Susskind et al., 2014), and report relative humidity with accuracies of 10–15% of the mean value (Ruzmaikin et al., 2014).
2.3. GEOS-5
The GEOS-5 atmospheric general circulation model (AGCM) represents the atmosphere on a variety of temporal and spatial scales. It is a central component of the GEOS-5 atmospheric data assimilation system (Rienecker et al., 2008), where it is used to develop meteorological analyses, including the production of the Modern Era Retrospective Analysis for Research and Applications (MERRA; Rienecker et al., 2011) and MERRA-2 (Bosilovich et al., 2015). The GEOS-5 AGCM is described in Rienecker et al. (2008) with more recent changes in physical parameterizations documented in Molod et al. (2012). The model domain extends from the surface to 0.01 hPa and uses 72 hybrid layers that transition from terrain-following near the surface to pressure levels above 180 hPa. In this study, the nominal horizontal resolution is 50 km (as justified later in this section) with a time step of 450 seconds for physical computations and more frequent computations of resolved-scale transport in the dynamical core.
Trace gases are transported on-line in GEOS-5 using a finite-volume scheme on a cubed-sphere grid as described in Putman and Lin (2007) for resolved-scale advection. Turbulent mixing of trace gases is performed in the same way as for moisture (using the Lock et al. (2000) boundary-layer scheme combined with Louis and Geleyn (1982)). The Relaxed-Arakawa Schubert convective scheme (Moorthi and Suarez, 1992) is used to represent convective transport. Advective transport is constrained with MERRA fields to ensure consistency with observed meteorology. This is done through application of an incremental analysis update, which is computed every 6 hours, that effectively draws the modeled atmospheric state towards the analyzed state. This procedure is similar to the procedure used in the GEOS-5 data assimilation system as described in Bloom et al. (1996). These simulations also include a simplified representation of CO chemistry described in Ott et al. (2010) to evaluate the model’s ability to simulate transport of polluted airmasses.
We implemented two types of idealized stratospheric air tracers to track SIs. For the purpose of this study, we define stratospheric air based on the GEOS-5 diagnosed tropopause. This is defined by calculating the tropopause height separately using both thermal and PV definitions and then choosing the higher of the two estimates. The first type of tracer we refer to as an “influence” tracer. This tracer is initially set to 1 above the tropopause and reset to 0 at the surface. Its value represents the fraction of air (reported here as percent) that was recently in the stratosphere, thus providing insight into the dominant processes influencing an air mass. Because turbulent motions mix air throughout the PBL on timescales less than one hour, the influence tracer decreases rapidly once transported into the PBL. This decrease is intended to represent the loss of stratospheric characteristics upon mixing with air in the boundary layer that is strongly influenced by surface emissions.
The second type of tracer we refer to as a “pulse” tracer. Pulse tracers are initially set to a value of 1 above the tropopause and 0 below; values of 1 above the tropopause are maintained for 7 days. Five pulse tracers were initialized on July 1, 8, 15, 22, and 29, 2011 to study the DISCOVER-AQ period. These tracers allow both identification of air masses recently in the stratosphere and some quantification of the period of time that has passed since. They can also be added together to examine the transport of stratospheric air over multi-week periods and, in this study, are typically combined over two-week periods. Though enhancements in these tracers allow identification of air masses recently in the stratosphere, they do not provide information on the ozone mixing ratios within SIs, which are influenced by a complex array of processes including circulation within the lower stratosphere, mixing with tropospheric air containing varying degrees of pollution, and chemical loss as the intrusion moves through the troposphere. Because the pulse tracers are not reset to 0 at the surface, their evolution provides insight into the boundary layer entrainment of these air parcels, which is a key part of their ability to influence air quality. Analyzed together, the combination of the pulse and influence tracers provide a quantification of the uncertainty in the model’s estimate of stratospheric air fraction and insight into the fraction of stratospheric air that has been in contact with the surface.
2.4. MERRA-2 Assimilated Ozone
Because the version of GEOS-5 used in this study does not include realistic ozone photochemistry, we compare our tracer results with assimilated ozone fields produced by the MERRA-2 (Bosilovich et al., 2015). The ozone assimilation system used in MERRA-2 is described in more detail in Wargan et al. (2015) and combines total column ozone observations from the Ozone Monitoring Instrument (OMI; Levelt et al., 2006) with Microwave Limb Sounder (MLS; Waters et al., 2006) ozone profiles extending from the upper-troposphere through the stratosphere. The MERRA-2 ozone assimilation represents an advancement over the MERRA ozone assimilation product, which relied upon coarser resolution data from Solar Backscattered Ultra Violet instruments.
MERRA-2 assimilated ozone fields, available at approximately 50 km horizontal resolution, are able to realistically reproduce ozone observations in the UTLS and above because data constraints are strongest in this altitude range. In the mid- to lower troposphere, the use of highly simplified chemistry and lack of emissions generally leads to an underestimate in ozone as discussed in Wargan et al. (2015). Because of these limitations, MERRA-2 ozone fields can be expected to provide a realistic estimate of mixing ratios within stratospheric intrusion layers consistent with GEOS-5 meteorology, but will poorly represent observations in airmasses dominated by surface emissions.
3. Results
3.1. Impact of horizontal resolution
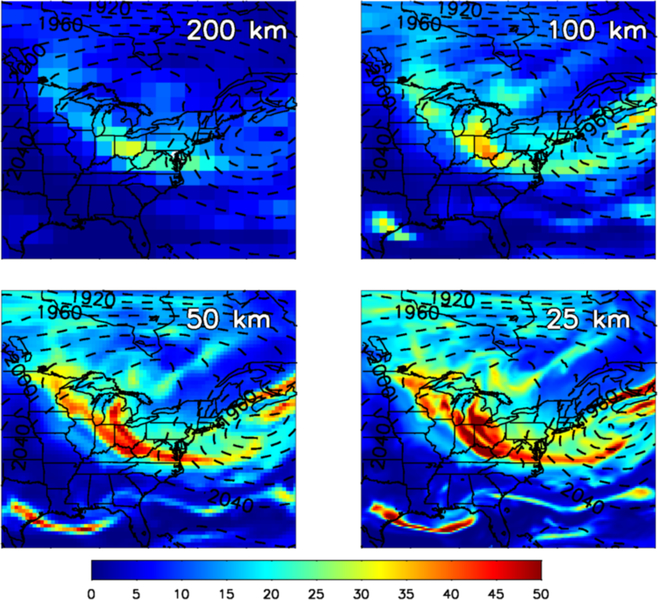
The importance of resolution in realistically simulating SIs has previously been demonstrated by Gray (2003), Bourqui et al. (2006), Bourqui et al. (2012), and Lin et al. (2012a). A comparison of GEOS-5 simulations conducted at four different horizontal resolutions ranging from 25-km to 200-km demonstrates the importance of resolution for simulating the impacts of SIs in the lower troposphere (Figure 1). At 800 hPa, the 200-km simulation indicates stratospheric air over Virginia, West Virginia, and Ohio with peak tracer values of 30% or lower. Little stratospheric air is evident over Texas or Nova Scotia in the 200-km simulation. As resolution is increased to 100-km, both the areal extent of the intrusion and the maximum values at 800 hPa increase; stratospheric influence over Texas and near Nova Scotia appear at this resolution. Further increasing resolution to 50-km reveals the complex, split structure of the intrusion at 800 hPa. Stratospheric tracer values are greater than 50% in 6 states and greater than 30% in 9 states in contrast to the 200-km simulation that revealed tracer values exceeding 30% in only one state. The 25-km simulation produces intrusion features that are similar to the 50-km simulation, but with higher tracer values in a number of locations. While Figure 1 shows the pulse tracer, results from the influence tracer (not shown) display similar resolution dependence. These results support the conclusion by Lin et al. (2012a) that model resolutions of 50-km or greater are needed to resolve the structure of deep stratospheric intrusions. At resolutions coarser than 50 km, models are not able to resolve the fine-scale filaments associated with tropopause folds. A comparison of 800 hPa heights (Figure 1) shows that the large-scale flow is remarkably consistent and insensitive to resolution differences supporting the conclusion of Lin et al. (2015) that CCMs with a horizontal resolution of 200-km are useful for studying interannual variability of SI frequency. Though not evaluated here, vertical resolution is also likely to influence the ability of models to realistically simulate SI features. Subsequent figures are produced using the 50-km simulation.
Figure 1.
Comparison of stratospheric pulse tracers on July 14, 2011 at 800 hPa for model resolutions ranging from 200 km to 25 km. Colors represent the percentage of air that had been in the stratosphere between July 1 and 14. Dashed lines show 800 hPa geopotential heights.
3.2. July 14, 2011
3.2.1. Meteorological Conditions
On July 13, 2011, a cold front associated with a low-pressure system passed over Maryland. Reagan National Airport (DCA) recorded persistent cloud cover with heavy thunderstorms in the afternoon. Sea level pressure rose by 10 hPa while the maximum daily temperature decreased by 4°C from July 13 to July 14. Cooler temperatures dominated from July 12–16 with maximum daily temperatures at DCA ranging from 28–30°C during this period, 4–6°C degrees below the July 2011 monthly mean. MERRA relative humidity also plummeted with values just above the boundary layer greater than 80% on July 13 dropping to less than 20% on July 14. Low relative humidity persisted for several days at the 750 hPa level, but, this layer of dry air extended below 850 hPa at 12 UTC on July 14 (8 LT).
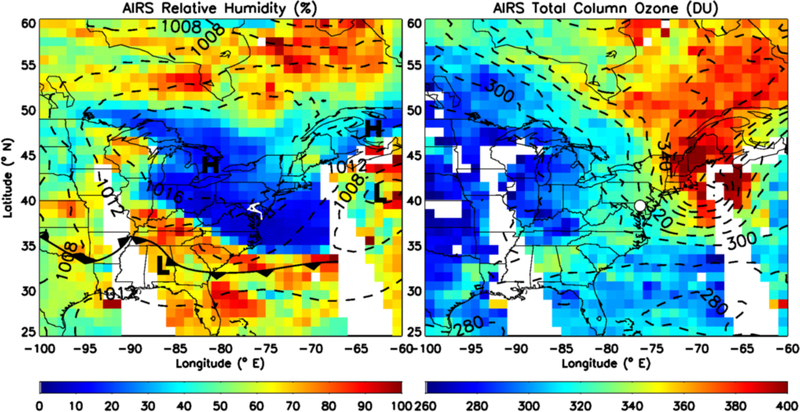
Observations from AIRS (Figure 2) provided a regional view of conditions on July 14. Consistent with the MERRA meteorological analysis, AIRS shows extremely low relative humidity values (<20%) at 700 hPa extending from the Great Lakes, where a high pressure center was located, to the Atlantic Ocean. Total column ozone observations from AIRS, which largely reflect ozone in the upper troposphere and lower stratosphere, indicate moderate values (330 DU) over Maryland with lower values over the Midwest U.S. and peak values of ozone (> 400 DU) located over the Atlantic Ocean and New England. These sharp horizontal gradients in satellite total column ozone typically indicate the presence of an SI (Olsen et al., 2000; Pan et al., 2007; Pittman et al., 2009; Lin et al., 2012a; Tang and Prather, 2012), but it is unclear from viewing the column ozone alone where effects near the surface are likely to be greatest. The spatial distribution of MERRA-2 column ozone agrees well with the AIRS observations, though ozone over the region shown in figure 2 is 12.4 DU lower in MERRA-2.
Figure 2.
AIRS 700 hPa relative humidity (left) on July 14, 2011 overlaid with MERRA sea level pressure contours (dashed) and AIRS total column ozone (right) overlaid with MERRA-2 total column ozone (dashed). The P-3B flight track over Maryland is shown in white on the left plot while the Edgewood ozonesonde launch site is indicated on the right plot by a white dot.
Danielsen (1968, 1980) described the structure of SIs associated with synoptic-scale weather systems in which air associated with an upper level jet is transported downward and southward from the stratosphere into the troposphere and wraps around the cyclonic flow. The maximum in total column ozone (Figure 2) coincides with an upper level trough where the MERRA tropopause pressure dips below 300 hPa. Areas of stratospheric influence and high ozone in the lower troposphere (Figure 1) are associated with filaments originating in Southern Canada that wrap around the large-scale cyclone and align with the southwestern edge of the dry air mass (Figure 2).
3.2.2. Temporal Evolution
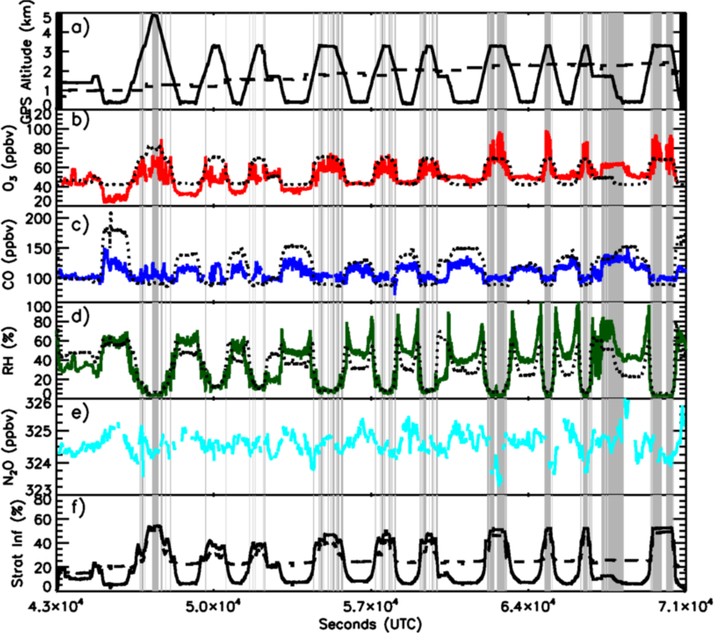
Taking advantage of clear conditions following the frontal passage, the P-3B flew from 12 UTC (8 LT) to nearly 20 UTC (16 LT) on July 14 making a series of 10 ascents and descents across Maryland (Figure 3). Minimum ozone mixing ratios were observed as the aircraft flew below 1 km at 13 UTC (9LT). During these low altitude flight segments, ozone gradually increased throughout the day from approximately 25 ppbv to 50 ppbv. Mean ozone values below 1 km on July 14 were the lowest observed on any flight during the campaign (42 ppbv), 25 ppbv below the campaign mean (67 ppbv).
Figure 3.
Aircraft observations from the P-3B on July 14, 2011 taken from 12 to 20 UTC. Panel (a) shows aircraft altitude (black, km) overlaid with GEOS-5 diagnosed PBL height (dashed, km). Observed ozone (red, ppbv) and MERRA-2 ozone (black dotted; ppbv) are shown in (b). GEOS-5 simulated (dotted) and observed CO (blue, ppbv) are shown in panel (c). Simulated (dotted) and observed relative humidity (green, %) are shown in panel (d) while observed N2O (cyan, ppbv) is plotted in (e). Time series of the GEOS-5 stratospheric tracers (%) are shown in panel (f) with the solid line indicating the influence tracer and dashed line showing the July 1–14 pulse tracer. Gray shaded areas indicate periods when ozone was more than one standard deviation greater than the mean value for the flight.
The most striking feature of the airborne ozone observations on July 14 is that the greatest mixing ratios (>90 ppbv) were encountered 2 km or more above the surface. Mean mixing ratios were 19 ppbv higher in the 3 to 4 km layer than in the layer below 2 km. In contrast to the vertical structure observed during SI events, ozone averaged over the entire campaign at altitudes less than 2 km was typically 1.5 ppbv higher than campaign-averaged ozone measured between 3 and 4 km (8 ppbv higher if SI days are not included in the average). On July 14, high ozone occurred in conjunction with moderate CO (< 100 ppbv) meaning that it is unlikely that the enhanced ozone resulted from transport of a polluted air mass. The high ozone/moderate CO air mass sampled by the aircraft was also extremely dry, with relative humidity less than 10%. Statistically significant anticorrelations between CO and ozone (r=−0.32) and relative humidity and ozone (r=−0.58) are consistent with signatures of stratospheric air masses observed during previous aircraft campaigns (e.g. Cooper et al., 2004; Bowman et al., 2007; Pan et al., 2007; Pan et al., 2010; Yates et al., 2013).
The GEOS-5 stratospheric tracers (Figure 3e) indicate that the air sampled by the P-3B on July 14 was strongly influenced by the stratosphere above 2 km. Time series of both the influence tracer and pulse tracer, which tracks air residing in the stratosphere from July 1–14, indicate that 40–50% of the high ozone air mass had been in the stratosphere some time between July 1 and 14. The correlation coefficient between the time series of the stratospheric influence tracer and observed ozone (r=0.67, slope=0.49, intercept=39.8) indicates a strong, positive correlation. The magnitude of the stratospheric contribution above 2 km remains consistent throughout the flight. The pulse tracer indicates that the percentage of air below 2 km that had been in the stratosphere recently rose slightly through the course of the day (from 15 to 20%), but remained considerably smaller than in the air mass above the PBL.
MERRA-2 ozone mixing ratios also show enhancements in ozone above the PBL. Because the GEOS-5 model is able to reproduce the dynamical structure and evolution of the intrusion and the lower stratospheric mixing ratios are constrained by the assimilation of MLS data, MERRA-2 estimates realistic mixing ratios within the stratospheric air layer. During the first four flight segments below 1 km, MERRA-2 tends to overestimate ozone while ozone is underestimated during later low altitude flight segments because of the lack of surface emissions in the model and inability to capture the diurnal cycle driven by photochemistry. Correlations between MERRA-2 ozone and simulated CO (−0.79) and relative humidity (−0.7) overestimate the degree of anticorrelation evident in the aircraft data because of MERRA-2’s underestimate of near surface ozone.
N2O observations, which are frequently used to identify intrusion events (e.g. Collins et al., 1996; Ishijima et al., 2010; Assonov et al., 2013), are fairly uniform on July 14. While N2O decreases are evident during some aircraft penetrations of the stratospheric air layer, particularly later in the flight, changes in the other trace gas observations that indicate an intrusion (O3, CO, H2O) sometimes occur with little change in N2O. This may be because mixing of free tropospheric air leads to spatial heterogeneity in N2O distributions within the intrusion or because of a lack of contrast between PBL and free tropospheric mixing ratios on this day. Gradients of CO between the PBL and intrusion layer are smaller on July 14 compared with other intrusion days (July 27 and 10) as are peak values of the model’s stratospheric tracers. This may indicate that on July 14, the plane sampled a stratospheric air mass that had undergone more mixing with tropospheric air compared to the other intrusions presented.
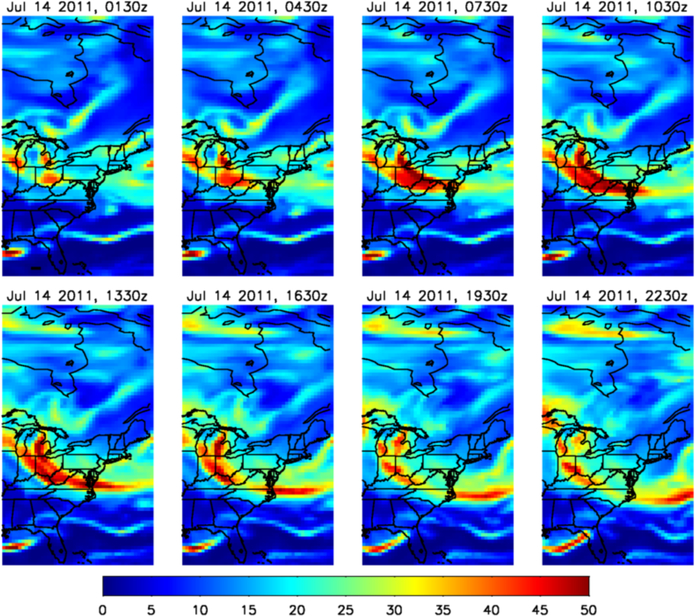
Time series of horizontal cross sections of the pulse tracer at 800 hPa show a widespread area of stratospheric influence over the Eastern U.S. that evolved rapidly throughout July 14 (Figure 4). Stratospheric air fractions greater than 40% first appear over Ohio and Michigan overnight (0130 and 0430 UTC). Peak influence over Maryland is seen in the early morning hours of July 14 (0730 and 1030 UTC) as stratospheric air moves downward and eastward. During the P-3B flight (12 to 20 UTC), the stratospheric airmass continued to move south and east of the sampling region meaning that the aircraft may have missed the area of peak influence over Maryland that had occurred a few hours before. These plots also indicate the horizontal extent of the descending airmass, which influenced the lower troposphere throughout the northeastern U.S. at various times during the day. Distributions of the influence tracer (supporting information figure 1) are similar to the pulse tracer, but characterized by slightly higher peak values within the intrusion until 1330 UTC, which indicates the presence of some air that had been in the stratosphere prior to July 1. After 1630 UTC, influence tracer concentrations are less than the pulse tracer over Maryland because air has been mixed into the boundary layer and the influence tracer is lost through contact with the surface.
Figure 4.
GEOS-5 stratospheric pulse tracer at 800 hPa over the course of July 14, 2011. Colors indicate the fraction of air that had been in the stratosphere between July 1 and 14.
3.2.3. Vertical Structure
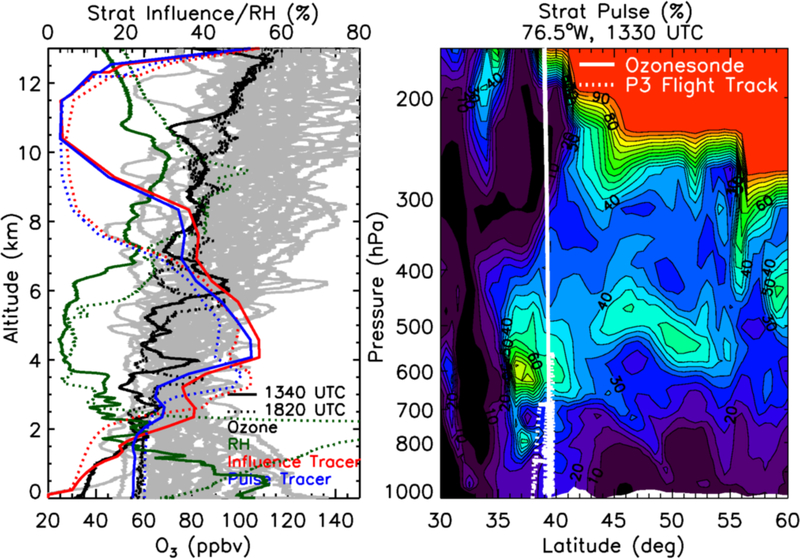
A latitude-altitude cross section of the GEOS-5 pulse tracer provides a view of the vertical structure of the SI over Maryland on July 14 (right panel of Figure 5). Air below 9 km was strongly influenced by the stratosphere while between 9 km and the tropopause (approximately 12 km), non-stratospheric air (defined as air that had more recently contacted the surface than the stratosphere) dominates because the intrusion slants to the northwest with increasing altitude. In the PBL (below 2.5 km), the influence of stratospheric air was less than in the free troposphere.
Figure 5.
July 14 ozonesonde measurements (left panel) from Edgewood taken at 1340 (solid black) and 1820 UTC (dotted black). Gray lines indicate all ozonesonde measurements taken during DISCOVER-AQ while green lines show observed relative humidity from the sondes. GEOS-5 stratospheric influence tracers sampled at the same locations are shown in red (with surface reset) and blue (pulse tracer without surface reset). Right panel shows GEOS-5 stratospheric pulse tracer cross section at the longitude of Maryland. Dotted white line shows the latitude and altitude of the July 14 P-3B flight (Figure 3) while the solid white line shows the location of ozonesonde measurements taken at Edgewood, MD. Colors indicate the fraction of air that had been in the stratosphere between July 1 and 14.
July 14 ozonesonde measurements from Edgewood, Maryland (Figure 5) show that ozone was relatively low throughout the free troposphere with the exception of several mid-tropospheric layers in which ozone was enhanced. In the PBL (below 2.5 km), ozonesondes launched at 1340 and 1820 UTC measured values in the lowest 10% of all ozonesonde measurements taken during DISCOVER-AQ. This was likely due to the passage of a low-pressure system the previous day that led to meteorological conditions favorable for lowering ozone including the venting of polluted PBL air, cloud-induced suppression of photochemical production, and removal of ozone precursors (Kunz and Speth, 1997). The earlier sonde encountered layers of higher ozone from 3.5 to 4 km and 5.5 to 7 km coincident with low relative humidity. In contrast to the low ozone observed in the PBL, the 6 to 6.5 km layer mean value of 92 ppbv is larger than 70% of ozonesonde measurements collected during the project for the same altitude range. At 1820 UTC, both stratospheric air layers had descended by approximately 0.5 km.
GEOS-5 influence and pulse tracers reproduce the depth of the dry, high ozone layer well and support the conclusion that the air sampled by the ozonesondes was influenced by an SI. Between 1.5 and 9 km, the slightly larger values of the influence tracer compared to the pulse tracer indicates that a small percentage of air over Edgewood resided in the stratosphere before July 1, but had not yet come into contact with the ground. Model output sampled at the time and location of the earlier ozonesonde indicates a layer of air influenced by the stratosphere with the strongest influence from 3–7 km, which is consistent with observed relative humidity less than 10% in this layer and ozone enhancements between 3.5 to 4 km and 5.5 to 7 km. Though the model does not fully replicate the complex vertical structure of ozone observed in the free troposphere, it matches the vertical extent of the dry air mass and does show several layers of stratospheric influence. Tracer profiles computed at the time of the later ozonesonde also show a descent of stratospheric air in the free troposphere, consistent with the evolution of observed ozone and relative humidity profiles. Vertical profiles of ozone showing enhancements due to a SI bounded by lower values above and below occur because the intrusion slants from NW to SE with decreasing altitude as noted by Danielsen (1980).
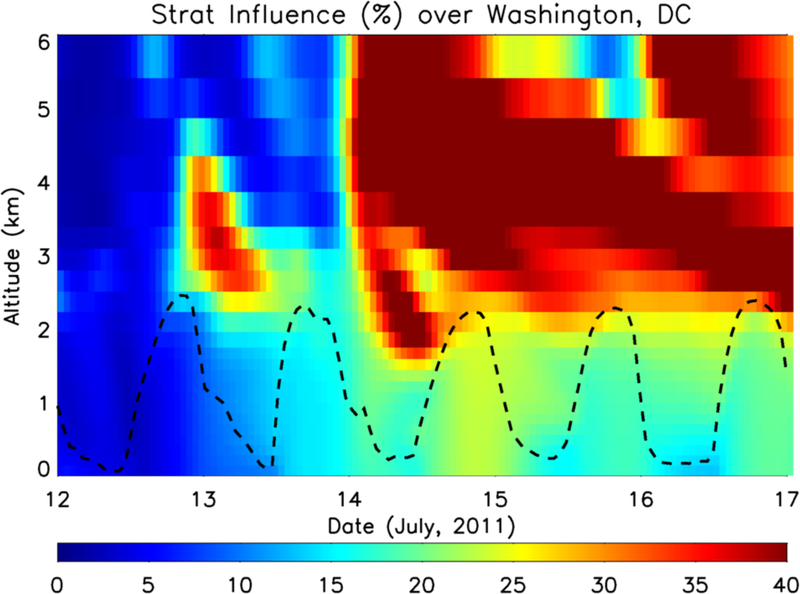
Profiles of the pulse tracer in the lower troposphere show the temporal evolution of the stratospheric air layer intercepted by the P-3B and ozonesondes on July 14 (Figure 6). Some stratospheric influence occurred early on July 13 between 2 and 5 km (MERRA data also indicate a coincident dry air mass). On July 14, stratospheric air returned and remained just above the boundary layer for the next few days. The deepest penetration of the stratospheric air layer occurred before sunrise on July 14, when the GEOS-5 stratospheric pulse tracer indicates that 40% of air at 2 km had resided in the stratosphere during the previous two weeks.
Figure 6.
Stratospheric pulse tracer mixing ratio in GEOS-5 over the DISCOVER-AQ flight region (colored contours) on July 12–16. Black line indicates model estimated PBL height.
It should be noted that the impact of the simulated SI on air quality depends strongly on the parameterization of PBL mixing in GEOS-5. Profiles of GEOS-5 tracers with ozonesonde observations (Figures 5, 9, and 12) generally agree well in their indication PBL depth, but these data only provide a snapshot once or twice daily. Comparisons of P-3B and GEOS-5 CO profiles (not shown) suggest that the model may slightly overestimate the depth of the daytime PBL. If this is the case, stratospheric influence at the surface may be slightly underestimated during much of the day due to excessive dilution, but entrainment of stratospheric air during early morning airs could also be excessive. No observations are available to evaluate the model during the critical early morning hours making it difficult to assess the model estimated entrainment of air into the PBL.
Figure 9.
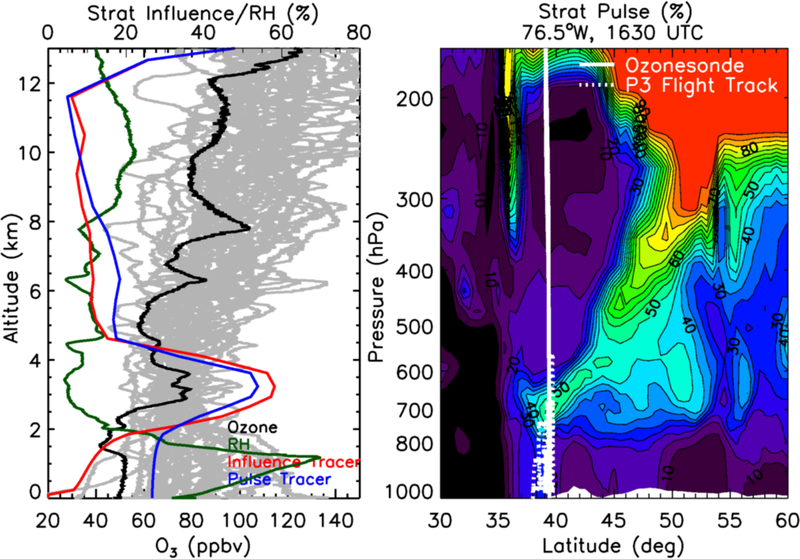
July 27 ozonesonde measurements (left panel) from Edgewood taken at 1500 UTC (black). Gray lines indicate all ozonesonde measurements taken during DISCOVER-AQ while green lines show observed relative humidity from the July 27 sonde. GEOS-5 stratospheric influence tracers sampled at the same locations are shown in red (with surface reset) and blue (pulse tracer without surface reset). Right panel shows GEOS-5 stratospheric pulse tracer cross section at the longitude of Maryland. Dotted white line shows the latitude and altitude of the July 27 P-3B flight (Figure 8) while the solid white line shows the location of ozonesonde measurements taken at Edgewood, MD. Colors indicate the fraction of air that had been in the stratosphere between July 15 and 27.
Figure 12.
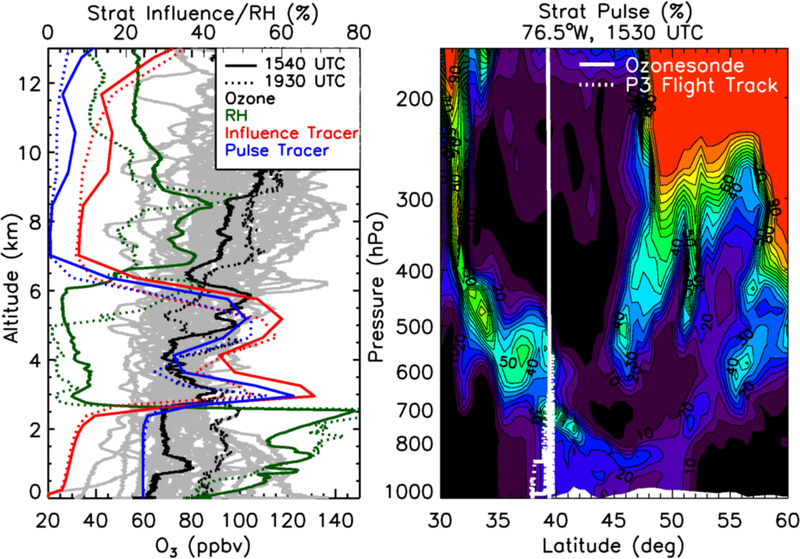
Left panel shows July 10 ozonesonde measurements from Edgewood taken at 1540 (solid black) and 1930 UTC (dotted black). Gray lines indicate all ozonesonde measurements taken during DISCOVER-AQ while green lines show observed relative humidity from the July 27 sonde. GEOS-5 stratospheric influence tracers sampled at the same locations are shown in red (with surface reset) and blue (pulse tracer without surface reset). Right panel shows GEOS-5 stratospheric influence tracer cross section at the longitude of Maryland for July 10.
3.2.4. Impact of SI on Surface Air
Despite the persistence of stratospheric influence in the free troposphere, GEOS-5 model simulations suggest that this influence was weaker within the PBL than aloft. The greatest increases in stratospheric air within the PBL occurred during the mornings of July 13, 14, and 16 as PBL depth increased, entraining some of the stratospheric air and mixing it downward. During July 13 and 14, the concentration of the stratospheric pulse tracer in the lowest model layer increased by 14% (from 8% to 22%). On July 15, stratospheric tracer concentrations in the PBL decreased slightly before increasing again by 2–3% on July 16 and 17.
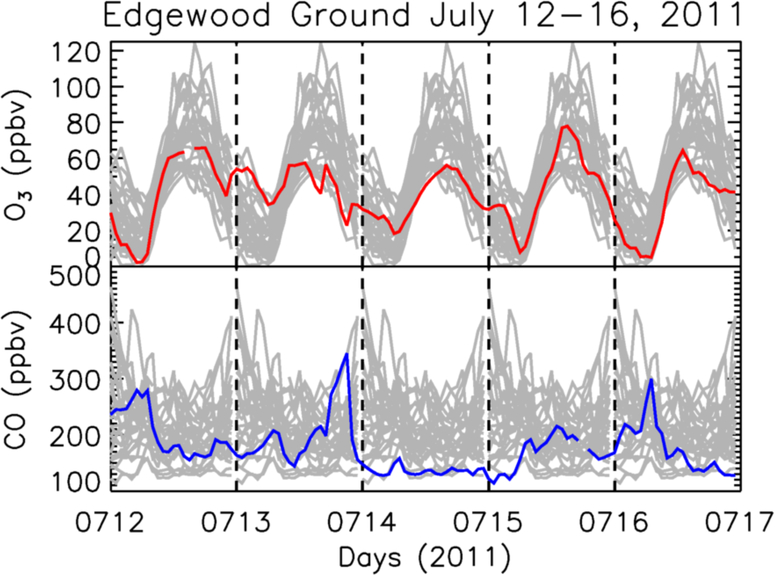
Hourly measurements from Edgewood show that near-surface ozone remained low on July 14 (Figure 7), consistent with the P-3B and ozonesonde observations. On the afternoon of July 13, ozone decreased rapidly as the front passed over Maryland. Overnight between July 13 and 14, ozone remained fairly high (minimum of 18 ppbv) compared to other days during the month (average minimum ozone of 12 ppbv). This is likely due to the venting associated with the frontal passage that reduced NOx, leading to less ozone loss during nighttime hours by titration with NO. During July 14, ozone increased through the day, but at a slower rate than was typical for the month. The maximum hourly mean ozone (calculated by averaging ozone over one hour periods and finding the largest value for each day) was 56 ppbv on July 14, 25 ppbv lower than the monthly mean value of 81 ppbv though still higher than the background ozone of 20–30 ppbv estimate by Fiore et al. (2014) for the Eastern U.S. CO remained low throughout the day on July 14, reaching a peak hourly mean value of only 158 ppbv, nearly 150 ppbv less than the mean daily maximum for the month (307 ppbv). Because the GEOS-5 tracers indicate a small flux of stratospheric air into the boundary layer (14%) on July 13–14, alterations to the diurnal cycle of ozone (characterized by a nighttime minimum due to NO titration, daytime maximum due to photochemical production) and CO (characterized by a peak in pre-dawn hours due to concentration of pollution in shallow boundary layer) are unlikely to be due to the stratospheric intrusion.
Figure 7.
Hourly mean observations of ozone (top, red) and CO (bottom, blue) from the Edgewood, Maryland ground site on July 12 through 16, 2011. Gray lines indicate the observed hourly means calculated for each day during July 2011.
3.3. July 27, 2011
3.3.1. Meteorological Conditions
Meteorological conditions on July 27 were generally similar to July 14. A cold front associated with a low-pressure system had passed over Maryland on July 26. Sea level pressure at DCA increased by 8 hPa while the maximum daily temperature decreased slightly (by 1°C), but remained warm with a peak of 34°C. MERRA relative humidity dropped sharply from 70% to 20% at 700 hPa. In contrast to the July 14 event, low relative humidity only persisted for a single day, transitioning to a moister air mass late on July 28. AIRS relative humidity observations at 700 hPa showed that a dry air mass extended over the mid-Atlantic states, but had less areal extent than the July 14 air mass. Total column ozone was 330 DU over Maryland with lower values over the Midwest and higher values over New England.
3.3.2. Temporal Evolution
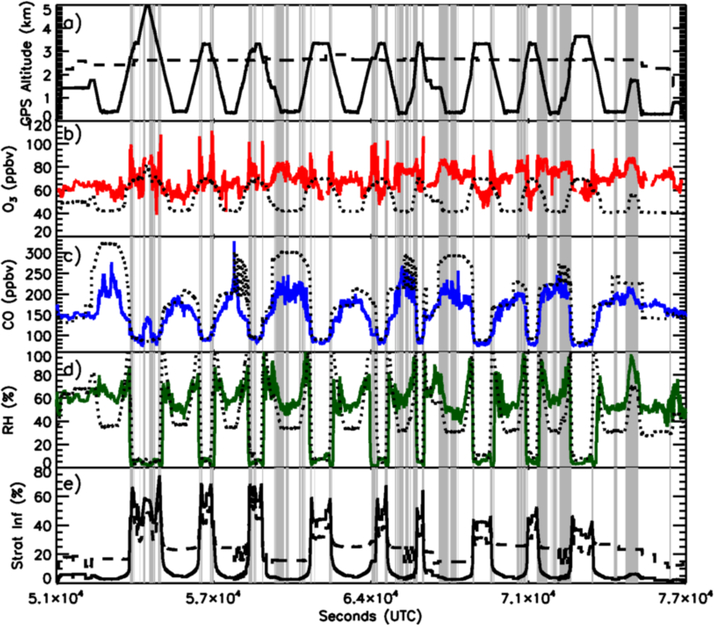
On July 27, the P-3B flew from 14 UTC (10 LT) to 2130 UTC (1730 LT) making 9 ascents and descents. As on July 14, the aircraft encountered low to moderate ozone on the first 5 flight segments below 1 km while ozone greater than 70 ppbv was measured above the PBL (Figure 8). Observations obtained during the first ascent and descent segments indicate the presence of a thin layer of stratospheric air residing above the PBL. As the aircraft climbed from 1 to 3 km, it encountered a sharp increase in ozone from 35 to 80 ppbv. Ozone remained high (> 70 ppbv) between 3 and 4 km, but between 4 and 5 km observations show a sharp drop in ozone to approximately 50 ppbv. The high ozone layer contained moderate CO (< 100 ppbv), lower N2O (< 324 ppbv compared to free tropospheric mixing ratios of 325 ppbv), and relative humidity less than 10%. The 4 to 5 km layer was moister and contained larger mixing ratios of N2O relative to the 3 to 4 km layer. Data on July 27 indicate a weak anticorrelation between CO and ozone (r=−0.13) but stronger anticorrelations between relative humidity and ozone (r=−0.48) and between ozone and N2O (r=−0.42).
Figure 8.
Aircraft observations from the P-3B on July 27, 2011 taken from 14 to 21 UTC. Panel (a) shows aircraft altitude (black, km) overlaid with GEOS-5 diagnosed PBL height (dashed, km). Observed ozone (red, ppbv) and MERRA-2 ozone (black dotted; ppbv) are shown in (b). GEOS-5 simulated (dotted) and observed CO (blue, ppbv) are shown in panel (c). Simulated (dotted) and observed relative humidity (green, %) are shown in panel (d) while observed N2O (cyan, ppbv) is plotted in (e). Time series of the GEOS-5 stratospheric tracers (%) are shown in panel (f) with the solid line indicating the influence tracer and dashed line showing the July 15–27 pulse tracer. Gray shaded areas indicate periods when ozone was more than one standard deviation greater than the mean value for the flight.
GEOS-5 stratospheric tracers also indicate the presence of a thin, well-defined stratospheric air layer between 3 and 4 km. As in the July 14 case, this layer was bounded above and below by tropospheric air because the intrusion slanted to the northwest with increasing altitude. Time series of the influence and pulse tracers (Figure 8e) show enhancements in tracer mixing ratios coincident with aircraft observations of high ozone, moderate CO, and very low relative humidity. The close agreement of the influence and pulse tracers implies that 50–60% of this air mass had resided in the stratosphere between July 15 and 27 and that this air layer had not yet contacted the surface. The correlation coefficient between time series of observed ozone and the stratospheric influence tracer on July 27 (r=0.61, slope=0.38, intercept=48.9) indicates a strong, positive correlation.
MERRA-2 ozone underestimates the degree of ozone enhancement in the intrusion layer by approximately 15 ppbv. It ozone also fails to capture the drop in ozone above the intrusion layer. This may be because the ozone assimilation is influenced by the relatively coarse footprint of the MLS observations (200–300km), diminishing its ability to capture small-scale features of the intrusion relative to the stratospheric tracers.
The temporal evolution of the stratospheric air layer at 800 hPa as indicated by the GEOS-5 pulse tracer shows stratospheric air first descending over the Great Lakes region at 0130 and 0430 UTC. Stratospheric air mass fractions greater than 30% are evident over Pennsylvania and move south over Maryland by 0730 and 1030 UTC. During the P-3B flight from 14 to 21 UTC, the stratospheric air layer remained quasi-stationary over Maryland providing a rare opportunity for sampling this air mass over an extended period. The presence of the SI was not known at the time that the flight was planned highlighting the potential value of computationally-efficient forecasting tools.
3.3.3. Vertical Structure
A latitude-altitude cross section of the pulse tracer shows the relationship between the P-3B flight and the July 27 SI (right panel in Figure 9). The stratospheric air layer was characterized by a smaller vertical extent compared to the July 14 event (Figure 5). The P-3B aircraft sampled this layer throughout the July 27 flight, but only on the first ascent/descent flew high enough to sample air above this layer that showed little influence from recent stratospheric contact.
The P-3B ozone measurements provide a unique measurement of the depth of the stratospherically-influenced air layer that is well reproduced by GEOS-5 stratospheric tracers. Defining the observed stratospheric air layer as an air mass with ozone > 60 ppbv, we estimate a layer thickness of 1.2 km (2.4 to 3.6 km) on the first ascent over Padonia, MD, an area just north of Baltimore. On the first descent over Fairhill, MD, near the Delaware border, the aircraft encountered a layer that was 2.2 km thick (2.3 to 4.5 km). The difference in layer thickness indicates that the stratospheric layer was thicker in northeastern Maryland than over Baltimore, highlighting the complex structure of the intrusion, which slants through the depth of the troposphere. Defining the GEOS-5 stratospheric air layer as locations with a stratospheric influence tracer value greater than 50%, we estimate a stratospheric air layer 1.3 km thick on the ascent (2.6 to 3.9 km) and 1.1 km thick on the descent (2.9 to 4 km). The tracer diagnosed layer thickness agrees very well with the observation-based estimate on the ascent, though this layer is slightly higher than observed. On the descent, the model underestimates the stratospheric layer thickness, though both layers are centered at 3.4 km. Model limitations in estimating layer thickness are due in part to vertical resolution which ranges from 0.1 km below 1 km to 0.2 km from 2 to 3 km and 0.4 km between 4 and 5 km. The model may also struggle to fully reproduce the slant of the intrusion that caused the difference in layer thickness measured on the ascent and descent.
Ozonesonde observations for July 27 also show enhanced ozone (> 70 ppbv) and relative humidity less than 10% between 2.5 and 3.5 km (Figure 9). The GEOS-5 tracers agree well with these observed SI characteristics and indicate that this layer was strongly influenced by the stratosphere. As was the case on July 14, the SI had limited impact on ozone in the PBL, which reached only 50 ppbv (in the lowest 10% of observations during the project). High ozone layers observed by the sonde at 6 and 8 km do not appear to be caused by stratospheric air; the GEOS-5 influence tracer indicates that less than 10% of that air was recently in the stratosphere.
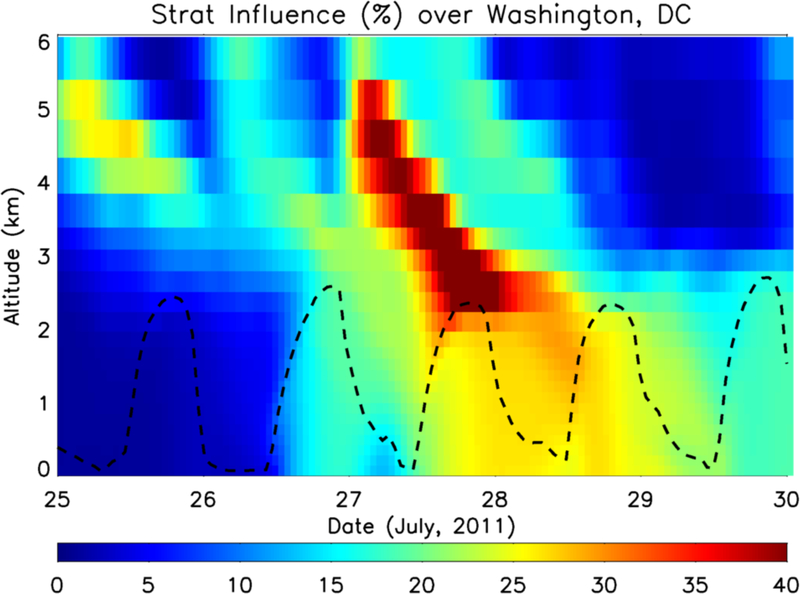
Profiles of the GEOS-5 pulse tracer track the evolution of the July 27 stratospheric impact on near-surface air (Figure 10). While some evidence of stratospheric air is seen on July 25, this layer has little impact below 3.5 km. On July 26–27, the stratospheric air layer sampled by the P-3B and ozonesonde measurements descended to 2.5 km, near the top of the daytime PBL. As the PBL rose through daylight hours, it entrained a small amount of this air, increasing the presence of the stratospheric pulse tracer near the surface by 13% on both July 26 and 27. Though the July 27 SI influenced the atmosphere above Maryland for a shorter time period than the July 14 intrusion, the GEOS-5 model estimates a greater influence on surface air on the 27th.
Figure 10.
Stratospheric pulse tracer mixing ratio in GEOS-5 over the DISCOVER-AQ flight region (colored contours) on July 25–29. Black line indicates model estimated PBL height.
3.3.4. Impact of SI on Surface Air
Ground-based ozone observations from July 27 (not shown) also indicated that ozone remained low throughout the day, showing little impact from the SI aloft. Ozone overnight remained at moderate levels, reaching a minimum value of only 18 ppbv. The ozone increased slowly through the morning and early afternoon, reaching a peak value of 58 ppbv (compared to a project mean of 81 ppbv). CO remained low during daylight hours reaching a maximum value of 263 ppbv, 44 ppbv below the project mean daily maximum of 307 ppbv, after sunset on July 27.
The weak impact of the SI on surface ozone is likely due to both the inversion atop the boundary layer inhibiting downward mixing during much of the day and the relatively small difference between ozone mixing ratios in the SI and PBL. Ozone enhancements in the July 14 and 27 SIs were smaller (80–90 ppbv) than in spring Western U.S. SIs where enhancements greater than 100 ppbv have been documented (Lin et al. 2012a; Langford et al., 2015). Because the seasonal cycle of lower stratospheric ozone is at a minimum during summer months while surface ozone is at its peak, summer SIs are likely to have a smaller direct effect on ozone mixing ratios than spring events.
3.4. Stratospheric influence on July 10
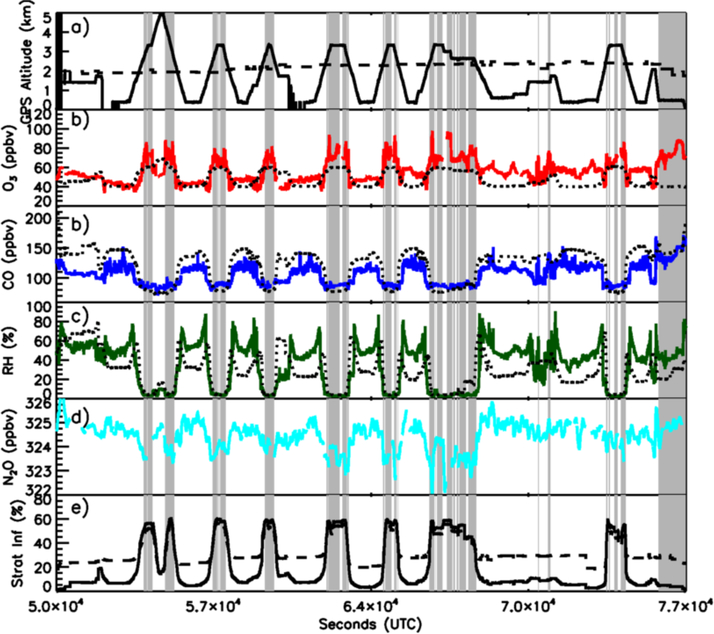
Whereas the July 14 and July 27 observations clearly show stratospheric influence in the lower free troposphere, but with little effect near the surface, the July 10 observations show a more complex chemical situation in which stratospheric air interacts with surface pollution. On July 10 (Figure 11), the P-3B also encountered a high ozone layer at 3 km before 18 UTC (14 LT). As was the case in the other intrusion events, these ozone spikes occurred with moderate CO and very low relative humidity (no N2O data were available on this day). The GEOS-5 tracers indicated that 40–60% of this air mass had recently resided in the stratosphere. Ozone and CO mixing ratios within the PBL were considerably larger on July 10 compared to the 14th and 27th, indicating that in this case chemical production of ozone from locally emitted precursors played a greater role. Ozone near the surface increased throughout the day while the influence of the stratospheric air aloft decreased such that after 18 UTC, ozone at 3 km was no longer substantially enhanced relative to the air below. MERRA-2 ozone, which is not capable of realistically simulating near surface pollution events, suggests a much stronger gradient between mixing ratios in the PBL and the intrusion layer than observed. Ozonesonde measurements and GEOS-5 tracer profiles (Figure 12) indicate a dry stratospheric layer between 3 and 6 km with good agreement between the observed and simulated layer thickness. As in previous cases, the largest influence of stratospheric air is found above the PBL with only a small amount of this air descending to the surface.
Figure 11.
Aircraft observations from the P-3B on July 10, 2011 taken from 14 to 21 UTC. Panel (a) shows aircraft altitude (black) overlaid with GEOS-5 diagnosed PBL height (dashed, km). Observed ozone (red, ppbv) and MERRA-2 ozone (black dotted; ppbv) are shown in (b). GEOS-5 simulated (dotted) and observed CO (blue, ppbv) are shown in panel (c). Simulated (dotted) and observed relative humidity (green, %) are shown in panel (d). Time series of the GEOS-5 stratospheric tracers (%) are shown in panel (e) with the solid line indicating the influence tracer and dashed line showing the July 1–10 pulse tracer. Gray shaded areas indicate periods when ozone is more than one standard deviation greater than the mean value for the flight.
Differences between the July 10 and the July 14 and 27 events are likely due to differences in the meteorological conditions. A low-pressure system had passed over Maryland on July 8, accompanied by periods of heavy rain. Pressure rose by 10 hPa between July 8 and July 9 while maximum temperatures increased by 3°C to 33°C. Conditions on July 9 and July 10 were similar with high temperatures of 33°F on both days and only partial to scattered cloudiness reported at DCA. While the July 14 and 27 flights were conducted on the day following passage of a low-pressure system associated with a cold front, the July 10 flight was conducted two days after a low pressure system passed over the area. On July 9, when no flight was conducted, the warmer temperatures and relatively clear conditions provided time for low level ozone to rebound from decreases on July 8 seen in observations at the Edgewood ground site. As a result, on July 10, the aircraft sampled both the remnants of a dissipating stratospheric air layer aloft and increasingly polluted air within the PBL. Both the aircraft data and GEOS-5 tracers indicate that the high ozone mixing ratios in the PBL were likely due to photochemical production and not the stratospheric intrusion. The complexity of this case underscores the importance of realistic PBL mixing in GCMs. Ensemble studies using perturbations to turbulent mixing parameters may help to quantify transport errors as discussed in McGrath-Spangler et al. (2015).
3.5. Stratospheric Influence in July from 2009–2013
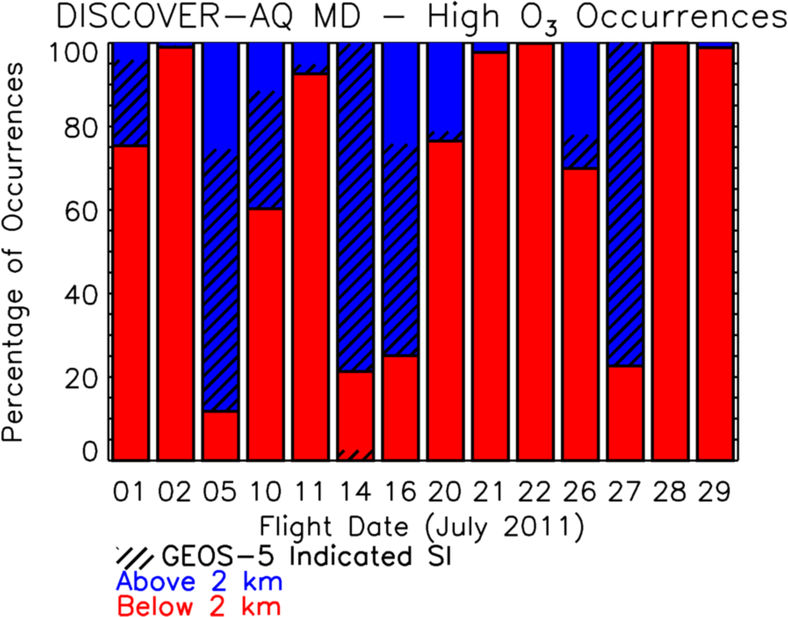
We found that during the entire Maryland deployment of the 2011 DISCOVER-AQ campaign, stratospheric air masses were frequently observed above the PBL and associated with enhanced ozone in the lower free troposphere. For each flight day, we identify high-ozone measurements as P-3B ozone greater than one standard deviation above the flight mean. Figure 13 shows the fraction of high ozone measurements that occur below and above 2 km. On 4 of 14 flight days during July, the majority of high-ozone observations were taken above 2 km. GEOS-5 tracers on these days indicate that the majority of these observations were associated with a substantial influence from the stratosphere. Despite the frequency of stratospheric influence just above the PBL, GEOS-5 indicates that there is limited downward mixing or associated enhancements in surface ozone during July 2011.
Figure 13.
Percentage of high (greater than one standard deviation above the flight mean) ozone occurrences above (blue) and below (red) 2 km during each DISCOVER-AQ flight. Dashed lines show the percentage of observations with a stratospheric influence tracer value greater than 30%.
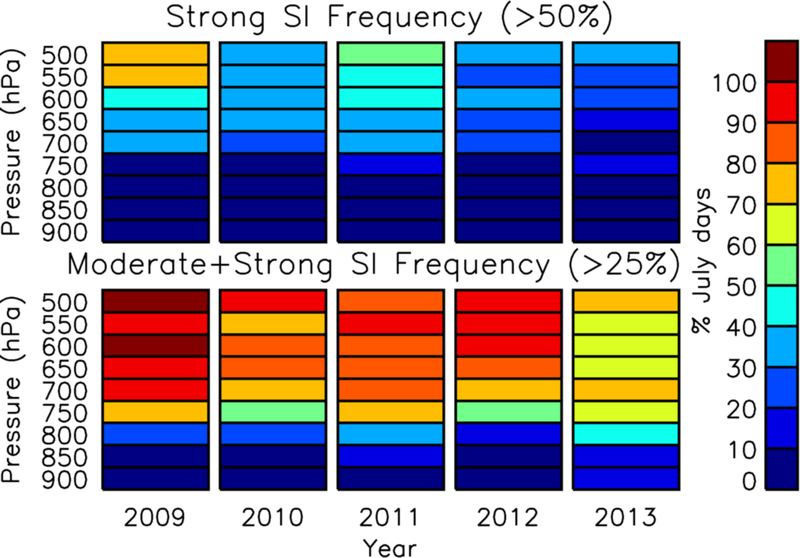
GEOS-5 simulations of July during 5 different years (2009 to 2013) show that SIs frequently influence the lower and mid-troposphere over the Eastern U.S. (Figure 14). During 2011, more than 80% of July days had stratospheric influence tracer values greater than 25% between 700 and 500 hPa. Though strong SIs (tracer > 50%) were less frequent than moderate intrusions (tracer > 25%), they still influenced 30% of days during July, 2011. Compared to the four other years simulated, 2011 appears to be fairly typical in terms of total SI frequency but higher than other years when only strong SIs are considered. The greatest number of intrusions diagnosed by GEOS-5 stratospheric tracers occurred during 2009. Despite their frequent occurrence above the PBL, moderate intrusion effects are found within the PBL on only two days in 2010 in 2013. Weak intrusion effects (tracer > 10%, not shown) within the PBL occur on more than 50% of days in each year, but it is unclear whether such small percentages of stratospheric air influence air quality.
Figure 14.
Top (bottom) plot shows the percentage of July days per year where the maximum value of the stratospheric influence tracer over Maryland exceeded 50% (25%) at each pressure level.
These findings echo those of Thompson et al. (2014) who compared ozonesonde measurements from the 2011 DISCOVER-AQ campaign with measurements from 2006 through 2011. Their results indicated that 2011 ozone budgets and meteorological parameters resembled the previous five summers and were typical for the Eastern U.S. The laminar identification technique and fields from the NCEP/NCAR reanalysis also indicated an increase in the numbers of SIs in 2008 and 2009 relative to the other years examined.
In the Western U.S., Lin et al (2015) found springtime SIs that increased ozone at the surface occurred more frequently following strong La Niña winters while El Niño events tended to increase upper tropospheric ozone without influencing the surface. More frequent SIs over the western U.S. during spring typically coincides with more high-ozone events at the surface. During summer months over Maryland, in contrast, more frequent SIs can indicate less ozone at the surface because the passage of cold fronts associated with SIs leads first to a “cleaning” of local pollution. For instance, July 2009 and 2013, respectively, the maximum and minimum in SI frequency, coincide with less surface ozone over Maryland than in other years. July 2009 was also characterized by lower temperatures that would inhibit ozone photochemical production from local emissions. In contrast to the western U.S. during spring, where SI frequency plays a key role on year-to-year variability of high surface ozone events [Lin et al., 2015], anomalies in temperature and stagnation conditions may be larger drivers of high-ozone events in eastern U.S. surface air. Because this study only examined the frequency of SIs over a single state during a 5-year time period, more work is needed to quantify the role of climate variability in influencing SIs and air quality over the Eastern U.S.
4. Conclusions
While previous studies have noted the occurrence of SIs in winter and spring and discussed the role of SIs in driving surface ozone mixing ratios to exceed NAAQS standards in mountainous western states, relatively few studies (e.g. Lefohn et al., 2012; Thompson et al. 2014) have shown that SIs play a substantial role in the tropospheric ozone budget over the Eastern U.S. during summer, a time and place long thought to be dominated solely by pollution events. Our results, which are consistent with observations (e.g., Thompson et al., 2014), demonstrate that SIs frequently influence ozone mixing ratios just above the PBL during the summer over the Eastern U.S. Whether or not these SIs ever directly elevate surface ozone levels above the current NAAQS, they most certainly influence the policy-relevant background ozone levels, including net ozone production in the lower free troposphere, and should be explicitly simulated in air quality models.
We present simple, computationally-efficient stratospheric tracers that could provide useful information on the frequency and extent of SIs for air quality managers if implemented into operational numerical weather prediction models. Comparisons of these tracers with observed indicators of SIs from both aircraft and ozonesondes demonstrate that these tracers are able to reproduce the vertical extent of intrusion layers in the lower troposphere remarkably well. While chemical forecasts of ozone are not currently implemented in global numerical weather prediction models, our results show that the implementation of simple and computationally efficient tracers provide information for tracking stratospheric air masses that may be of use to air quality managers and decision-makers who must set stringent yet attainable air quality standards and understand the complex evolution and causes of observed ozone exceedances.
Our analysis indicates that while SIs are able to transport high ozone air masses to the top of the PBL rapidly during summer months, the direct influence of these air masses on surface ozone is limited for several reasons. First, both GEOS-5 and observations suggest that the strong capping inversions that typically top the summer PBL limit downward mixing during much of the day. Free tropospheric air masses (of stratospheric or other origin) are entrained primarily during morning hours as the PBL grows upward. The ability of SIs to affect surface air quality thus requires a coincidence of conditions; large-scale circulations must move the stratospheric air into the lower troposphere so that it is in place as the PBL grows and entrains air. In the cases discussed above, these conditions occurred, but resulted in relatively small enhancements of stratospheric air near the surface.
Second, SIs typically follow large low pressure systems that improve air quality by increasing transport of pollutants away from urban regions, by removing ozone precursors through precipitation and chemical loss, and through cloud-suppression of photochemical ozone production. Because ozone mixing ratios within the PBL have decreased after the frontal passage, this decrease may dominate over the small increases in ozone due to downward mixing of stratospheric air masses.
Third, ozone mixing ratios in the upper troposphere/lower stratosphere (UT/LS) region, where SIs originate, are not as high in summer as during winter and spring (e.g. Neu et al., 2014) resulting in less direct influence of summer SIs on near surface ozone. Stratospheric air masses also contain low mixing ratios of ozone precursors and water vapor that may tend to inhibit photochemical ozone production, effectively counteracting any increase in ozone that would occur from the downward mixing of ozone-rich air masses in the free troposphere.
Supplementary Material
Key Points.
Eastern US stratospheric intrusions can strongly influence composition of lower free troposphere.
High-resolution global models reproduce temporal evolution and dynamical structure of these events.
Summertime stratospheric intrusions have implications for air quality.
Acknowledgements
This work was supported by funding from NASA’s Atmospheric Composition Campaign Data Analysis and Modeling program and NASA’s DISCOVER-AQ campaign. MERRA and MERRA-2 data have been provided by the GMAO at NASA’s Goddard Space Flight Center through the NASA GES DISC online archive. AIRS data are also available through the GES DISC. DISCOVER-AQ aircraft and ozonesonde observations were provided by NASA’s Langley Research Center at http://www-air.larc.nasa.gov/missions/discover-aq/discover-aq.html. GEOS-5 stratospheric tracer simulations will be provided upon request.
References
- Appenzeller C, and Davies HC, (1992), Structure of stratospheric intrusions into the troposphere, Nature, 358 (6387), 570–572. [Google Scholar]
- Assonov SS, Brenninkmeijer CAM, Schuck T, and Umezawa T (2013), N2O as a tracer of mixing stratospheric and tropospheric air based on CARIBIC data with applications for CO2, Atmos. Env, 79, 769–779, doi: 10.1016/j.atmosenv.2013.07.035. [DOI] [Google Scholar]
- Aumann H, et al. (2003), AIRS/AMSU/HSB on the Aqua mission: Design, science objectives, data products, and processing systems, IEEE Trans. Geosci. Remote Sens, 41, 253–264. [Google Scholar]
- Bloom S, Takacs L, DaSilva A, and Ledvina D (1996), Data assimilation using incremental analysis updates, Mon. Wea. Rev, 124, 1256–1271. [Google Scholar]
- Bosilovich MG, Lucchesi R, and Suarez M, MERRA-2: File Specification. GMAO Office Note No. 9 (Version 1.0), 2015. [Google Scholar]
- Bourqui MS, and Trépanier P-Y (2010), Descent of deep stratospheric intrusions during the IONS August 2006 campaign, J. Geophys. Res, 115, D18301, doi: 10.1029/2009JD013183. [DOI] [Google Scholar]
- Bourqui MS, Yamamoto A, Tarasick D, Moran MD, Beaudoin L-P, Beres I, Davies J, Elford A, Hocking W, Osman M, and Wilkinson R (2012), A new global real-time Lagrangian diagnostic system for stratosphere-troposphere exchange: evaluation during a balloon sonde campaign in eastern Canada, Atmos. Chem. Phys, 12, 2661–2679, doi: 10.5194/acp-12-2661-2012. [DOI] [Google Scholar]
- Bowman KP, Pan LL, Campos T, and Gao R-S (2007), Observations of fine-scale transport structure in the upper troposphere from HIAPER, J. Geophys. Res, 112, D18111, doi: 10.1029/2007JD008685. [DOI] [Google Scholar]
- Browell EV, Butler CF, Kooi SA, Fenn MA, Harriss RC, and Gregory GL (1992), Large-scale variability of ozone and aerosols in the summertime Arctic and sub-Arctic troposphere, J. Geophys. Res, 97(D15), 16433–16450, doi: 10.1029/92JD00159. [DOI] [Google Scholar]
- Chahine MT, et al. (2006), AIRS: Improving Weather Forecasting and Providing New Data on Greenhouse Gases, Bull. Amer. Meteor. Soc, 87, doi:dx.doi.org/ 10.1175/BAMS-87-7-911. [DOI] [Google Scholar]
- Cho JYN, Newell RE, Browell EV, Grant WB, Butler CF, and Fenn MA (2001), Observation of pollution plume capping by a tropopause fold, Geophys. Res. Lett, 28, 3243–3246. [Google Scholar]
- Collins JE Jr., Sachse GW, Anderson BE, Harriss RC, Bartlett KB, Sandholm S, Wade LO, Burney LG, and Hill GF (1996), Airborne nitrous oxide observations over the western Pacific Ocean: September–October 1991, J. Geophys. Res, 101(D1), 1975–1984, doi: 10.1029/95JD02530. [DOI] [Google Scholar]
- Cooper OR, et al. (2004), On the life cycle of a stratospheric intrusion and its dispersion into polluted warm conveyor belts, J. Geophys. Res, 109, D23S09, doi: 10.1029/2003JD004006. [DOI] [Google Scholar]
- Crawford JH and Pickering KE (2014), DISCOVER-AQ: Advancing strategies for air quality observations in the next decade, EM, Air Waste Manag Assoc, 4–7. [Google Scholar]
- Crawford JH, Dickerson RR, and Hains JC (2014), DISCOVER-AQ: Observations and early results, EM, Air Waste Manag Assoc, 8–15. [Google Scholar]
- Cristofanelli P, Bonasoni P, Tositti L, Bonafè U, Calzolari F, Evangelisti F, Sandrini S, and Stohl A (2006), A 6-year analysis of stratospheric intrusions and their influence on ozone at Mt. Cimone (2165 m above sea level), J. Geophys. Res, 111, D03306, doi: 10.1029/2005JD006553. [DOI] [Google Scholar]
- Danielsen EF (1968), Stratospheric-tropospheric exchange based on radioactivity, ozone and potential vorticity, J. Atmos. Sci, 25, 502–518. [Google Scholar]
- Danielsen EF (1980), Stratospheric source for unexpectedly large values of ozone measured over the Pacific Ocean during Gametag, August 1977, J. Geophys. Res, 85(C1), 401–412, doi: 10.1029/JC085iC01p00401. [DOI] [Google Scholar]
- Dempsey F (2014), Observations of stratospheric O3 intrusions in air quality monitoring data in Ontario, Canada, Atmos. Environ, 98, 111–122, doi: 10.1016/j.atmosenv.2014.08.024. [DOI] [Google Scholar]
- Eisele H, Scheel HE, Sladkovic R, and Trickl T (1999), High-Resolution Lidar Measurements of Stratosphere–Troposphere Exchange, J. Atmos. Sci, 56, 319–330. [Google Scholar]
- Elbern H, Hendricks J, Ebel A (1998), A Climatology of Tropopause Folds by Global Analyses, Theor. Appl. Climatol, 59, 181–200. [Google Scholar]
- Emery C, Jung J, Downey N, Johnson J, Jimenez M, Yarwood G, and Morris R (2012), Regional and global modeling estimates of policy relevant background ozone over the United States, Atmos. Environ, 47, 206. [Google Scholar]
- Fiore AM, Oberman JT, Lin MY, Zhang L, Clifton OE, Jacob DJ, Naik V, Horowitz LW, and Pinto JP (2014), Estimating North American background ozone in U.S. surface air with two independent global models: Variability, uncertainties, and recommendations, Atmos. Environ, 96, 284–300, doi: 10.1016/j.atmosenv.2014.07.045. [DOI] [Google Scholar]
- Flynn CM, et al. (2014), The Relationship between Column-density and Surface Mixing Ratio: Statistical Analysis of O3 and NO2 Data from the July 2011 Maryland DISCOVER-AQ Mission, Atmos. Environ, 92, 429–441, doi: 10.1016/j.atmosenv.2014.04.041. [DOI] [Google Scholar]
- Gray SL (2003), A case study of stratosphere to troposphere transport: The role of convective transport and the sensitivity to model resolution, J. Geophys. Res, 108, 4590, doi: 10.1029/2002JD003317, D18. [DOI] [Google Scholar]
- Holton JR, Haynes PH, McIntyre ME, Douglass AR, Rood RB, and Pfister L (1995), Stratosphere-troposphere exchange, Rev. Geophys, 33(4), 403–439, doi: 10.1029/95RG02097. [DOI] [Google Scholar]
- Ishijima K, et al. (2010), Stratospheric influence on the seasonal cycle of nitrous oxide in the troposphere as deduced from aircraft observations and model simulations, J. Geophys. Res, 115, D20308, doi: 10.1029/2009JD013322. [DOI] [Google Scholar]
- Jacob DJ, et al. (1992), Summertime photochemistry of the troposphere at high northern latitudes, J. Geophys. Res, 97(D15), 16421–16431, doi: 10.1029/91JD01968. [DOI] [Google Scholar]
- Johnson WB, and Viezee W (1981), Stratospheric ozone in the lower troposphere-I. Presentation and interpretation of aircraft measurements, Atmos. Environ, 15, 7, 1309–1323. [Google Scholar]
- Kunz H, and Speth P (1997),Variability of Near-Ground Ozone Concentrations During Cold Front Passages – a Possible Effect of Tropopause Folding Events, J. Atmos. Chem, 28, 77–95. [Google Scholar]
- Langford AO, Aikin KC, Eubank CS, and Williams EJ (2009), Stratospheric contribution to high surface ozone in Colorado during springtime, Geophys. Res. Lett, 36, L12801. [Google Scholar]
- Langford AO, Brioude J, Cooper OR, Senff CJ, Alvarez RJ II, Hardesty RM, Johnson BJ, and Oltmans SJ (2012), Stratospheric influence on surface ozone in the Los Angeles area during late spring and early summer of 2010, J. Geophys. Res, 117, D00V06, doi: 10.1029/2011JD016766. [DOI] [Google Scholar]
- Langford AO, Senff CJ, Alvarez II RJ, Brioude J, Cooper OR, Holloway JS, Lin MY, Marchbanks RD, Pierce RB, Sandberg SP, Weickmann AM, and Williams EJ (2015), An overview of the 2013 Las Vegas Ozone Study (LVOS): Impact of stratospheric intrusions and long-range transport on surface air quality, Atmos. Environ, 109, 305–322, doi: 10.1016/j.atmosenv.2014.08.040. [DOI] [Google Scholar]
- Lefohn AS, Wernli H, Shadwick D, Oltmans SJ, and Shapiro M (2012), Quantifying the importance of stratospheric-tropospheric transport on surface ozone concentrations at high- and low-elevation monitoring sites in the United States, Atmos. Environ, 62, 646–656, doi: 10.1016/j.atmosenv.2012.09.004. [DOI] [Google Scholar]
- Levelt PF, Oord GHJVD, Dobber MR, Mälkki A, Visser H, Vries JD, Stammes P, Lundell JOV, and Saari H (2006), The ozone monitoring instrument, IEEE Trans. Geosci. Remote Sens, 44, 1093–1101, doi: 10.1109/TGRS.2006.872333. [DOI] [Google Scholar]
- Lin M, Fiore AM, Cooper OR, Horowitz LW, Langford AO, Levy H II, Johnson BJ, Naik V, Oltmans SJ, and Senff CJ (2012a), Springtime high surface ozone events over the western United States: Quantifying the role of stratospheric intrusions, J. Geophys. Res, 117, D00V22, doi: 10.1029/2012JD018151. [DOI] [Google Scholar]
- Lin M, et al. (2012b), Transport of Asian ozone pollution into surface air over the western United States in spring, J. Geophys. Res, 117, D00V07, doi: 10.1029/2011jd016961. [DOI] [Google Scholar]
- Lin M, Fiore AM, Horowitz LW, Langford AO, Oltmans SJ, Tarasick D (2015), Climate variability modulates western U.S. surface ozone in spring via deep stratospheric intrusions, Nature Communications, 6, doi: 10.1038/ncomms8105. [DOI] [PMC free article] [PubMed] [Google Scholar]
- Lock AP, Brown AR, Bush MR, Martin GM, and Smith RNB (2000), A New Boundary Layer Mixing Scheme. Part I: Scheme Description and Single-Column Model Tests, Monthly Weather Review, 128, 3187–3199. [Google Scholar]
- Louis JF, and Geleyn J (1982) A short history of the PBL parameterization at ECMWF. Proc. ECMWF Workshop on Planetary Boundary Layer Parameterization, Reading, United Kingdom, ECMWF, 59–80. [Google Scholar]
- Martins DK, Stauffer RM, Thompson AM, Halliday HS, Kollonige D, Joseph E, and Weinheimer AJ (2013), Ozone correlations between mid-tropospheric partial columns and the near-surface at two mid-Atlantic sites during the DISCOVER-AQ campaign in July 2011, J. Atmos. Chem, doi: 10.1007/s10874-013-9259-4. [DOI] [PMC free article] [PubMed] [Google Scholar]
- Molod A, Takacs L, Suarez M, Bacmeister J, Song I-S, and Eichmann A (2012), The GEOS-5 Atmospheric General Circulation Model: Mean Climate and Development from MERRA to Fortuna, NASA Technical Report Series on Global Modeling and Data Assimilation, NASA TM—2012–104606, Vol. 28, 117 pp. [Google Scholar]
- Moorthi S, and Suarez MJ (1992), Relaxed Arakawa–Schubert: A parameterization of moist convection for general circulation models, Monthly Weather Review, 120, 978–1002. [Google Scholar]
- Neu JL, et al. (2014), The SPARC Data Initiative: Comparison of upper troposphere/lower stratosphere ozone climatologies from limb-viewing instruments and the nadir-viewing Tropospheric Emission Spectrometer, J. Geophys. Res. Atmos, 119, 6971–6990, doi: 10.1002/2013JD020822. [DOI] [Google Scholar]
- Newell RE, Wu Z-X, Zhu Y, Hu W, Browell EV, Gregory GL, Sachse GW, Collins JE Jr., Kelly KK, and Liu SC (1996), Vertical fine-scale atmospheric structure measured from NASA DC-8 during PEM-West A, J. Geophys. Res, 101(D1), 1943–1960, doi: 10.1029/95JD02613. [DOI] [Google Scholar]
- Olsen MA, Gallus WA Jr., Stanford JL, and Brown JM (2000), An intense Midwestern cyclone: Fine-scale comparison of model analysis with TOMS total ozone data, J. Geophys. Res, 105, 20487–20495. [Google Scholar]
- Ott L, Duncan B, Pawson S, Colarco P, Chin M, Randles C, Diehl T, and Nielsen JE (2010), Influence of the 2006 Indonesian biomass burning aerosols on tropical dynamics studied with the GEOS.5 AGCM, J. Geophys. Res, 115, D14121. doi: 10.1029/2009JD013181. [DOI] [Google Scholar]
- Pan LL, Konopka P, and Browell EV (2006), Observations and model simulations of mixing near the extratropical tropopause, J. Geophys. Res, 111, D05106, doi: 10.1029/2005JD006480. [DOI] [Google Scholar]
- Pan LL, Bowman KP, Shapiro M, Randel WJ, Gao R-S, Campos T, Davis C, Schauffler S, Ridley BA, Wei JC, and Barnet C (2007), Chemical behavior of the tropopause observed during the Stratosphere-Troposphere Analyses of Regional Transport (START) experiment, J. Geophys. Res, 112, D18110, doi: 10.1029/2007JD008645. [DOI] [Google Scholar]
- Pan LL, Bowman KP, Atlas EL, Wofsy SC, Zhang F, Bresch JF, Ridley BA, Pittman JV, Homeyer CR, Romashkin P, and Cooper WA (2010), The Stratosphere-Troposphere Analyses of Regional Transport 2008 (START08) Experiment, Bull. Amer. Meteor. Soc, 91, 327–342. [Google Scholar]
- Pittman JV, Pan LL, Wei JC, Irion FW, Liu X, Maddy ES, Barnet CD, Chance K, and Gao R-S (2009), Evaluation of AIRS, IASI, and OMI ozone profile retrievals in the extratropical tropopause region using in situ aircraft measurements, J. Geophys. Res, 114, D24109, doi: 10.1029/2009JD012493. [DOI] [Google Scholar]
- Putman WM and Lin S-J (2007), Finite-volume transport on various cubed-sphere grids, Journal of Computational Physics, 227, 55–78, doi: 10.1016/j.jcp.2007.07.022. [DOI] [Google Scholar]
- Reed RJ (1955), A study of a characteristic type of upper-level frontogenesis, J. Meteorol, 12, 542–552. [Google Scholar]
- Rienecker MM, Suarez MJ, Todling R, Bacmeister J, Takacs L, Liu H-C, Gu W, Sienkiewicz M, Koster RD, Gelaro R, Stajner I, and Nielsen JE, The GEOS-5 Data Assimilation System - Documentation of Versions 5.0.1, 5.1.0, and 5.2.0. Technical Report Series on Global Modeling and Data Assimilation, Vol. 27, 1–118 pp. 2008. [Google Scholar]
- Rienecker MM, Suarez MJ, Gelaro R, Todling R, Bacmeister J, Liu E, Bosilovich MG, Schubert SD, Takacs L, Kim G-K, Bloom S, Chen J, Collins D, Conaty A, da Silva A, et al. (2011), MERRA - NASA’s Modern-Era Retrospective Analysis for Research and Applications, J. Climate, 24, 3624–3648, doi: 10.1175/JCLI-D-11-00015.1. [DOI] [PMC free article] [PubMed] [Google Scholar]
- Roelofs GJ, et al. (2003), Intercomparison of tropospheric ozone models: Ozone transport in a complex tropopause folding event, J. Geophys. Res, 108, 8529, doi: 10.1029/2003JD003462, D12. [DOI] [Google Scholar]
- Ruzmaikin A, Aumann HH, and Manning EM (2014), Relative Humidity in the Troposphere with AIRS, J. Atmos. Sci, 71, 2516–2533. doi: 10.1175/JAS-D-13-0363.1 [DOI] [Google Scholar]
- Shapiro MA, and Keyser DA (1990), Fronts, jet streams and the tropopause, in Extratropical Cyclones: The Erik Palmen Memorial Volume, edited by Newton CW and Holopainen EO, pp. 167–191, Am. Meteorol. Soc., Boston, Mass. [Google Scholar]
- Škerlak B, Sprenger M, and Wernli H (2014), A global climatology of stratosphere–troposphere exchange using the ERA-Interim data set from 1979 to 2011, Atmos. Chem. Phys, 14, 913–937, doi: 10.5194/acp-14-913-2014. [DOI] [Google Scholar]
- Škerlak B, Sprenger M, Pfahl S, Tyrlis E, and Wernli H (2015), Tropopause folds in ERA-Interim: Global climatology and relation to extreme weather events, J. Geophys. Res, 120, 4860–4877. doi: 10.1002/2014JD022787. [DOI] [Google Scholar]
- Sprenger M, and Wernli H (2003), A northern hemispheric climatology of cross-tropopause exchange for the ERA15 time period (1979–1993), J. Geophys. Res, 108, doi: 10.1029/2002JD002636. [DOI] [Google Scholar]
- Stauffer RM, Thompson AM, Martins DK, et al. , Clark RD, Goldberg DL, Loughner CP, Delgado R, Dickerson RR, Stehr JW, and Tzortzious MA (2012), Bay breeze influence on surface ozone at Edgewood, MD during July 2011, J. Atmos. Chem, doi: 10.1007/s10874-012-9241-6. [DOI] [PMC free article] [PubMed] [Google Scholar]
- Stohl A, and Trickl T (1999), A textbook example of long-range transport: Simultaneous observation of ozone maxima of stratospheric and North American origin in the free troposphere over Europe, J. Geophys. Res, 104, 30,445–30,462. [Google Scholar]
- Stohl A, Spichtinger-Rakowsky N, Bonasoni P, Feldmann H, Memmesheimer M, Scheel HE, Trickl T, Hubener S, Ringer W, and Mandl M (2000), The influence of stratospheric intrusions on alpine ozone concentrations, Atmos. Environ, 34, 1323–1345. doi: 10.1016/S1352-2310(99)00320-9. [DOI] [Google Scholar]
- Sullivan JT, McGee TJ, Thompson AM, Pierce RB, Sumnicht GK, Twigg LW, Eloranta E, and Hoff RM (2015), Characterizing the lifetime and occurrence of stratospheric-tropospheric exchange events in the Rocky Mountain region usin high resolution ozone measurements, J. Geophys. Res, 120, 12410–12424, doi: 10.1002/2015JD023877. [DOI] [Google Scholar]
- Susskind J, Barnet C, Blaisdell J, Iredell L, Keita F, Kouvaris L, Molnar G, and Chahine M (2006), Accuracy of geophysical parameters derived from Atmospheric Infrared Sounder/Advanced Microwave Sounding Unit as a function of fractional cloud cover, J. Geophys. Res, 111, D09S17, doi: 10.1029/2005JD006272. [DOI] [Google Scholar]
- Susskind J, Blaisdell JM, Iredell L (2014), Improved methodology for surface and atmospheric soundings, error estimates, and quality control procedures: the atmospheric infrared sounder science team version-6 retrieval algorithm, J. Appl. Remote Sens, 8, doi: 10.1117/1.JRS.8.084994. [DOI] [Google Scholar]
- Tang Q and Prather MJ (2012), Five blind men and the elephant: what can the NASA Aura ozone measurements tell us about stratosphere-troposphere exchange?, Atmos. Chem. Phys, 12, 2357–2380, doi: 10.5194/acp-12-2357-2012. [DOI] [Google Scholar]
- Thompson AM, et al. (2007), Intercontinental Chemical Transport Experiment Ozonesonde Network Study (IONS) 2004: 2. Tropospheric ozone budgets and variability over northeastern North America, J. Geophys. Res., 112, D12S13, doi: 10.1029/2006JD007670. [DOI] [Google Scholar]
- Thompson AM, Stauffer RM, Miller SK, Martins DK, Joseph E, Weinheimer AJ, and Diskin GS (2014), Ozone profiles in the Baltimore-Washington region (2006–2011): satellite comparisons and DISCOVER-AQ observations, J. Atmos. Chem, doi: 10.1007/s10874-014-9283-z. [DOI] [PMC free article] [PubMed] [Google Scholar]
- Tilmes S, et al. (2010), An aircraft-based upper troposphere lower stratosphere O3, CO, and H2O climatology for the Northern Hemisphere, J. Geophys. Res, 115, D14303, doi: 10.1029/2009JD012731. [DOI] [Google Scholar]
- Trickl T, Feldmann H, Kanter H-J, Scheel H-E, Sprenger M, Stohl A, and Wernli H (2010), Forecasted deep stratospheric intrusions over Central Europe: case studies and climatologies, Atmos. Chem. Phys, 10, 499–524, doi: 10.5194/acp-10-499-2010. [DOI] [Google Scholar]
- Trickl T, Vogelmann H, Giehl H, Scheel H-E, Sprenger M, and Stohl A (2014), How stratospheric are deep stratospheric intrusions?, Atmos. Chem. Phys, 14, 9941–9961, doi: 10.5194/acp-14-9941-2014. [DOI] [Google Scholar]
- Viezee W, B Johnson W, and Singh HB (1983), Stratospheric ozone in the lower troposphere—II. Assessment of downward flux and ground-level impact. Atmos. Environ, 17, 1979–1993, doi: 10.1016/0004-6981(83)90354-2. [DOI] [Google Scholar]
- Wargan K, Pawson S, Olsen MA, Witte JC, Douglass AR, Ziemke JR, Strahan SE and Nielsen JE (2015), The global structure of upper troposphere-lower stratosphere ozone in GEOS-5: A multiyear assimilation of EOS Aura data. J. Geophys. Res. Atmos, 120, 2013–2036. doi: 10.1002/2014JD022493. [DOI] [Google Scholar]
- Waters JW, et al. (2006), The Earth Observing System Microwave Limb Sounder (EOS MLS) on the Aura satellite, IEEE Trans. Geosci. Remote Sens, 44, 1075–1092. [Google Scholar]
- Yates EL, Iraci LT, Roby MC, Pierce RB, Johnson MS, Reddy PJ, Tadić JM, Loewenstein M and Gore W (2013), Airborne observations and modeling of springtime stratosphere-to-troposphere transport over California, Atmos. Chem. Phys, 13, 12481–12494. [Google Scholar]
Associated Data
This section collects any data citations, data availability statements, or supplementary materials included in this article.


