I. Introduction
Over the past thirty years, the civil aeronautical community has actively pursued research to enable efficient and environmentally friendly arrival operations. One outcome of this research is a collection of new ground automation tools [1-3], developed to assist air traffic controllers (ATC) in managing traffic while maintaining safety. Another outcome is a set of Optimal Profile Descent (OPD) and Continuous Descent Arrival (CDA) procedures [4, 5], designed to reduce emissions and noise. Recent years have seen significant efforts to integrate these new tools and procedures to manage arrival flights even more efficiently [6, 7]. In one such research activity, each arrival flight is scheduled to pass certain points along a specific route defined from the transition airspace (i.e., en route airspace near the terminal area) all the way to the runway [8]. This approach was initially called precision scheduling [9] and, in later literature, renamed to precision operations [10]. With this approach, air traffic controllers would use speed clearances as the primary means of guiding flights, reserving vectoring clearances for exceptions only. Precision operations, with its speed control, is in contrast to the conventional approach, in which aircraft follow a routine of vectoring clearances from ATC upon entering the terminal airspace [10].
In the United States, the technology developed for achieving precision operations is the Terminal Sequencing and Spacing (TSAS) system [11, 12], tech-transferred from NASA to the Federal Aviation Administration (FAA) in 2015 and targeted for initial operating capability in 2018. TSAS requires a route-specific speed profile, referred to as nominal, as input for computation of each flight’s predicted nominal trajectory. (The nominal speed profile is explained in detail in Section II.) Note that a route may not be completely defined (i.e., arrival procedures not connected to approach procedures) by the time TSAS is implemented. In this case, TSAS models the route by resorting to controllers’ consistency in vectoring. The predicted nominal trajectories are used for ordering the aircraft at schedule points. Once the aircraft are ordered, TSAS computes for each flight a speed profile that would meet the schedule, perturbing the profile from the nominal one, if necessary, to meet separation restrictions at schedule points [13]. During times of light arrival traffic in which flights rarely violate separation restrictions at the schedule points, TSAS advises all flights on the same route to fly by the same nominal speed profile. During times of medium to heavy traffic in which aircraft separation restrictions cannot be met at the schedule points, TSAS issues a perturbed speed profile to many of the flights. The current scheme of TSAS’s speed perturbation considers only reduction of speed from the nominal speed profile. Nonetheless, perturbation that increases the speed from the nominal has been proposed [14].
The selection of a nominal speed profile is expected to impact the efficiency of the TSAS schedule because this profile serves as a reference speed strategy and, in actual operations, will be flown by many flights. A nominal speed profile is most cost-efficient for a flight if it coincides with that flight’s preferred speed profile. However, the preferred speed profile varies among airlines and aircraft types. Even flights from the same airline, with the same aircraft type, and on the same route can have different preferred speed profiles. The best that can be achieved by a nominal speed profile for TSAS is systemic efficiency; i.e., one that minimizes the total cost (cost to be defined in Section III A) of the arrival flights. Efficiency of a nominal speed profile for an individual flight, as defined specifically in terms of total cost, was not among the objects of study in the development of the TSAS system. (All the nominal speed profiles were validated for flyability only.) At the same time, the sensitivity of a speed profile’s cost efficiency to individual flights’ cost functions presents interest, because the degree of sensitivity tells how much consideration should be put into the selection of a nominal speed profile. This interest is the main motivation for this work.
The main contributions of this paper are two. The first is a general methodology for computing a cost-optimal speed profile (described in Sec. III B) using a high-fidelity aircraft fuel model. This profile is computed using the exact formula derived in [15]. The second is application of this methodology to an actual arrival route and its nominal speed profile, demonstrating sensitivity of the nominal speed profile’s cost efficiency to a flight’s cost function, parameterized by the aircraft type and the Cost Index [16]. This work aims to answer questions of the following kinds:
Given a flight’s cost function, how cost-efficient is a speed profile?
How does the cost efficiency of a speed profile vary with a flight’s cost parameters?
Although the application is to a specific route, the modeling methodology is applicable to any route that can be specified by waypoints, speed restrictions, and altitude restrictions (see Section II for more details).
The rest of the paper is organized as follows. The arrival route as well as its nominal speed profile to be examined are described in Section II. The general exact formula for a cost-optimal speed profile is given in Section III. The aircraft fuel model for computing fuel consumption is described in Section IV. The aforementioned sensitivity analysis of the nominal speed profile’s cost efficiency is carried out in Section V. Section V also compares a cost-optimal speed profile to a speed profile optimized by a flight simulator’s Flight Management System (FMS). Discussion of the results is given in Section VI.
II. The Nominal Speed Profile
A. Arrival Route
Precision operations [10] are based on specific arrival routes constructed from published procedures and, if necessary, a model of controllers’ vectoring patterns. The resulting route consists of a sequence of waypoints all the way to the runway. Altitude restrictions are imposed at certain waypoints to provide vertical separation for different traffic flows, keep specific arrival flows in the same controller’s sector, and account for terrain constraints [17]. Although the upper and lower bounds of an altitude restriction can be different to accommodate different aircraft types’ performance envelopes, ATC can rarely afford such flexibility in a congested terminal airspace with complex traffic flows. Therefore, altitude restrictions in the terminal airspace, and in some cases also the transition airspace, have either narrow windows or identical upper and lower bounds. When such altitude restrictions are closely spaced, arrival flights are observed to fly each descent segment by an approximately constant flight-path angle (FPA). An arrival route and its altitude restrictions are much constrained by considerations related to traffic flow, terrain, noise, and safety, and cannot be modified without considering the entire traffic pattern. Both the route and the altitude restrictions are fixed in this work. Only the speed profile is considered for optimization.
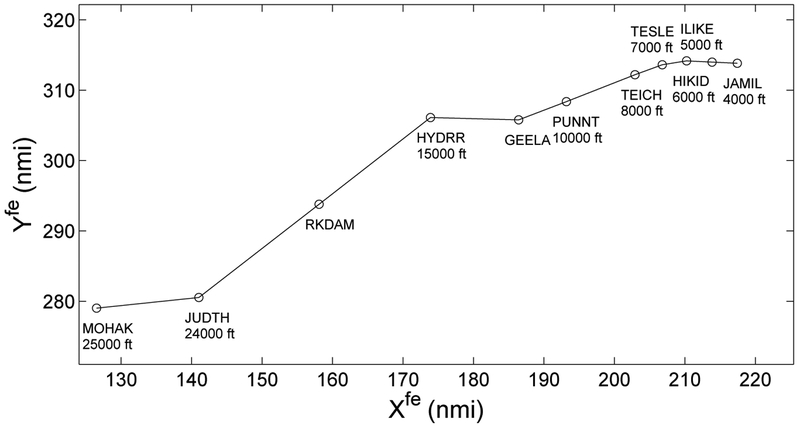
The arrival route analyzed in this study, named here the GEELA route, was part of an actual arrival procedure and has been previously used in Human-In-The-Loop (HITL) simulations for demonstrating the TSAS technologies [9]. Figure 1 shows the scale of this route as well as the altitude restrictions along the route, starting from waypoint MOHAK and ending at JAMIL, a waypoint 8 nmi to the west of the runway. The short route between JAMIL and the runway is not considered in this work because operational safety and noise considerations leave little room for speed optimization.
Fig. 1.
Part of the GEELA arrival route to the Phoenix Airport.
Table 1 specifies the speed restrictions along the GEELA route [18]; the speeds shown are the calibrated airspeeds (CAS). The path distance column in Table 1 estimates each waypoint’s flight path distance from the end waypoint JAMIL, with a reference of 0 at the end of route and a negative sign to keep the path distance increasing along the route.
Table 1.
Speed restrictions along the GEELA route
| Waypoint | Speed (CAS knots) |
Path Distance (nmi) |
|---|---|---|
| MOHAK | 280 | −101 |
| RKDAM | 280 | −67 |
| HYDRR | 265 | −44 |
| GEELA | 250 | −31 |
| PUNNT | 230 | −24 |
| TEICH | 210 | −14 |
| ILIKE | 180 | −4 |
| JAMIL | 180 | 0 |
TSAS constructs a nominal speed profile from speed restrictions by assuming the aircraft slows down just in time to meet the speed restriction. This assumption derives from observation of a flight simulator’s speed profile, which is to be described in Section IIB.
Although this study analyzes only a specific arrival route, the methodology presented here is generally applicable to routes described by waypoints. These waypoints may be optionally furnished with restrictions of altitude and speed. By assuming realistic turn radii, these altitude and speed parameters can be fit with a 3-D curve, and its 2-D projection onto the approximately flat earth is parameterized by a variable called the path distance. The control problem is solved for the path distance and speed as functions of time (see Section III for more details).
B. Simulated Flight
The Aircraft Simulation for Traffic Operations Research (ASTOR) is a desktop-based aircraft simulator developed to support research of air traffic operations within future airspace environments (19, 20]. It has been used extensively in HITL simulations (12, 21, 22] and is capable of simulating realistic aircraft flight physics, pilot interface, automation, and communication infrastructures. ASTOR has high-fidelity components of aircraft performance, FMS, and autopilot.
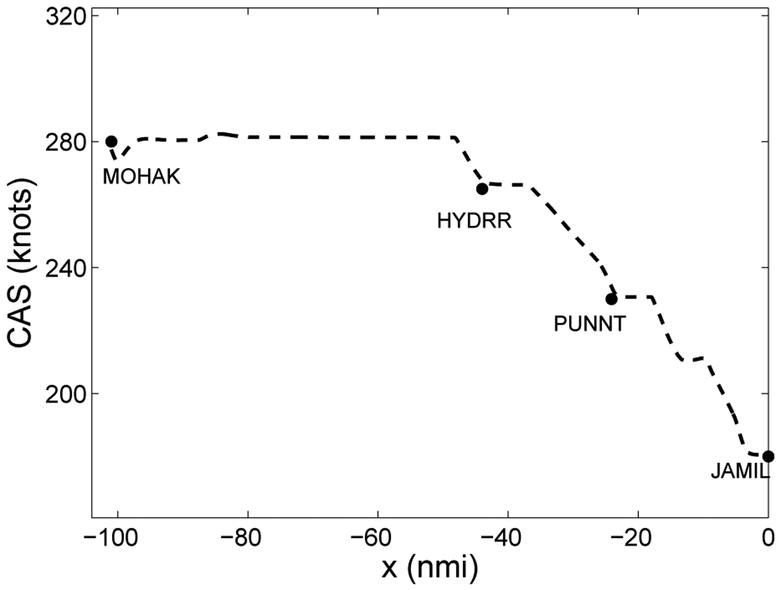
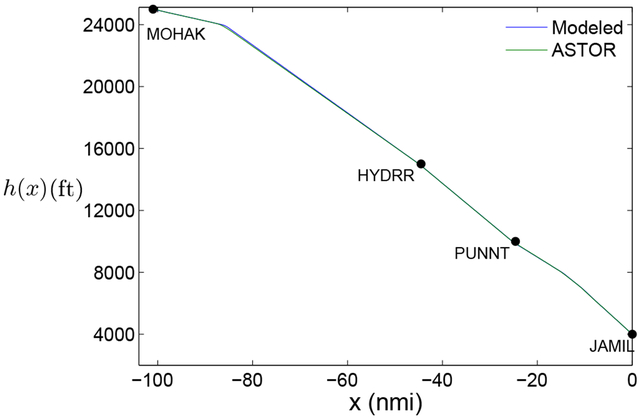
The nominal speed profile for the GEELA route was derived from an ASTOR simulation of a flight under standard atmospheric conditions and without winds. The aircraft type was set to Boeing 757-200. Altitude restrictions shown in Figure 1 and speed restrictions in Table 1 are applied to this flight. Figure 2 shows the speed profile that resulted when ASTOR simulated a flight that attempts to follow the nominal speed profile. The resulting speed profile is plotted in the Figure as a function of the coordinate x which represents the path distance along the route. The value of x = −101 nmi corresponds to MOHAK; the value of x = 0 nmi, to JAMIL. The simulated flight started before MOHAK and ended beyond JAMIL. The decrease in speed near MOHAK was likely due to an overshoot of the deceleration before MOHAK from 290 knots CAS. In the following Section, this computed nominal speed profile is used to model that of Boeing 737-800 as well, ignoring slight variation of the deceleration segments across aircraft types. Figure 3 shows the altitude profile of the ASTOR flight (the modeled altitude profile for the GEELA route is to be described in Section V A). The closeness of the two altitude profiles (less than 100 ft apart anywhere) is important for the validity of the comparison work to be described in Section V B.
Fig. 2.
The nominal speed profile.
Fig. 3.
The flown ASTOR altitude profile and the modeled altitude profile.
The cost efficiency of the nominal speed profile is examined below for both B757-200 and B737-800 aircraft types and for a range of airlines’ business objectives, parameterized by the ratio of a flight’s fuel and operating time costs.
III. Cost-Optimal Speed Profile
A. Model Formulation
The cost-optimal speed profile defined here minimizes a modeled cost function, chosen for this work as the direct operating cost J (referred to simply as cost for the rest of the paper) of the trajectory. The cost J is the integral of a sum of two terms, corresponding to fuel consumption and flight duration, respectively:
| (1) |
Here r is related to the Cost Index [16] by a unit conversion factor, and the fuel consumption rate is modeled by this formula,
| (2) |
where both cf and f0 are functions of aircraft altitude and speed.
Trajectories that minimize fuel or various forms of cost have received much attention in the literature, which is briefly reviewed in this paragraph. A fairly comprehensive review of fuel- and cost-optimal trajectories can be found in [23]. Early work considered optimization of trajectories in climb, cruise, and descent phases combined [24-27]. Such analysis can be formulated as a multi-phase optimization problem [28]. Some recent work analyzed descent only or cruise/descent trajectories [29-31] and investigated trade-offs between fuel consumption and flight time [32]. The optimal descent trajectory obtained from these efforts typically uses idle thrust engine control. However, none of these works consider altitude restrictions common in a congested terminal airspace. There is no guarantee such an optimal trajectory would meet the altitude restrictions and, in trajectory-based operations, may not be executable as is.
The approach in this work incorporates altitude restrictions in the model and explores speed profile optimization within these restrictions. This work models an arrival route with a constrained altitude profile as a continuous curve in 3-dimensional airspace. (The method used here for constructing such an altitude profile from altitude restrictions is described in the second paragraph of Section V A.) The curve is parameterized by the aircraft’s path distance coordinate, denoted by x, along its ground path. It follows that the altitude h and air density ρ can be written as functions of x:
and therefore the tangent of the inertial FPA γi is given by
The last equation is based on the sign convention that γi is negative for descent.
The wind along the route is assumed to be a function of x, i.e., w = w(x), but not of time. This is a good assumption if the duration of the flight segment considered is short. Crosswinds affect the aircraft’s dynamics to a much lesser extent [33] than do along-track winds, hence are neglected in this model. Vertical winds are usually of smaller magnitudes than are head and tail winds, hence are also neglected.
In the following state equations,
| (3a) |
| (3b) |
the right-hand side of Eq. (3b) includes the thrust, drag, gravity, and the inertial force that results from the wind. The angles γa and γi are related by
| (4) |
The aircraft’s total engine thrust is bounded by the engine’s performance envelope,
| (5) |
The optimal control problem for the cost-optimal speed profile is defined by state variables x and V, control variable T, state equations in Eqs. (3), cost functional in (1), fuel rate in (2), initial time t = 0, final time tf free, boundary conditions
| (6) |
and control constraints by Eq. (5). For a cost-optimal speed profile to be feasible operationally, speed constraints may need to be imposed. One operational constraint imposed here is the FAA’s speed restriction to keep the flight at or below 250 knots when at altitude 10,000 ft or below. Another constraint to consider is that the aircraft’s speed in CAS should not increase in the terminal area. That constraint is not included in the model because it turns out to be inactive in the terminal area for the parameters considered (assuming terminal area includes the part of route below 10,000 ft).
B. Solution
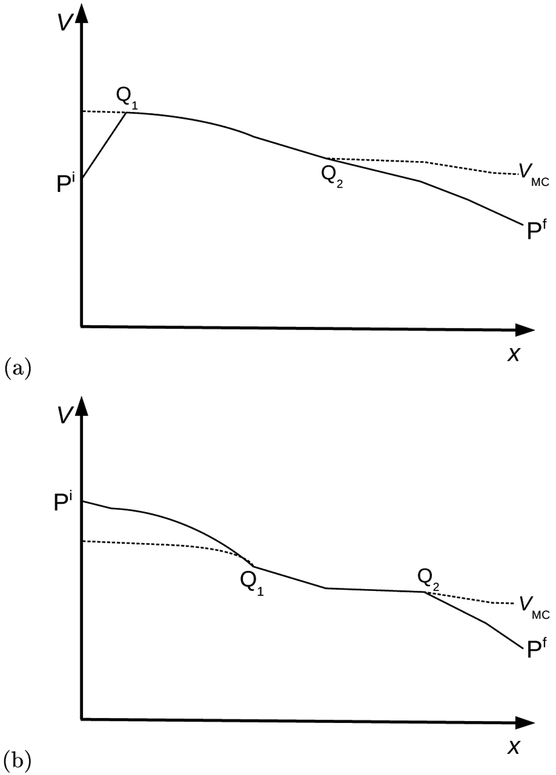
The optimal control problem described above has been solved analytically using Green’s Theorem and observations of a typical aircraft’s drag polar [15]. In the solution, the aircraft aims to reach and keep a preferred speed, called the minimum-cost speed and denoted by Vmc(x). In terms of the Hamiltonian formalism of optimal control theory, the minimum-cost speed curve is a singular arc [34]. A typical cost-optimal speed profile starts from its initial speed and gets to Vmc(x) as quickly as possible using an appropriate extremal value of thrust. It then stays on Vmc(x) as long as possible, until it has to leave to reach the final speed.
Figure 4 sketches typical cost-optimal speed profiles V(x). Such a profile consists of three segments. In Figure 4(a), the aircraft flies from its initial state, Pi = (xi, Vi), to state Q1 using a thrust of Tmax. It stays on the Vmc curve (shown dashed) from Q1 to Q2, using a non-extremal thrust. It then leaves the curve and arrives at the final state, Pf = (xf, Vf), using idle thrust. Similarly, in Figure 4(b), the aircraft flies from its initial state, Pi, to state Q1 using idle thrust. It stays on the Vmc curve (dashed line) from state Q1 to state Q2, using a non-extremal thrust. It then leaves the curve and arrives at the final state, Pf, using idle thrust.
Fig. 4.
Notional sketch of a cost-optimal speed profile, V = V(x), in a bold curve. The plot of Vmc(x) is shown dashed. Note that Vi > Vmc(xi) in (a) and Vi < Vmc(xi) in (b).
The minimum-cost speed Vmc is the solution to
| (7) |
Here
| (8) |
and and are defined by the following equations,
| (9) |
and
| (10) |
Eq. (7) is solved numerically for values of x to get Vmc. In the special case of a level flight with r = 0 and a constant cf, the function Vmc(x) becomes identical with the definition of the best range speed [33].
Speed restrictions may prevent the cost-optimal speed profile from staying on Vmc(x). The FAA’s speed restriction to keep the flight at or below 250 knots CAS when at altitude 10,000 ft or below is applied. The restriction was applied in the following two steps: (i) solve for the cost-optimal speed profile without imposing the speed restriction, and (ii) check whether the computed solution violates the restriction. If it does, then replace the problem by a two-stage control problem [34], with the stages separated by the smallest (earliest) value of x at which the altitude h(x) reaches 10,000 ft. Stage 1 is solved using a final speed of 250 knots CAS, and stage 2 is solved using an initial speed of 250 knots CAS. The Vmc(x) is replaced by 250 knots CAS for the portion of x where Vmc(x) is greater than 250 knots CAS.
If the flight-path angle changes rapidly, Vmc may change rapidly too. As a result, the thrust required to follow Vmc can fall outside bounds (5). This transient segment is usually short. In this case, the state (x, V) of the aircraft leaves Vmc momentarily with an extremal thrust and returns to Vmc. The exact beginning point of this transient segment is sought numerically within a short segment of x [15].
IV. Fuel Model
The computation of fuel in this work is based on a high-fidelity aircraft fuel model of B757-200 and B737-800 as part of the Center-TRACON Automation System (CTAS) [35]. CTAS describes fuel rates with look-up tables. Values in these tables are approximated by fitting the coefficients cf and f0 in Eq. (2). The slight variation of cf with thrust is neglected. These approximations are estimated to affect the fuel consumption by less than 3% for a descent trajectory.
While CTAS’s clean configuration fuel models are high-fidelity, CTAS does not have a high-fidelity flap model. An accurate flap model tends to make Vmc change abruptly at the speeds when flaps are deployed. In this work, flaps were treated approximately by extending the clean configuration’s drag polar below the minimum-drag speed. This approximation is a continuous function and tends to underestimate the drag and hence the fuel rate, but should affect only the last 10 nmi of the trajectory, where the flexibility of selecting the speeds diminishes.
It will be shown in Section V E that the idle-thrust fuel rate, f0, contributes a significant percentage of the fuel consumption for a descending aircraft. That is, segments flown by idle thrust consume a percentage of the total fuel that is far from negligible. A nonzero value of f0 captures the real fuel rate better than the zero fuel rate assumption for idle thrust descent (minimum-thrust) made in numerous previous works [25, 28].
The optimal speed profile was computed using MATLAB [36] code. The computation involves the Vmc curve, forward integration from the initial state to the Vmc curve, and backward integration from the final state to the Vmc curve. With minimum attempt to optimize the performance of the code, each speed profile took about 5 minutes to complete. Additional computational details can be found in [15].
V. Results
A. Route, Altitude, and Air Density
The ground path of the route is modeled as a sequence of linear segments, pairwise connected by circular arcs, which correspond to turns. Turns are modeled with a 5 nmi turn radius each, a choice found to match closely those observed in the ASTOR trajectories. This assumption of speed-indepedent turn radii decouples the horizontal path from the speed. The total length of the GEELA route is about 101 nmi. Lift is assumed to be equal to the aircraft’s weight at all times. These approximations have been used by trajectory generators of ground automation systems [37].
Figure 3 shows the modeled altitude h(x) of the GEELA route. The altitude profile contains a sequence of fixed-FPA segments interconnected by transient segments that ensure continuity of the FPA. A fixed change rate of ±1° per nmi is used to model these transient segments, i.e.,
| (11) |
This change rate is derived from real flights’ track data. The difference between the modeled altitude and the ASTOR altitude is everywhere less than 150 ft.
The air density as a function of the altitude is computed using the standard atmospheric model. This density comes out 0.557 kg3/m at an altitude of 25,000 ft and 1.090 kg3/m at an altitude of 4000 ft.
Wind effects have been investigated previously [15] and are not considered here.
B. Sensitivity Analysis of Cost Efficiency
The sensitivity analysis of the nominal speed profile’s cost efficiency to aircraft type and the Cost Index. Two aircraft types, B757-200 and B737-800, are investigated and compared. Values of the Cost Index investigated, denoted as CI, range from 0 to 70 (($/hr)/(cents/lb)). Typical values of CI range are 15 to 50 for B757-200 and 5 to 25 for B737-800 [16]. The cost J is related to F and tf by integrating Eq. (1):
| (12) |
where J is in $, pf in lbs/$, F in lbs, and tf in seconds. The fuel price pf for computing the cost is set to 0.45 $/lb.
Table 2 juxtaposes the CTAS-estimated fuel consumption and flight time for the nominal speed profile for B757-200 and for B737-800. To illustrate variation of costs with CI, the cost of the nominal speed profile, Jnominal, at three distinct values of CI are computed from Eq. (12) and shown.
Table 2.
Fuel consumption, time, and cost of the nominal speed profile
| Type | Fuel (lbs) |
Time (sec) |
Jnominal(CI=10) ($) |
Jnominal(CI=40) ($) |
Jnominal(CI=70) ($) |
|---|---|---|---|---|---|
| B757-200 | 1002 | 1150 | 595 | 1026 | 1457 |
| B737-800 | 901 | 549 | 980 | 1412 |
Cost efficiency is measured as the cost difference between the nominal speed profile and the cost-optimal one,
| (13) |
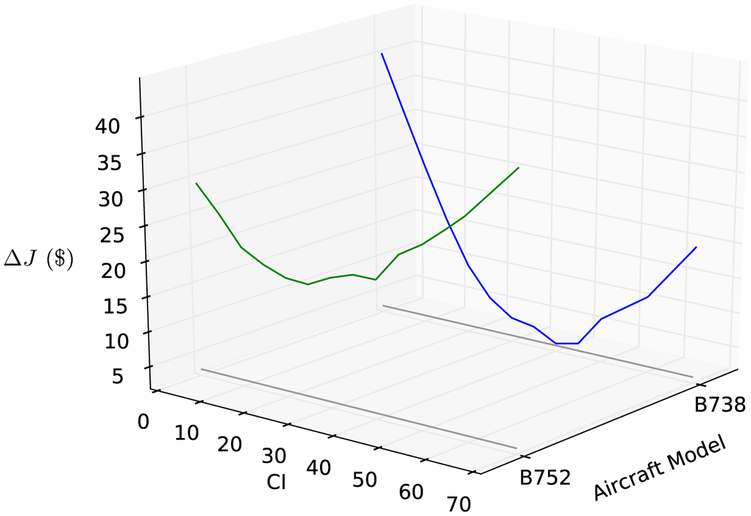
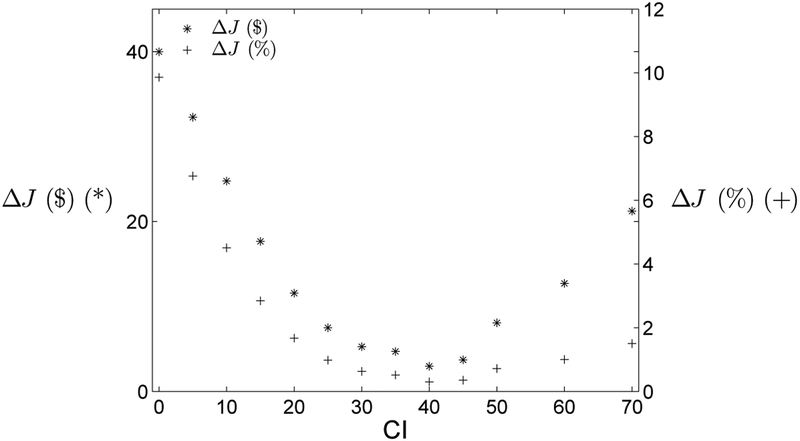
where smaller ΔJ indicates better cost efficiency. Figure 5 gives an overview of the computed ΔJ ($) as a function of the test matrix parameters, aircraft type and CI. The following Sections will offer a closer examination of the results of ΔJ.
Fig. 5.
Test matrix for the sensitivity analysis.
C. B757-200
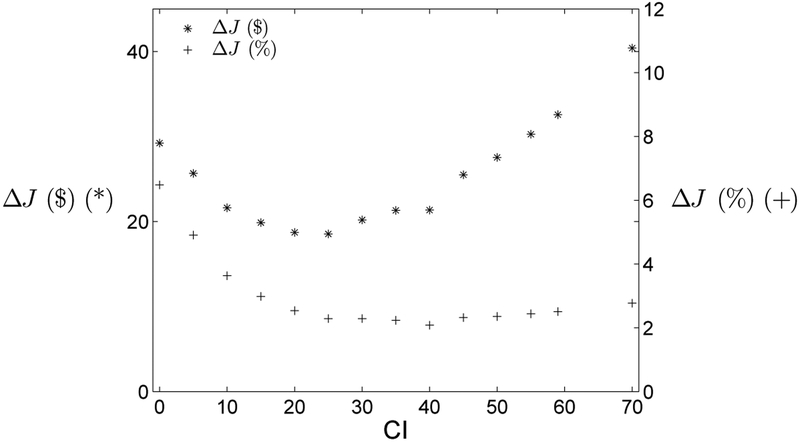
Figure 6 shows a plot of ΔJ against CI for B757-200. With CI varying from 0 to 70, ΔJ varies between $18 and $41, reaching the minimum at CI=25 and maximum at CI=70. Figure 6 also shows ΔJ as a percentage of Jnominal, denoted as ΔJ (%). ΔJ (%) varies from 7% for CI=0 to 2%-3% of Jnominal for CI values between 15 and 70.
Fig. 6.
Cost efficiency for B757-200.
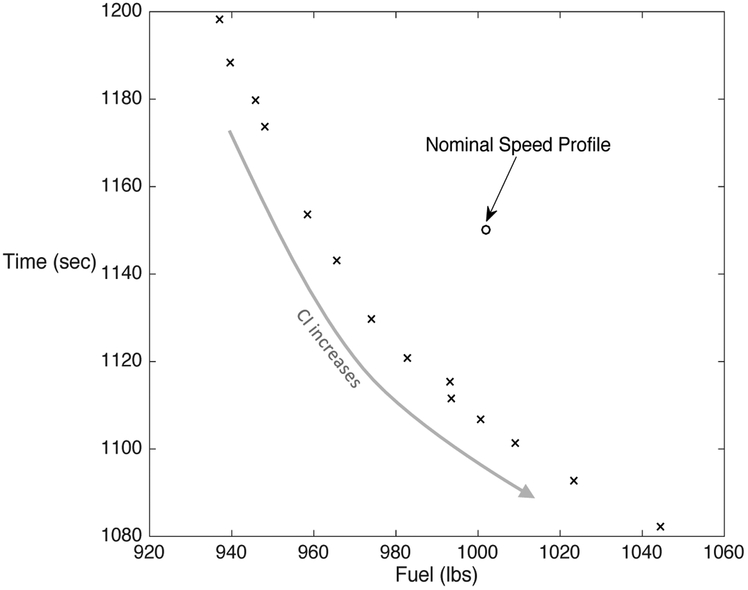
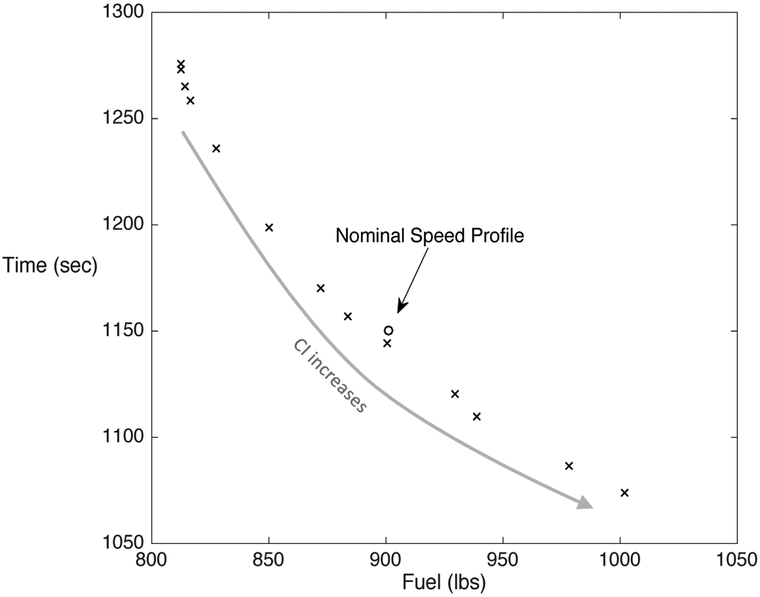
Figure 7 is a scatter plot of the data points of format (total fuel consumption, total flight time) for: (i) the nominal speed profile, and (ii) each of a number of cost-optimal speed profiles corresponding to different values of the Cost Index. The points in the top left portion of the plot correspond to low CI profiles: the points in the bottom right portion, to the high CI profiles.
Fig. 7.
Fuel and time of the cost-optimal speed profiles for B757-200.
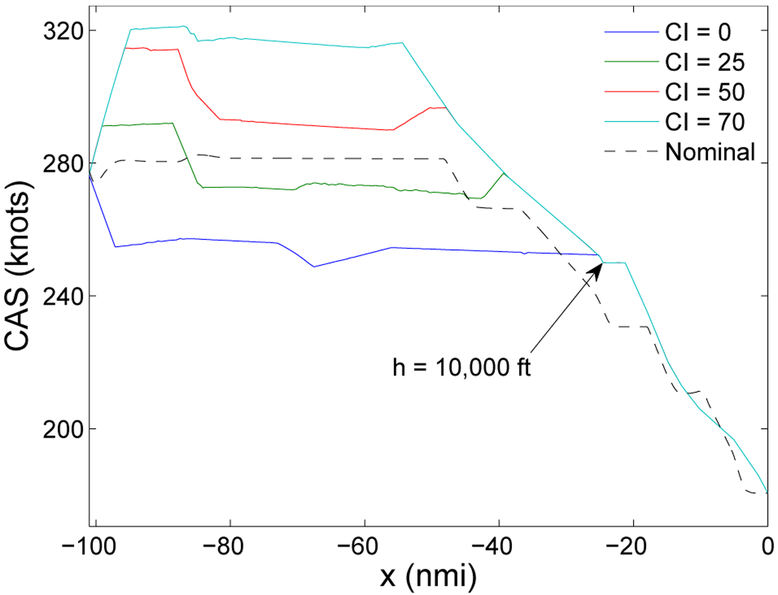
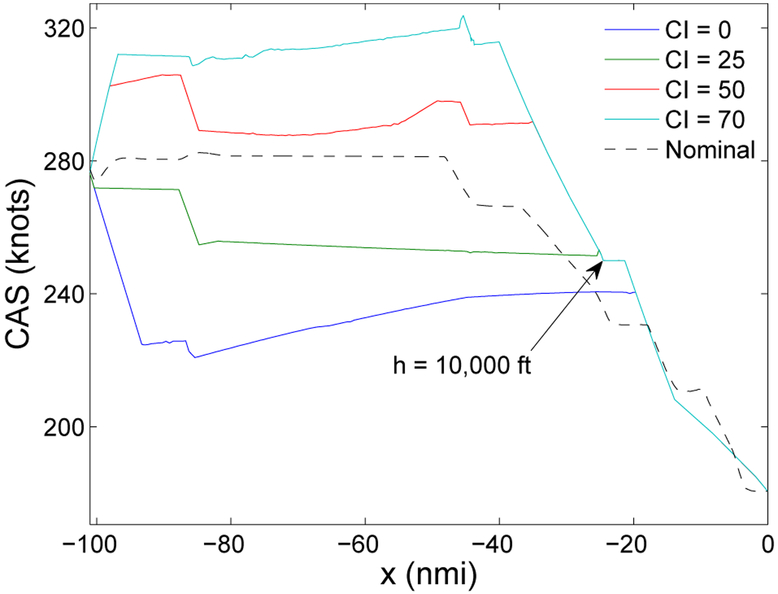
For a pointwise (at each value of x) comparison between cost-optimal speed profiles corresponding to four different values of CI and the nominal one, all plotted as CAS vs x, see Figure 8. The speed profiles become identical slightly before the aircraft descends to 10,000 ft. The equality of the speed profiles results from the optimal control becoming and remaining idle-thrust (this follows from the model), which in this case happens slightly above 10,000 ft.
Fig. 8.
Selected cost-optimal speed profiles for B757-200.
D. B737-800
Figure 9 shows a plot of ΔJ against CI for B737-800. With CI near 40, the nominal speed profile gets within $3 of the optimal cost. The range of ΔJ is $3-$40 for B737-800, varying more than $18-$41 of ΔJ for B757-200. In terms of ΔJ (%), the cost-optimal speed profile reduces less than 2% of Jnominal for CI≥20. For smaller CI values, the reduction percentage quickly increases and reaches 10% at CI=0.
Fig. 9.
Cost efficiency for B737-800.
The data points of format (total fuel burn, total flight time) for B737-800, plotted in Figure 10 (analogous to Figure 7 for B757-200), show that the data point corresponding to the nominal speed profile appears to lie near the envelope of the data points corresponding to the cost-optimal speed profiles obtained by varying CI.
Fig. 10.
Fuel and time of the cost-optimal speed profiles for B737-800.
For a pointwise (at each value of x) comparison between cost-optimal speed profiles corresponding to four CI values and the nominal one, all plotted as CAS vs x, see Figure 11. Compared to the results of B757-200 in Figure 8, the cost-optimal speed profiles for B737-800 are more sensitive to CI, ranging from 220 knots at some part of the CI = 0 profile to 320 knots at some part of the CI = 70 profile. The speed profiles become identical after the aircraft descends to approximately 9,000 ft, in contrast to the case of B757-200.
Fig. 11.
Selected cost-optimal speed profiles for B737-800.
E. Flight Management System Computed Speed Profile for B757-200
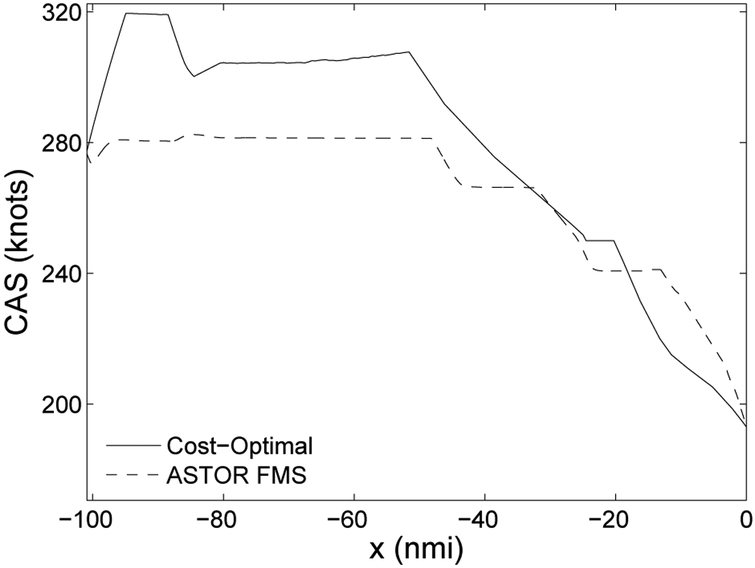
In addition to the sensitivity analysis above, an FMS-optimized speed profile is compared to the corresponding cost-optimal speed profile for its cost efficiency. The FMS speed profile is constructed from ASTOR without waypoint-specific speed restrictions. ASTOR, however, imposed a hard-coded speed restriction of 240 knots restriction at or below 10,000 ft. A value of 59 for the Cost Index is applied to select the descent speeds in the ASTOR’s FMS. The aircraft type is B757-800. A corresponding cost-optimal speed profile is computed using the same Cost Index of 59. Figure 12 shows the speed profiles of both. The authors could not conclusively determine why the FMS speed profile appears to follow another speed restriction of 265 knots at x ~ 65, which corresponds to the waypoint HYDRR (see Table 1).
Fig. 12.
Comparison of an FMS-computed speed profile to a cost-optimal speed profile (B757-200, CI=59).
Table 3 juxtaposes the fuel consumption, flight time, and cost resulting from the cost-optimal and the ASTOR FMS speed profiles. The FMS speed profile consumes less fuel but spends more flight time, resulting in a cost within $5 of the optimal cost. Table 3 also gives the “Idle Fuel” of 333 lb, the fuel consumption of the idle-thrust segment in the last 20 nmi. It turns out that the idle fuel takes up more than 30% of the total fuel. This is in contrast to the assumption of zero fuel consumption during an idle-thrust segment, a common assumption made in numerous previous works [25, 28]. Such an assumption can lead to noticeable errors in the computation of cost-optimal trajectories.
Table 3.
Fuel and time of the speed profiles (B757-200, CI=59)
| Trajectory | Fuel (lb) |
Time (sec) |
Cost ($) |
Idle Fuel (lb) |
|---|---|---|---|---|
| Cost-Optimal | 1014 | 1082 | 1254 | 333 |
| ASTOR FMS | 979 | 1110 | 1259 |
VI. Discussion
A. Sensitivity of Cost Efficiency
For the range of CI studied, the cost-optimal speed profile reduces up to $41 and $40 of the nominal speed profile’s cost for B757-200 and B737-800, respectively. The maximum reduction of J ($) occurs at CI=70 for B757-200 and CI=0 for B737-800. Variation of ΔJ (%) across values of CI is mild (2%-7% for B757-200 and 0%-10% for B737-800), indicating that cost efficiency of the nonimal speed profile is fairly insensitive to the Cost Index.
B. Cost Efficiency with Speed Brakes
The cost of the nominal speed profile for B737-800 gets very close to that of the corresponding cost-optimal speed profile, in particular, $3 at CI=40. The achievement of such apparent near-optimality is likely a result of an additional control parameter, the speed brakes, feasible for flying the nominal and FMS speed profiles, but not included in the model for computing the cost-optimal speed profile. CTAS thrust and drag calculations show that, for keeping a B737-800 on the CAS deceleration speed and altitude profiles simultaneously, negative thrust is required. Negative thrust corresponds to the use of speed brakes, considered undesirable by many pilots, but common in arrival operations. Although speed brakes cause additional noise and vibrations, proper use of speed brakes can improve cost efficiency by attaining a favorable speed sooner. On the other hand, the computation of a cost-optimal speed profile in this work does not assume non-negative thrust defined in Eq. (5). Therefore, solutions that further reduce the cost via speed brake are not explored. A possible direction for future research would be to investigate additional gain of cost efficiency that can be achieved by extending the solution space to include speed brake usage.
C. Systemic Cost Optimality
ATC’s approach to managing arrival traffic will shift from routine vectoring to precision operations in upcoming years. STM Under precision operations, each arrival flight follows a specific route all the way to a runway with a speed profile issued by ATC clearances. This approach motivates a possible class of realistic optimization problems for finding cost-efficient speed profiles.
For a convenient view of these optimization problems, consider for the moment the following two hypothetical approaches to selecting speed profiles:
each aircraft is assigned a speed profile customized to that aircrafts’ and airlines’ parameters and preferences;
all aircraft on the same route are to follow the same speed profile.
The first of these, highly idealized, would achieve the minimal cost possible for the entire set of aircraft, but appears operationally infeasible. This is because, for instance, allowing each aircraft its preferred speed profile would make it difficult for ATC to maintain the required separation between pairs of flights, even in an arrival operation with relatively few flights. The second approach, less cost-optimal systematically than the first, mitigates ATC’s burden in ordering and spacing aircraft, but can still lead to loss of separation near points where two routes merge. Nonetheless, it serves as the basis for the operationally feasible compromise achieved by TSAS: to start with a single nominal speed profile for all aircraft and then modify it for each aircraft as necessary to achieve the required separation. The speed modification may either increase or decrease the cost efficiency of a flight.
For multi-aircraft arrival operations, one can pursue an optimization problem of finding a nominal speed profile for all arrival flights on the same route, over a period of time, so as to minimize the systemic cost. Anticipated traffic scenarios as well as TSAS’s speed modification logic affect the outcome of such optimization. This problem and an extended problem for arrival operations with multiple arrival routes converging to the same runway (where one would seek a nominal speed profile for each route), appear good directions for future research.
VII. Conclusions
This study evaluates the cost efficiency of an aircraft arrival speed profile by comparing it to an exactly computed cost-optimal speed profile. The cost of flying a speed profile is modeled as a simple direct operating cost. The computation is performed for an actual route with altitude restrictions along the route. A high-fidelity fuel model for two Boeing aircraft types, B757-200 and B737-800, is used in fuel computation. The results of a sensitivity analysis in Section V show the nominal speed profile is fairly cost-efficient for both aircraft types with Cost Index values between 0 and 70. The cost-optimal speed profile reduces by 2%-7% of the nominal speed profile’s cost for B757-200 and by 0%-10% for B737-800. This indcates that the speed profile’s cost efficiency is fairly insensitive to the Cost Index, especially for B757-200. The near-optimality for B737-800 is likely due to the use of speed brakes, a control parameter not considered in the solution to the cost-optimal speed profile. Comparison of a speed profile optimized by a Flight Management System (FMS) to a corresponding cost-optimal speed profile for a specific Cost Index of 59 show that the FMS speed profile is within $5 of the optimal cost and, therefore, is fairly cost-optimal. The methodology presented here can be used for assessing the design of a speed profile for an arrival route, the efficency of which is expected to add benefits to managing arrival traffic with tools such as the Terminal Sequencing and Spacing (TSAS) system.
Nomenclature
- CI
Cost Index
- D
drag
effective drag per unit mass
- F
total fuel consumption
- J
direct operating cost
- Jnominal
direct operating cost of flying a nominal speed profile
- Joptimal
direct operating cost of flying a cost-optimal speed profile
- ΔJ
cost efficiency, Jnominal − Joptimal
- ΔJ (%)
ΔJ as a percentage of Jnominal
- L
aircraft’s lift
- P
aircraft state as a function of path distance coordinate and true airspeed
- Pf
final aircraft state
- Pi
initial aircraft state
- R
effective cost per unit distance per unit mass
- T
thrust
- Tmax
maximum thrust
- V
true airspeed
true airspeed change rate
- Vf
final true airspeed
- Vi
initial true airspeed
- Vmc
minimum-cost speed
- W
aircraft’s weight
- Xfe
flat-earth coordinate along a constant latitude
- Yfe
flat-earth coordinate along a constant longitude
- cf
thrust-specific fuel consumption
- f0
fuel consumption rate at minimum thrust (idle thrust)
- f(t)
fuel consumption rate
- g
gravity of earth
- h
aircraft’s altitude
aircraft’s altitude rate
- pf
fuel price
- r
ratio of time cost and fuel cost
ratio of time cost and fuel cost per unit mass per unit fuel price
- t
time
- tf
final time
- w
wind along the route (positive for tail wind)
- x
path distance coordinate
path distance rate
- xf
final ground path distance
- xi
initial ground path distance
- γa
aerodynamic flight-path angle
- γi
inertial flight-path angle
- ρ
air density
References
- [1].Coppenbarger RA, Nagle G, Sweet D, and Hayashi M, “The Efficient Descent Advisor: Technology Validation and Transition,” Proceedings of the AIAA Aircraft Technology, Integration, and Operations Conference, AIAA-2012-5611, Sept. 2012. doi: 10.2514/6.2012-5611 [DOI] [Google Scholar]
- [2].Oprins E, Zwaaf D, Eriksson F, van de Merwe K, and Roe R, “Impact of Future Time-Based Operations on Situation Awareness of Air Traffic Controllers,” 8th USA/Europe Air Traffic Management R&D Seminar, 2009. [Google Scholar]
- [3].Swenson HN, Hoang T, Engelland S, Vincent D, Sanders T, Sanford B, and Heere K, “Design and Operational Evaluation of the Traffic Management Advisor at the Fort Worth Air Route Traffic Control Center,” Proceedings of the 1st USA/Europe Air Traffic Management R&D Seminar, June 1997. [Google Scholar]
- [4].Clarke J-P, Brooks J, Nagle G, Scacchioli A, White W, and Liu S, “Optimized Profile Descent Arrivals at Los Angeles International Airport,” Journal of Aircraft, Vol. 50, No. 2, 2013, pp. 360–369. doi: 10.2514/1.C031529 [DOI] [Google Scholar]
- [5].Novak D, Bucak T, and Radišić T, “Development, Design and Flight Test Evaluation of Continuous Descent Approach Procedure in FIR Zagreb,” PROMET - Traffic & Transportation, Vol. 21, No. 5, Sept. 2009, pp. 319–329. doi: 10.7307/ptt.v21i5.247 [DOI] [Google Scholar]
- [6].Swenson H, Robinson III JE, et al. , “NASA’s ATM Technology Demonstration–1: Moving NextGen Arrival Concepts from the Laboratory to the Operational NAS,” Journal of Air Traffic Control, Vol. 55, No. 2, 2013. [Google Scholar]
- [7].Hasevoets N and Conroy P, “AMAN Status Review 2010,” Eurocontrol, Edition number 0.1, Vol. 17, 2010, https://www.eurocontrol.int/sites/default/files/article/content/documents/nm/fasti-aman-status-review-2010.pdf. [Google Scholar]
- [8].United States Standard for Required Navigation Performance (RNP) Approach Procedures with Special Aircraft and Aircrew Authorization Required (SAAAR), Order 8260.52, Federal Aviation Administration (FAA), June 2005, https://www.faa.gov/documentLibrary/media/Order/ND/8260_52.pdf. [Google Scholar]
- [9].Thipphavong J, Martin L, Swenson H, Lin P, and Nguyen J, “Evaluation of the Terminal Area Precision Scheduling and Spacing System for Near-Term NAS Application,” 4th International Conference on Applied Human Factors and Ergonomics (AHFE), 2012. [Google Scholar]
- [10].Isaacson DR, Sadovsky AV, and Davis D, “Tactical Scheduling for Precision Air Traffic Operations: Past Research and Current Problems,” Journal of Aerospace Information Systems, Vol. 11, 2014, pp. 234–257. doi: 10.2514/1.I010119 [DOI] [Google Scholar]
- [11].Robinson JE, Thipphavong J, and Johnson WC, “Enabling Performance-Based Navigation Arrivals: Development and Simulation Testing of the Terminal Sequencing and Spacing System,” Air Traffic Control Quarterly, Vol. 23, No. 1, 2015, pp. 5–27. [Google Scholar]
- [12].Thipphavong J, Jung J, Swenson H, Martin L, Lin M, and Nguyen J, “Evaluation of the terminal sequencing and spacing system for performance-based navigation arrivals,” Digital Avionics Systems Conference (DASC), 2013 IEEE/AIAA 32nd, IEEE, 2013, pp. 1A2–1. doi: 10.1109/DASC.2013.6712503 [DOI] [Google Scholar]
- [13].Wong GL, The Dynamic Planner: the Sequencer, Scheduler, and Runway Allocator for Air Traffic Control Automation, NASA/TM-2000-209586, 2000. [Google Scholar]
- [14].Wu MG and Swenson HN, “Enhancing the Traffic Management Advisor’s Schedule by Time Advance,” AIAA Guidance, Navigation, and Control (GNC) Conference, Jan. 2015. doi: 10.2514/6.2015-1326 [DOI] [Google Scholar]
- [15].Wu MG and Sadovsky AM, “Minimum-Cost Aircraft Descent Trajectories with a Constrained Altitude Profile,” NASA/TM-2015-218734, April 2015. [Google Scholar]
- [16].Roberson B, Root R, and Adam D, “Fuel Conservation Strategies: Cost Index Explained,” Boeing Aero Quarterly, Vol. 2, No. 2007, 2007, pp. 26–45, http://www.boeing.com/commercial/aeromagazine/articles/qtr_02_10/pdfs/AERO_FuelConsSeries.pdf. [Google Scholar]
- [17].McElhatton J, Drew C, and Buchanan P, “Crossing-Restriction Altitude Deviations on SIDs and STARs,” NASA ASRS Directline, Vol. 10, December 1998, pp. 10–15. [Google Scholar]
- [18].https://flightaware.com/resources/airport/PHX/STAR/GEELA+SIX+(RNAV)/pdf, from which the speed restrictions are based on.
- [19].Liu D-J and Chung W, “ASTOR: An Avionics Concept Test Bed in a Distributed Networked Synthetic Airspace Environment,” AIAA Modeling and Simulation Technologies Conference and Exhibit, Aug. 2004. doi: 10.2514/6.2004-5259 [DOI] [Google Scholar]
- [20].Palmer M and Ballin M, “A High-Performance Simulated On-Board Avionics Architecture to Support Traffic Operations Research,” AIAA Modeling and Simulation Technologies Conference and Exhibit, Aug. 2003. doi: 10.2514/6.2003-5452 [DOI] [Google Scholar]
- [21].Satapathy G, Chen J, Tolani D, Sturdy JL, Henion JT, and Kubat G, “A Traffic Information Service-Broadcast Model for Mixed-Equipage Aircraft Simulation,” Integrated Communications Navigation and Surveillance Conference (ICNS), IEEE, 2010, pp. E3–1. doi: 10.1109/ICNSURV.2010.5503264 [DOI] [Google Scholar]
- [22].Barmore BE, Abbott TS, Capron WR, and Baxley BT, “Simulation Results for Airborne Precision Spacing along Continuous Descent Arrivals,” The 26th Congress of International Council of the Aeronautical Sciences (ICAS), Vol. 22, Sept. 2008, pp. 27. doi: 10.2514/6.2008-8931 [DOI] [Google Scholar]
- [23].Franco A and Rivas D, “Analysis of Optimal Aircraft Cruise with Fixed Arrival Time Including Wind Effects,” Aerospace Science and Technology, Vol. 32, No. 1, 2014, pp. 212–222. doi: 10.1016/j.ast.2013.10.005 [DOI] [Google Scholar]
- [24].Chakravarty A, “Four-Dimensional Fuel-Optimal Guidance in the Presence of Winds,” Journal of Guidance, Control, and Dynamics, Vol. 8, No. 1, 1985, pp. 16–22. doi: 10.2514/3.19929 [DOI] [Google Scholar]
- [25].Chakravarty A and Vagners J, “4-D Aircraft Flight Path Management in Real Time,” American Control Conference, 1983, IEEE, 1983, pp. 794–795. [Google Scholar]
- [26].Burrows JW, “Fuel-Optimal Aircraft Trajectories with Fixed Arrival Times,” Journal of Guidance, Control, and Dynamics, Vol. 6, No. 1, 1983, pp. 14–19. doi: 10.2514/3.19796 [DOI] [Google Scholar]
- [27].Erzberger H and Lee H, “Constrained Optimum Trajectories with Specified Range,” Journal of Guidance, Control, and Dynamics, Vol. 3, No. 1, 1980, pp. 78–85. doi: 10.2514/3.55950 [DOI] [Google Scholar]
- [28].Franco A and Rivas D, “Optimization of Multiphase Aircraft Trajectories Using Hybrid Optimal Control,” Journal of Guidance, Control, and Dynamics, 2015, pp. 1–16. doi: 10.2514/1.G000688 [DOI] [Google Scholar]
- [29].Park SG and Clarke J-P, “Optimal Control Based Vertical Trajectory Determination for Continuous Descent Arrival Procedures,” Journal of Aircraft, Vol. 52, No. 5, 2015, pp. 1469–1480. doi: 10.2514/1.C032967 [DOI] [Google Scholar]
- [30].Khardi S, “Aircraft Shortest and Fastest Continuous Descent Approach Development,” Journal of Aircraft, Vol. 49, No. 6, 2012, pp. 1931–1939. doi: 10.2514/1.C031775 [DOI] [Google Scholar]
- [31].Park SG and Clarke J-P, “Fixed RTA Fuel Optimal Profile Descent Based on Analysis of Trajectory Performance Bound,” Digital Avionics Systems Conference (DASC), 2012 IEEE/AIAA 31st, IEEE, 2012, pp. 3D3–1. doi: 10.1109/DASC.2012.6382316 [DOI] [Google Scholar]
- [32].Andreeva-Mori A, Suzuki S, and Itoh E, “Scheduling of Arrival Aircraft Based on Minimum Fuel Burn Descents,” ASEAN Eng J, Vol. 1, No. 1, 2011. [Google Scholar]
- [33].Hale FJ, Introduction to Aircraft Performance, Selection, and Design, Wiley New York, 1984. [Google Scholar]
- [34].Bryson AE Jr. and Ho Y-C, Applied Optimal Control: Optimization, Estimation and Control, CRC Press, 1975. [Google Scholar]
- [35].Erzberger H, Davis TJ, and Green SM, “Design of Center-TRACON Automation System,” Machine Intelligence in Air Traffic Management, edited by Benoit A, AGARD CP-538, Oct. 1993, pp. 11.1–11.12. [Google Scholar]
- [36].The MATLAB Software, Version 7.7.0.471 (R2008b), The MathWorks Inc., Natick, 2008. [Google Scholar]
- [37].Slattery R and Zhao Y, “Trajectory Synthesis for Air Traffic Automation,” Journal of Guidance, Control and Dynamics, Vol. 20, No. 2, March 1997, pp. 232–238. doi: 10.2514/2.4056 [DOI] [Google Scholar]


