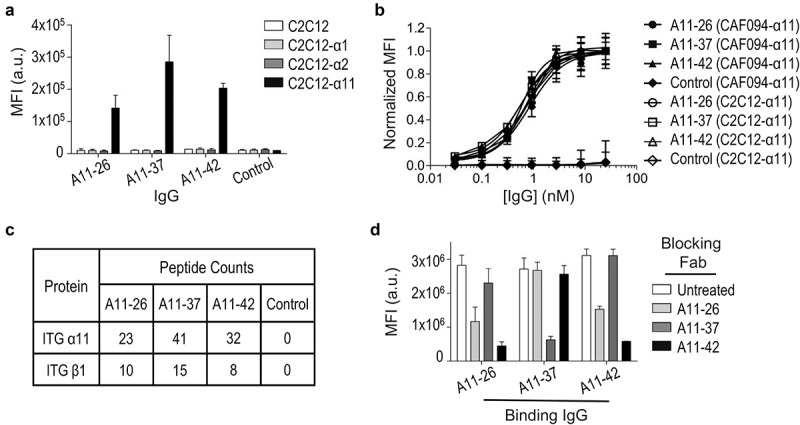
Figure 4.

Characterization of full-length anti-integrin-α11/β1 immunoglobulins. (a) Binding of anti-integrin-α11/β1 IgGs and a negative control IgG (x-axis) to C2C12 cells engineered to express the indicated integrins, assessed by flow cytometry fluorescence (y-axis). Data are shown for single-point measurements, and error bars indicate SD of two independent experiments. (b) Dose response curves for anti-integrin-α11/β1 IgGs and a negative control IgG (x-axis) binding to CAF094-α11/β1 or C2C12-α11/β1 cells, assessed by flow cytometry fluorescence (y-axis). Mean fluorescence intensity signals were normalized to the highest concentration value for each sample, and error bars indicate SD of two independent experiments. (c) Peptide counts for IP-MS analysis of CAF094-α11/β1 cell lysates immunoprecipitated with anti-integrin-α11/β1 IgGs or a negative control IgG. (d) Blocking of anti-integrin-α11/β1 IgGs (x-axis) binding to CAF094-α11/β1 cells by indicated Fabs, assessed by flow cytometry fluorescence (y-axis). Data are shown for single-point measurements, and error bars indicate SD of two independent experiments.
