Abstract
Background
As a generic measure of health-related quality of life among patients awaiting THA or TKA, the three-level version of the EQ-5D (EQ-5D-3L), which has three response levels of severity (no problems, some problems, and extreme problems/unable) to five questions, is widely used. Previous studies indicated that the ceiling effect of the EQ-5D-3L limits its application. The five-level version of the EQ-5D (EQ-5D-5L) was developed to enhance the measurement properties of the tool by adding two levels: slight problems and severe problems. However, only a few small studies have compared the EQ-5D-3L and EQ-5D-5L in patients awaiting THA and TKA.
Questions/purposes
The purpose of this study was to examine the performance of the EQ-5D-3L and EQ-5D-5L among patients awaiting THA or TKA in terms of (1) response patterns, (2) convergent construct validity, (3) known-group validity, and (4) informativity and discriminatory power.
Methods
This is a retrospective analysis of the Alberta Bone and Joint Health Data Repository, which recorded information on all patients receiving hip or knee arthroplasties between April 2010 and March 2017 in Alberta, Canada (n = 37,377). Patients receiving THA or TKA and who completed the EQ-5D and WOMAC at baseline (presurgery) were included in this study (n = 24,766). The EQ-5D-3L was administered to all patients in 2010, and was gradually replaced by the EQ-5D-5L between 2013 and 2016; the EQ-5D-5L reached full application in all clinics by 2017.
A propensity score was used to match patients 1:1 who completed either the EQ-5D-3L or EQ-5D-5L before surgery. Response patterns have been explored using ceiling and floor effects and distribution across severity levels of each dimension. Convergent construct validity was examined using Spearman’s correlation (rho) against the WOMAC. Known-group validity was examined by gender, preoperative risk factors, mental health, obesity, and WOMAC physical function score. Informativity and discriminatory power were examined using the Shannon (H’) and Shannon evenness (J’) indices. A total of 3446 pairs of patients awaiting THA (55% women; mean age, 66 years) and 5428 pairs of patients awaiting TKA (59% women; mean age 67 years) were included in this analysis; the study group included all patients who were kept in the propensity score matching.
Results
Ceiling and floor effects were comparable and small (less than 0.5%) for both versions; the responses across severity levels for each dimension were more evenly distributed for the EQ-5D-5L. Convergent construct validity was stronger for the EQ-5D-5L as it consistently had stronger correlations with the WOMAC overall and domain scores than the EQ-5D-3L (rho(3L-THA), -0.77 to -0.31; rho(3L-TKA), -0.71 to -0.24; rho(5L-THA), -0.71 to -0.17; rho(5L-TKA), -0.64 to -0.17; all p values < 0.001). The hypotheses of known-group analyses were confirmed for both versions. The EQ-5D-5L demonstrated stronger informativity and discriminatory power than the EQ-5D-3L, particularly for the mobility dimension (THA, H’(5L/3L)=1.66/0.37, J’(5L/3L)=0.72/0.23; TKA, H’(5L/3L)=1.66/0.41, J’(5L/3L)=0.71/0.26).
Conclusions
This study demonstrates the superior construct validity, and informativity and discriminatory power of the EQ-5D-5L compared with the EQ-5D-3L among patients awaiting THA or TKA.
Clinical Relevance
Compared with the three-level version, the five-level version of the EQ-5D differentiates between patients awaiting THA and TKA much better based on their mobility, which is a key health aspect or outcome in these patients. Our findings suggest that the EQ-5D-5L is more appropriate for this population.
Introduction
THA or TKA are among the most effective ways to reduce functional limitations and pain caused by severe hip or knee arthritis. The number of THAs and TKAs has dramatically increased around the world because of the aging population. In Canada, the total number of THAs and TKAs in 2014 to 2015 was more than 112,000, representing an increase of 20% since 2010 [9]. Patients’ health-related quality of life (HRQL) has been increasingly recognized as an essential and valuable outcome for patients undergoing THA or TKA, particularly in examining the clinical outcome and cost effectiveness of these interventions. To compare the HRQL of patients undergoing THA and TKA with general or other disease populations, generic preference-based instruments have been used on their own or in conjunction with disease-specific instruments. Moreover, utility scores derived from generic preference-based instruments can be used in calculating quality-adjusted life years (QALYs) in economic evaluations.
The WOMAC is a widely used self-administered measure to assess the symptoms and functioning of patients with hip and/or knee osteoarthritis. It has 24 items in three domains, including pain (five items), stiffness (two items), and physical functioning (17 items).
The EuroQol 5-dimension questionnaire (EQ-5D) is one of the most widely used generic preference-based measures. It measures HRQL in five dimensions: mobility, self-care, usual activities, pain/discomfort, and anxiety/depression. In the initial three-level version of the EQ-5D, each dimension has three severity levels: no problems (level 1), some/moderate problems (level 2), and unable to or extreme problems (level 3, confined to bed for the mobility dimension) [13]. The five-level version of the EQ-5D has the same five dimensions but with five severity levels for each dimension: no problems (level 1), slight problems (level 2), moderate problems (level 3), severe problems (level 4), and extreme problems (level 5) [14, 15]. Both versions only take about 2 to 5 minutes to complete.
The EQ-5D has been employed in clinical trials [12, 38] and cost-utility analyses [17, 30] among the THA and TKA populations and has been routinely applied in THA/TKA programs in the United Kingdom [28], Sweden [41], and Canada (Alberta) [8]. For routine applications, the UK and Swedish THA and TKA programs use the three-level (3L) version of the EQ-5D. Alberta originally used the EQ-5D-3L but gradually switched to the five-level (5L) version, in part because of important limitations in its application, such as the ceiling effect and limited sensitivity to change [22]. Previous studies have reported that the EQ-5D-3L had limited capability in discriminating small differences in health states in patients after TKA [20] as well as in patients with osteoarthritis and other rheumatic diseases [19, 44]. The EQ-5D-3L was also found to be less sensitive to changes in HRQL than other generic instruments [6]. Therefore, the new 5L version of the EQ-5D was developed to enhance these measurement properties [25]. Greene et al. [22] and Conner-Spady et al. [11] reported that the EQ-5D-5L provided stronger validity than the EQ-5D-3L in patients who underwent THA and TKA; however, the evidence was generated in relatively small samples. Evidence on the measurement properties of the 5L version and its potential advantages in THA and TKA populations is still needed so users can be more informed about which version to use, especially in routine applications among patients undergoing THA or TKA.
Our objective was to examine and compare the performance of the EQ-5D-3L and EQ-5D-5L in terms of (1) response patterns, (2) convergent construct validity, (3) known-group validity, and (4) informativity and discriminatory power among patients undergoing THA or TKA.
Patients and Methods
Data Source: The Alberta Bone and Joint Health Data Repository
This study is a retrospective secondary data analysis from the Alberta Bone and Joint Health Data Repository, which was launched in 2010, and is operated by the Alberta Bone and Joint Health Institute [34]. The objective of this repository is to track and measure the quality of hip and knee surgery care in Alberta regarding waiting time, surgery length, postsurgery length of hospital stay, serious surgery complications rates, readmissions, patient-reported outcomes, and patient satisfaction. Surgery-related data, including referral information, assessment information, surgery time, length of stay, and patients’ demographics were derived from administrative data. Preoperative risk factors reported in this project included 11 clinically relevant health conditions, such as clots, chronic heart diseases, lung diseases, renal diseases, cancer, moderate/severe liver diseases, dementia, diabetes with complications, stroke/cerebrovascular accidents, moderate/severe mental diseases, and obesity. Patients’ risk factors were identified if they had any documented record of having the above-mentioned health conditions in the Hospital Discharge Abstract Database or of using the Clinical Risk Groups methodology [7, 27].
We collected information on patients aged 18 or older who received elective hip or knee arthroplasty surgeries at 13 hospitals across Alberta between April 2010 and March 2017 from physicians and administration databases. We excluded nonelective arthroplasties (such as those performed for hip fractures) from this analysis.
The data used in this analysis was collected as part of standard of care and not part of a clinical study. As such, it was captured under the authority of the provincial Privacy Impact Analysis in place for quality assurance monitoring and reporting on Bone and Joint Health in Alberta (OIPC File # H2801). Participants do not provide consent.
Between April 2010 and March 2017, the Alberta Bone and Joint Health Repository cumulatively collected information from 37,377 patients (mean ± SD age, 66 ± 10 years, 57% women) receiving any types of hip or knee arthroplasty, among which 13,850 patients (mean ± SD age, 66 ± 11 years; 55% women) received a THA and 20,700 patients (mean ± SD age, 67 ± 9years; 60% women) received a TKA. Although not common practice, we included patients who received bilateral total joint arthroplasty (TJA) in our analysis. This was because the objective of the present study was to compare the measurement properties of two versions of the EQ-5D, which assesses patients’ overall quality of life but does not focus on a specific part of the body; the heterogeneity in terms of health-related quality of life and symptoms between patients who received bilateral TJA and those who received unilateral TJA would not affect our results. In addition, findings of this study can also be generalized to the bilateral population if we include these patients.
Implementation of Patient-reported Outcome Measures
The EQ-5D and WOMAC were routinely administered at baseline (before surgery), and at 3 months and 12 months after surgery. Although patients were encouraged by clinic staff to complete the measures according to the above-mentioned schedule, responses were voluntary. The administration mode and the schedule of the baseline measurement varied across different clinics. The baseline measurement is typically done using a hard copy or electronic tablet during the first clinical assessment. Patients completed the measures ahead of the first clinic visit through a hyperlink included in the appointment confirmation email or after the visit through a link included in the followup email. For those who did not complete the measures during or around the first clinical assessment, their baseline measurement was done during a subsequent appointment with the surgeon or online through email. For those who completed the measures more than once during or around the first assessment, the record closest to the surgery date was used as the baseline patient-reported outcome measures (PROMs) data. The clinics shifted from using the EQ-5D-3L to using the 5L version in three periods: between 2010 and 2012, all clinics administered the EQ-5D-3L instrument, between 2013 and 2016, the EQ-5D-3L was gradually replaced by the EQ-5D-5L, and since 2017, all clinics have used the EQ-5D-5L. This transition occurred over 4 years due to administrative and logistical arrangements. More specifically, when the 5L version questionnaires were sent to each clinic, the 3L version questionnaires were not exhausted, so the two versions were in mixed use for a period. There were no differences between centers in terms of timing of switching from the 3L to the 5L version.
Statistical Analysis
Missing Data
We imputed missing data for the WOMAC using individual mean imputation, as per the WOMAC user’s guide [5]. If one item on the pain and stiffness domains, or less than four on the physical function domain were missing, we imputed the missed items using the mean score of the remaining items within that domain. We excluded patients from our analysis if they had two or more missing items on the pain or stiffness domains, or four or more items on the physical function domain of the WOMAC, or they were missing a value on any of the five dimensions of the EQ-5D.
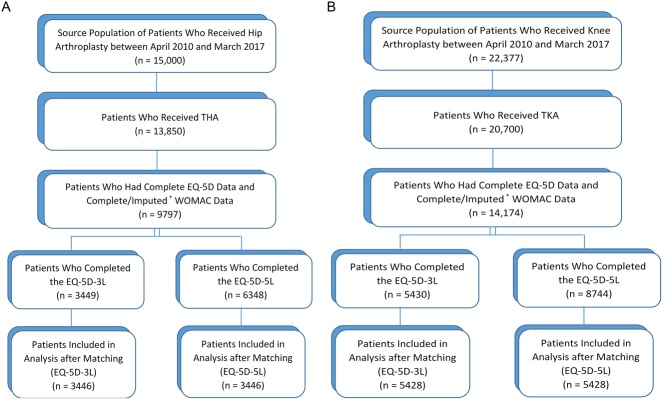
Among the 13,850 patients receiving THA, 73% had complete EQ-5D records, and 55% and 18% had complete and imputed WOMAC records, respectively; thus, a total of 9797 patients (EQ-5D-3L, 3449 patients; EQ-5D-5L, 6348 patients) with complete EQ-5D records and complete or imputed WOMAC records were identified (Fig. 1A). Among the 20,700 patients receiving TKA, 71% had complete EQ-5D records, and 53% and 18% had complete and imputed WOMAC records, respectively; thus, a total of 14,174 patients (EQ-5D-3L, 5430 patients; EQ-5D-5L, 8744 patients) were identified (Fig. 1B).
Fig. 1 A-B.
These flowcharts show patient enrollment and exclusion criteria for our analysis. (A) This flowchart presents enrollment and exclusion criteria for patients received THA. (B) This flowchart presents enrollment and exclusion criteria for patients received TKA. *Imputation was conducted for the WOMAC missing items with the mean score of the remaining items within that domain, if one pain, one stiffness, or less than four physical function items were missing.
Scoring of the EQ-5D and WOMAC
In this study, patients’ responses to the five EQ-5D questions were converted into preference-based index scores using Canadian value sets for the 3L [4] and the 5L [45]. The WOMAC has a Likert version and a VAS version; we used the Likert version in this study. For each item, the score ranges from 0 for no symptoms or functional limitations, to 4 for extreme symptoms or functional limitations. The raw score ranges for each of the three domains were 0 to 20 for pain, 0 to 8 for stiffness, and 0 to 68 physical functioning. All three raw domain scores were linearly transformed into a 0-100 scale, where a higher score indicates better functioning and fewer symptoms. The raw overall WOMAC score is the sum raw score of the three domains, and the transformed overall WOMAC score is the average of the three domains’ transformed scores [1].
Propensity Score Matching
The 3L and 5L versions of EQ-5D were not randomly assigned to the patients, and no patient completed the two versions simultaneously. To ensure that the differences in psychometric properties between the two versions were related to the measures per se but not caused by the differences in HRQL or other characteristics between the patients who completed the EQ-5D-3L and the EQ-5D-5L, we used a propensity score method to match patients who completed the EQ-5D-3L with those who completed the EQ-5D-5L at baseline. A logistic regression model was fitted to calculate the probability of answering the EQ-5D-3L at baseline for each patient using age, gender, and baseline WOMAC domain scores. During matching, we used a caliper of 0.03 (on a 0-1 probability scale), meaning that two matched individuals must have had a difference in propensity scores less than 0.03, without replacement. After matching, we confirmed that balance was achieved using the following criteria: the variance ratio of continuous covariates (V(3L)/V(5L)) was between 0.95 and 1.05; and the variance ratio of the propensity score index (V(3L)/V(5L)) was between 0.5 and 2.0 [33]. In addition, we also tested the balance of means of continuous covariates using Wilcoxon rank sum test and balance of proportions for categorical covariates using chi-square test.
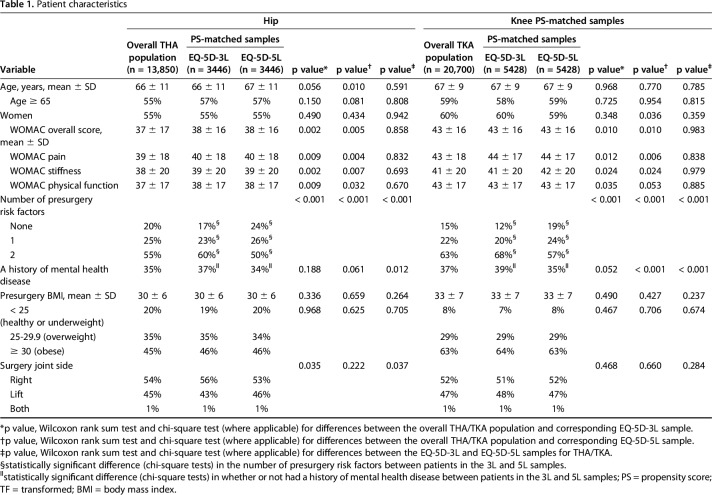
After propensity score matching, 3446 pairs of THA patients and 5428 pairs of TKA patients were included in the analysis (Fig. 1A-B); the study group included all patients who were kept from the propensity score matching. The matched samples used in the analysis had no statistically significant differences in terms of age, gender, and preoperative BMI from the overall patient population receiving THA/TKA in Alberta. After matching, there were no statistically significant differences in terms of age, gender, and WOMAC domain scores between the EQ-5D-3L and EQ-5D-5L samples (Table 1). For THA patients, the mean age (± SD) was 66 ± 11 years for the matched 3L and 67 ± 11 years for the matched 5L samples. For TKA patients, the mean ages (± SD) were 67 ± 9 years for both samples. Among THA patients, 55% were women in both the 3L and 5L. Among TKA patients, 60% were women in the 3L sample and 59% were women in the 5L samples.
Table 1.
Patient characteristics
Measurement Properties
We conducted descriptive analyses to describe the response pattern to the EQ-5D-3L and EQ-5D-5L. More specifically, we examined ceiling and floor effects and distributions of responses to each of the five questions. A ceiling effect reflects the proportion of respondents reporting no problems on all EQ-5D dimensions, and a floor effect reflects the proportion of respondents reporting extreme problems/unable to (level 3 for the 3L version, level 5 for the 5L version) on all EQ-5D dimensions. The distribution of responses to each EQ-5D dimension was examined by reporting proportions of responses for each level.
Construct validity reflects how well a measure evaluates the construct that it was designed to assess. There are several types of construct validity, including convergent construct validity and known-group construct validity. Convergent construct validity reflects the extent to which a measure agrees with other previously validated measures that measure the same construct in a similar application. For example, the EQ-5D and WOMAC both include a pain dimension, and the WOMAC has been validated in measuring HRQL of patients receiving THA and TKA in Canada, so the convergent construct validity, in this case, can be examined by assessing the correlation between EQ-5D pain dimensions and WOMAC pain domain. We used Spearman’s correlation coefficient (rho) to explore and compare the convergent construct validity of the two versions of the EQ-5D with the WOMAC. The strength of the correlation was interpreted according to the following criteria: no (rho < 0.2), weak (0.2 ≤ rho < 0.35), moderate (0.35 ≤ rho < 0.5), and strong (rho ≥ 0.5) [31].
Known-group construct validity reflects whether a measure can discriminate between a group of individuals known to have a particular trait and a group who does not have the trait. For example, we know that on average, patients with obesity have worse HRQL than patients with a normal body weight for their height [24]; that being so, we can then test the means of the EQ-5D index score of the two groups of patients to see if the EQ-5D is able to discriminate the known differences between patients with obesity and those who are of normal weight for their height. We examined known-group validity using groups defined by gender (men versus women), number of preoperative risk factors (none or 1 versus ≥ 2), mental health history (with history versus no history), obesity based on body mass index (BMI ≤ 30 kg/m2 versus BMI > 30 kg/m2 [3]), and WOMAC physical function domain score (hip ≤ 34.4 versus > 34.4; knee, ≤ 31 versus > 31 [42]). Women should have lower EQ-5D index scores than men [40]; patients who had more preoperative risk factors should have lower index scores than those who had fewer preoperative risk factors; patients with a history of mental health problems should report more problems on the anxiety/depression dimension than those with no history of such problems; patients with obesity should have lower index scores than their counterparts; and patients who had higher WOMAC physical function domain scores should have lower EQ-5D index scores. We used the Wilcoxon rank-sum test to test the difference in index scores and responses to each dimension of EQ-5D between dichotomous categorical known-groups. Effect sizes were also calculated to quantify the magnitude of the difference between each predefined known-groups. The magnitude of the effect size was interpreted as: 0.2 to 0.49, small; 0.5 to 0.79, moderate; and ≥ 0.8, large [10].
Informativity and discriminatory power reflect the ability of a measure or an item to discriminate among people who have different traits measured by that item. For example, informativity and discriminatory power can tell us to what extent the EQ-5D mobility dimension can discriminate among people with different levels of problems in walking. In this study, we examined informativity and discriminatory power using the Shannon index and the Shannon evenness index for each EQ-5D dimension [29]. The Shannon index represents the absolute amount of information captured by each dimension; the higher it is the more information is captured by the dimension. The Shannon index may, however, be affected by the number of levels in each dimension, and would only increase if the newly added levels are actually used. The Shannon evenness index reflects the evenness of a distribution of responses to a dimension, regardless of the number of levels. It ranges from 0 to 1, with a higher value indicating more information is captured, providing greater discriminatory power of the measure.
All statistical analyses were conducted in STATA 15.0 (Stata Corp LLC, College Station, Texas, USA).
Results
Response Pattern
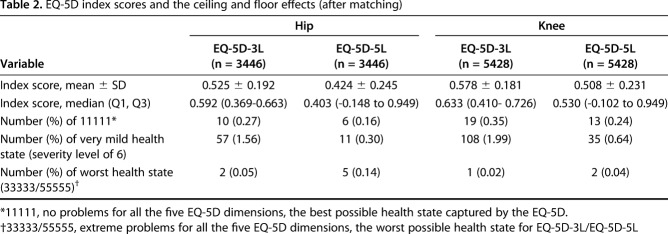
The ceiling and floor effects of both versions were small (< 0.5%), in both patient groups (Table 2), suggesting that both versions were able to discriminate between patients at the top end (very good health) and bottom end (poor health). For both samples, the EQ-5D-5L index scores (THA, 0.424 ± 0.245; TKA, 0.508 ± 0.231) were lower than the matched EQ-5D-3L index scores (THA, 0.525 ± 0.192; TKA, 0.578 ± 0.181) (Fig. 2A-B). For each individual EQ-5D dimension, responses to the 5L version were distributed more evenly across the levels compared with the 3L version (Fig. 3). Particularly for the mobility dimension, more than 90% of THA and TKA patients reported level 2 (some problems) on the 3L version, while none of the five levels accounted for more than 50% of the responses on the 5L version.
Table 2.
EQ-5D index scores and the ceiling and floor effects (after matching)
Fig. 2 A-B.
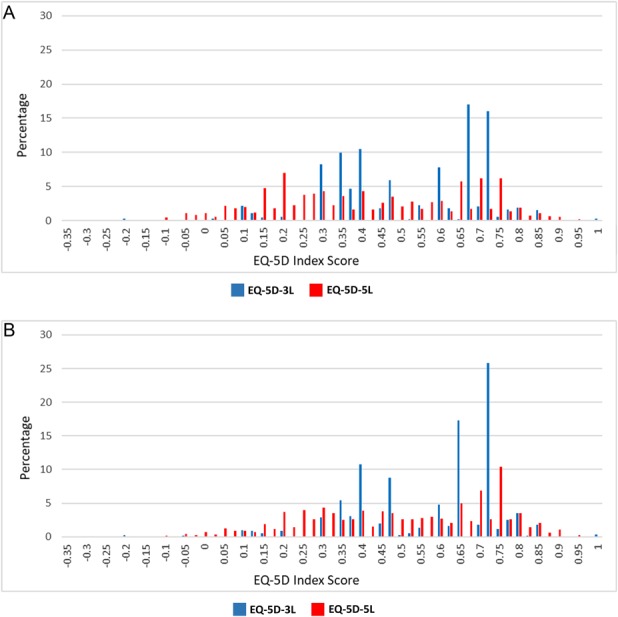
These histograms show the distributions of EQ-5D index scores (after matching). (A) This histogram presents the distributions of EQ-5D index scores for patients received THA. (B) This histogram presents the distributions of EQ-5D index scores for patient received TKA.
Fig. 3.
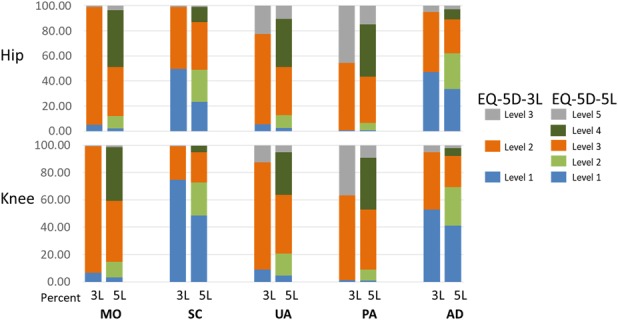
The 100% stacked bar charts show the distributions of the responses to the EQ-5D-3L and EQ-5D-5L by dimensions; MO = mobility; SC = self-care; UA = usual activities; PA = pain/discomfort; AD = anxiety/depression.
Convergent Construct Validity
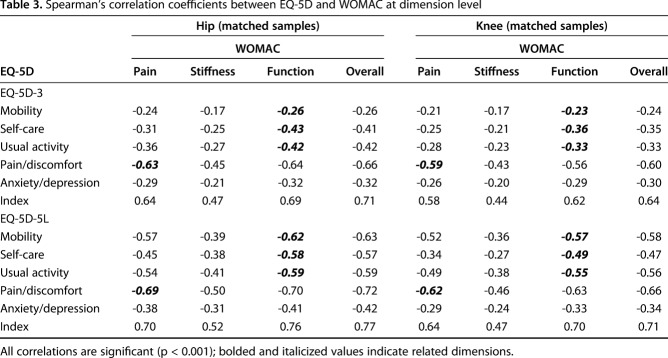
At both the index and dimension levels, the EQ-5D-5L consistently had stronger correlations with the WOMAC overall score and domain scores than the EQ-5D-3L for both THA and TKA samples (Table 3), suggesting that the EQ-5D-5L has better convergent construct validity than the 3L. The EQ-5D index scores and WOMAC overall scores were strongly correlated in all samples. For the EQ-5D dimensions and WOMAC domains, which measure similar constructs, the EQ-5D-3L mobility and WOMAC physical function domain were weakly correlated (THA, rho = -0.26; TKA, rho = -0.23), while the EQ-5D-5L mobility and WOMAC physical function domain were strongly correlated in both the THA and TKA samples (THA, rho = -0.62; TKA, rho = -0.57). The EQ-5D pain/discomfort dimension and the WOMAC pain domain were strongly correlated in both EQ-5D versions in both samples (rho range, -0.69 to -0.59). For the EQ-5D-3L, self-care (THA, rho = -0.43, TKA, rho = -0.36) and usual activities (THA, rho = -0.42; TKA, rho = -0.33) domains were weakly to moderately correlated with the WOMAC physical function domain. For the EQ-5D-5L, these two dimensions were moderately to strongly correlated with the WOMAC physical function domain (rho range, -0.59 to -0.49). However, the highest correlation in each sample (except for the knee 3L sample) was not found in the obviously related EQ-5D and WOMAC domains, but in the EQ-5D pain/discomfort dimension and the WOMAC physical function (rho range, -0.70 to -0.63). In addition, the two EQ-5D versions consistently had stronger correlations with the WOMAC overall score and domain scores in the THA samples than in the TKA samples. The only exception is that the correlation between EQ-5D-3L mobility dimension and the WOMAC stiffness domain was absent in both samples. All the correlations noted in this paragraph were at the p < 0.001 level.
Table 3.
Spearman’s correlation coefficients between EQ-5D and WOMAC at dimension level
Known-groups Construct Validity
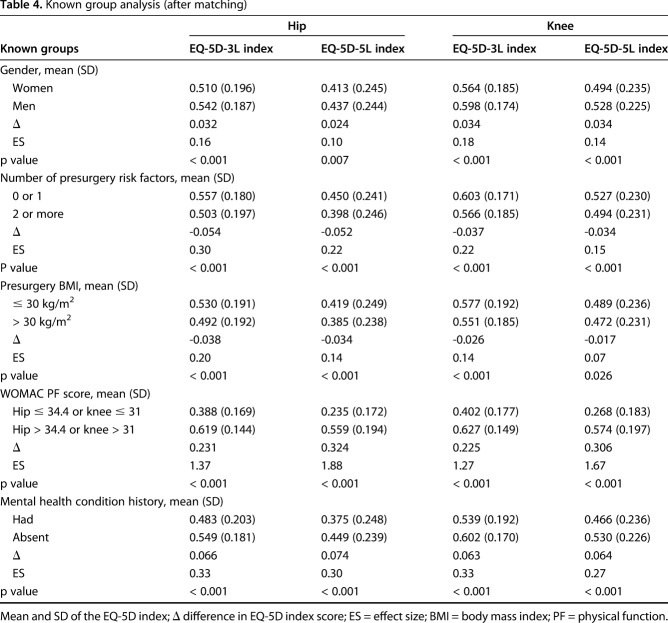
Compared with patients who were men, who had one or no preoperative risk factors, who were not obese, who did not have a mental health condition history, or who had higher preoperative WOMAC physical function score, index scores of both the EQ-5D-3L and EQ-5D-5L were lower than their counterparts (Table 4).This suggests that both versions of the EQ-5D have the ability to discriminate between patients defined by the above-mentioned subgroups that are known to have different HRQL levels. The hypotheses were all confirmed among patients awaiting either THA or TKA. Although the differences in index scores were statistically significant for all known-groups for both versions in both THA and TKA samples, the effect sizes of these differences were of small magnitude across all predefined known-groups except for the preoperative WOMAC physical function score (large magnitude). Patients who did not have a mental health condition history reported fewer problems in the anxiety/depression dimension than those who had a mental health condition history, no matter which version of EQ-5D was used (Fig. 4).
Table 4.
Known group analysis (after matching)
Fig. 4.
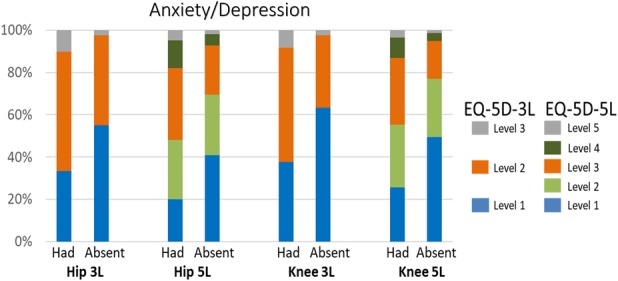
The 100% stacked bar chart shows the known group analysis results for groups had or absent to mental health condition history.
Informativity and Discriminatory Power
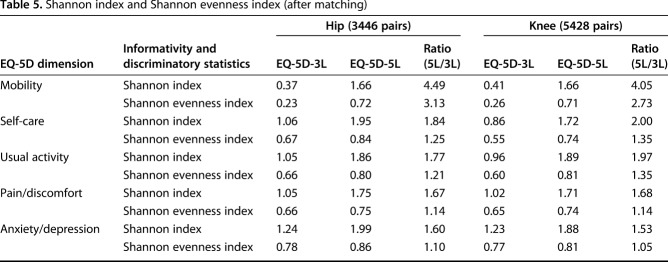
The EQ-5D-5L had stronger informativity and discriminatory power than the EQ-5D-3L at the dimension level (Table 5), suggesting that the EQ-5D-5L has better ability to discriminate between patients with different severity levels of problems in the five EQ-5D health dimensions. The largest difference in informativity and discriminatory power was for the mobility dimension, which is a key health outcome for patients undergoing THA or TKA. The Shannon index of the 3L and 5L mobility dimensions were 0.37 and 1.66 (a ratio of 4.49) for patients awaiting THA, and 0.41 and 1.66 (a ratio of 4.05) for the TKA samples.
Table 5.
Shannon index and Shannon evenness index (after matching)
Discussion
The EQ-5D is one of the most-widely used generic patient-reported outcome measures among patients undergoing THA or TKA. The five-level version was developed with the purpose to improve the performance of the tool; however, few studies [11, 22] examined this hypothesis in this patient population. Our study aimed to explore which version of the EQ-5D performed better in patients undergoing THA or TKA. Our analyses demonstrated that the EQ-5D-5L had better response distribution and convergent construct validity, and stronger ability to discriminate between patients with different severity levels of health problems, especially in mobility, than the 3L version. Our findings suggest that the EQ-5D-5L is more appropriate for measuring HRQL of patients awaiting THA and TKA than the EQ-5D-3L.
The present study has several limitations. First, the total number of patients who received joint replacements in Alberta during between 2010 and 2017 was 37,377; the final sample size we used in the analysis was only about half that number. Even there was no significant statistical difference between the final study sample and the overall patient population in the main characteristics in terms of age, gender, and presurgery BMI, the sample attrition caused statistically higher presurgery WOMAC scores and more risk factors in the final study samples. However, considering the average 1-point WOMAC score difference on a 0-100 scale and about 5% differences in the distributions of number of risk factors, these statistically significances may due to the relatively large sample sizes, and our final study samples should still represent the overall patient population in Alberta. Second, we were not able to conduct a head-to-head comparison of measurement properties between the 3L and 5L versions. We tried to balance the covariates that have been associated with HRQL [23]; however, imbalances from both observed (such as the number of preoperative risk factors) and unobserved sources may still introduce bias. More specifically, patients in the 3L samples had TJA between 2010 and 2016, while patients in the 5L samples had TJA between 2013 and 2017. The 3L samples being older than the 5L samples may introduce bias, that is, a population’s preference and how people perceive and rate their HRQL may shift over time as society develops and advances in medical technology; however, this timing effect in such a short period of time requires further research to confirm. Third, in terms of cross-sectional measurement properties, we were only able to examine the construct validity and discriminatory power in our analysis. There were not sufficient data to support examining the test-retest reliability of the two versions of the EQ-5D. More evidence on head-to-head comparisons and test-retest reliability is warranted in future studies. In addition, we only used preoperative data in this analysis, which means that this study population included patients waiting for THA or TKA, so the postsurgical performance of the 5L still needs to be explored.
Overall, our findings were in line with existing published evidence that the EQ-5D-5L has better measurement properties among general [2, 18] and patient populations, including psoriasis (Greece) [46], stroke (Poland) [21], cancer (Korea) [32], diabetes (Thailand and Singapore) [37, 43], among others. In both the THA and TKA samples in our analysis, after propensity score matching, the EQ-5D index scores–which reflects the overall HRQL–of patients in the 5L samples were consistently lower than that of patients in the 3L samples. We applied the Canadian values set for both the 3L and 5L, but also used the US 3L value set [39] to conduct a sensitivity analysis; the observed differences still existed. This finding suggests that the EQ-5D index scores derived from the 3L and 5L versions are not directly comparable in patients awaiting THA or TKA. A similar trend also was found in young Portuguese adults [18] and in Polish patients who had experienced a stroke [21]; however, this was the opposite to a finding made on that topic in the UK population [26]. There may be several reasons for this difference. First, the Canadian 5L value set anchors full health as 1.0 and has a value of 0.949 for the best possible EQ-5D-5L health state “11111”; while, the Canadian EQ-5D-3L value set anchors the health state “11111” as 1.0. The valuation modelling techniques were also different: the 5L value set was established based on a linear model (which treated each dimension as a continuous variable) and the 3L value set was based on a 10-model dummy (one dummy for each level in every dimension). Even though the Canadian 3L value set also placed heavier deduction for extreme health problems than the Canadian 5L value set, the proportion of patients who reported those extreme health problems was relatively low among those who received hip or knee replacement. Moreover, beyond the differences between the two Canadian value sets per se, the redistribution of the responses to levels 1and 2 of the 3L to higher levels (indicating more severe problems) of the 5L may also cause relatively lower index scores.
At the dimension level, the mobility dimension, compared with the other four EQ-5D dimensions, achieved the largest improvement in informativity and discriminatory power by switching from the 3L to the 5L. Level 3 of the mobility dimension means confined to bed in the EQ-5D-3L, which is rarely reported by patients undergoing THA or TKA (only 0.8% patients reported level 3 in our sample). In the 5L version, level 5 of the mobility dimension is “unable to walk,” and the response distribution among the five levels was more even than that among the three levels of the EQ-5D-3L mobility dimension. This finding was in line with the issues that had been exposed in the routine application of the EQ-5D-3L among patients undergoing THA or TKA in the United Kingdom, that is, even patients with very severe mobility problems still would not choose level 3 in the EQ-5D-3L [35, 36]. To address this problem in developing the EQ-5D-5L and EQ-5D-Y (youth version), the EuroQol group changed the wording of the most severe level of mobility to “unable to walk about” and “a lot of problems walking about,” to increase the sensitivity and applicability of the mobility dimension [14, 16].
Our findings provide evidence of stronger validity of the EQ-5D-5L compared with the EQ-5D-3L, particularly that the mobility dimension of the 5L version is more sensitive in patients awaiting THA or TKA. Our findings support the use of the EQ-5D-5L for more accurate measurement of HRQL in clinical research and routine application among patients awaiting THA or TKA. Since the EQ-5D is a generic preference-based measure, our findings will also help clinicians and researchers to better understand how the HRQL of patients preparing for THA or TKA compares with other patient populations or the general population, and they will provide more precise evidence for economic evaluations of THA and TKA procedures and related techniques. In addition, propensity score matching usually is used in comparative-effectiveness research for between-group analysis; however, in this study, we used the propensity score to match patients measured with different tools by analyzing registration-based data. Even though this is not a usual application of propensity score matching, it still can be generalized into comparing different commonly used outcome measures within or across registration datasets, where data is not sufficient to conduct head-to-head comparisons.
In summary, based on our findings, we recommend using the 5L version of the EQ-5D in patients awaiting THA and TKA; further research involving head-to-head comparisons between the two versions in postsurgery patient population is warranted.
Acknowledgments
We thank the EuroQol Research Foundation for supporting this study.
Footnotes
The institution of one or more of the authors (JAJ) has received, during the study period, funding from the EuroQol Research Foundation. One of the authors certifies that he (JAJ) is a member of the Board of Directors of the EuroQol Research Foundation, which holds the copyright for the EQ-5D instruments.
One of the authors certifies that she (DAM), or a member of her immediate family, has received or may receive payments or benefits, during the study period, personal consulting fees in an amount less than USD 10,000 from Optum Insight (Eden Prairie, MN, USA), personal consulting fees in an amount less than USD 10,000 from the Research Triangle Institute (Research Triangle Park, NC, USA); personal consulting fees in an amount less than USD 10,000, from Abbvie (North Chicago, IL, USA) all outside the submitted work.
All ICMJE Conflict of Interest Forms for authors and Clinical Orthopaedics and Related Research® editors and board members are on file with the publication and can be viewed on request.
Clinical Orthopaedics and Related Research® neither advocates nor endorses the use of any treatment, drug, or device. Readers are encouraged to always seek additional information, including FDA approval status, of any drug or device before clinical use.
Each author certifies that his or her institution waived approval for the human protocol for this investigation and that all investigations were conducted in conformity with ethical principles of research.
This work was performed at the Alberta Bone and Joint Health Institute in Calgary, Alberta, Canada, and the School of Public Health, University of Alberta in Edmonton, Alberta, Canada.
References
- 1.Ackerman I. Western Ontario and McMaster Universities Osteoarthritis Index (WOMAC). Aust J Physiother . 2009;55:213. [DOI] [PubMed] [Google Scholar]
- 2.Agborsangaya CB, Lahtinen M, Cooke T, Johnson JA. Comparing the EQ-5D 3L and 5L: measurement properties and association with chronic conditions and multimorbidity in the general population. Health Qual Life Outcomes. 2014;12:74. [DOI] [PMC free article] [PubMed] [Google Scholar]
- 3.Alberta Health Services. Obesity: implications for patients with osteoarthritis. Available at: https://www.albertahealthservices.ca/assets/about/scn/ahs-scn-bjh-osteoarthritis-and-obesity-white-paper-final.pdf. Accessed April 4, 2018.
- 4.Bansback N, Tsuchiya A, Brazier J, Anis A. Canadian valuation of EQ-5D health states: preliminary value set and considerations for future valuation studies. PLoS One . 2012;7:e31115. [DOI] [PMC free article] [PubMed] [Google Scholar]
- 5.Bellamy N. The WOMAC Knee and Hip Osteoarthritis Indices: Development, validation, globalization and influence on the development of the AUSCAN Hand Osteoarthritis Indices. Clin Exp Rheumatol. 2005; 23: 148-153. [PubMed] [Google Scholar]
- 6.Benson T, Williams DH, Potts HW. Performance of EQ-5D, howRu and Oxford hip & knee scores in assessing the outcome of hip and knee replacements. BMC Health Serv Res. 2016;16:512. [DOI] [PMC free article] [PubMed] [Google Scholar]
- 7.Canadian Foundation for Healthcare Improvement. Comparing the value of three main diagnostic-based risk-adjustment systems (DBRAS): Canadian Health Services Research Foundation; 2005. Available at: https://www.cfhi-fcass.ca/SearchResultsNews/05-03-01/5a0f1ea5-91dd-4877-a570-9afd8a50a3a1.aspx. Accessed July 31, 2018.
- 8.Canadian Institute for Health Information. PROMs forum proceedings. Ottawa, ON: CIHI; 2015. Available at: https://www.cihi.ca/sites/default/files/document/proms_forum_proceedings_-_may_26_enweb.pdf. Accessed December 14, 2018. [Google Scholar]
- 9.Canadian Institute for Health Information. Hip and knee replacements in Canada, 2014-2015: Canadian joint replacement registry annual report. Ottawa, ON: CIHI; 2017. Available at: https://secure.cihi.ca/free_products/cjrr-annual-report-2016-en.pdf. Accessed December 14, 2018. [Google Scholar]
- 10.Cohen J. Statistical power analysis for the behavioral sciences . 2nd ed. Hillsdale, NJ: L. Erlbaum Associates; 1988. [Google Scholar]
- 11.Conner-Spady BL, Marshall DA, Bohm E, Dunbar MJ, Loucks L, Al Khudairy A, Noseworthy TW. Reliability and validity of the EQ-5D-5L compared to the EQ-5D-3L in patients with osteoarthritis referred for hip and knee replacement. Qual Life Res. 2015; 24:1775-1784. [DOI] [PubMed] [Google Scholar]
- 12.Costa ML, Achten J, Foguet P, Parsons NR; Young Adult Hip Arthroplasty team. Comparison of hip function and quality of life of total hip arthroplasty and resurfacing arthroplasty in the treatment of young patients with arthritis of the hip joint at 5 years. BMJ Open . 2018; 8: e018849. [DOI] [PMC free article] [PubMed] [Google Scholar]
- 13.EuroQol Group. EQ-5D-3L user guide. Available at: https://euroqol.org/wp-content/uploads/2016/09/EQ-5D-3L_UserGuide_2015.pdf. Accessed April 4, 2018.
- 14.EuroQol Group. EQ-5D-5L. Available at: https://euroqol.org/eq-5d-instruments/eq-5d-5l-about/ . Accessed April 22, 2018.
- 15.EuroQol Group. EQ-5D-5L user guide. Available at: https://euroqol.org/wp-content/uploads/2016/09/EQ-5D-5L_UserGuide_2015.pdf. Accessed April 4, 2018.
- 16.EuroQol Group. EQ-5D-Y (youth). Available at: https://euroqol.org/eq-5d-instruments/eq-5d-y-about/. Accessed April 22, 2018.
- 17.Fernandes L, Roos EM, Overgaard S, Villadsen A, Søgaard R. Supervised neuromuscular exercise prior to hip and knee replacement: 12-month clinical effect and cost-utility analysis alongside a randomised controlled trial. BMC Musculoskelet Disord . 2017;18:5. [DOI] [PMC free article] [PubMed] [Google Scholar]
- 18.Ferreira LN, Ferreira PL, Ribeiro FP, Pereira LN. Comparing the performance of the EQ-5D-3L and the EQ-5D-5L in young Portuguese adults. Health Qual Life Outcomes. 2016;14:89. [DOI] [PMC free article] [PubMed] [Google Scholar]
- 19.Fransen M, Edmonds J. Reliability and validity of the EuroQol in patients with osteoarthritis of the knee. Rheumatology (Oxford) . 1999;38:807-813. [DOI] [PubMed] [Google Scholar]
- 20.Giesinger K, Hamilton DF, Jost B, Holzner B, Giesinger JM. Comparative responsiveness of outcome measures for total knee arthroplasty. Osteoarthritis Cartilage. 2014;22:184-189. [DOI] [PMC free article] [PubMed] [Google Scholar]
- 21.Golicki D, Niewada M, Karlińska A, Buczek J, Kobayashi A, Janssen MF, Pickard AS. Comparing responsiveness of the EQ-5D-5L, EQ-5D-3L and EQ VAS in stroke patients. Qual Life Res. 2015;24:1555-1563. [DOI] [PMC free article] [PubMed] [Google Scholar]
- 22.Greene ME, Rader KA, Garellick G, Malchau H, Freiberg AA, Rolfson O. The EQ-5D-5L improves on the EQ-5D-3L for health-related quality-of-life assessment in patients undergoing total hip arthroplasty. Clin Orthop Relat Res. 2015;473:3383-3390. [DOI] [PMC free article] [PubMed] [Google Scholar]
- 23.Guertin JR, Humphries B, Feeny D, Tarride JÉ. Health Utilities Index Mark 3 scores for major chronic conditions: Population norms for Canada based on the 2013 and 2014 Canadian Community Health Survey. Health Rep. 2018;29:12-19. [PubMed] [Google Scholar]
- 24.Hassan MK, Joshi AV, Madhavan SS, Amonkar MM. Obesity and health-related quality of life: a cross-sectional analysis of the US population. Int J Obes Relat Metab Disord . 2003;27:1227-1232. [DOI] [PubMed] [Google Scholar]
- 25.Herdman M, Gudex C, Lloyd A, Janssen M, Kind P, Parkin D, Bonsel G, Badia X. Development and preliminary testing of the new five-level version of EQ-5D (EQ-5D-5L). Qual Life Res . 2011;20:1727-1736. [DOI] [PMC free article] [PubMed] [Google Scholar]
- 26.Hernandez Alava M, Wailoo A, Grimm S, Pudney S, Gomes M, Sadique Z, Meads D, O'Dwyer J, Barton G, Irvine L. EQ-5D-5L versus EQ-5D-3L: the impact on cost effectiveness in the United Kingdom. Value Health. 2018;21:49-56. [DOI] [PubMed] [Google Scholar]
- 27.Hughes JS, Averill RF, Eisenhandler J, Goldfield NI, Muldoon J, Neff JM, Gay JC. Clinical risk groups (CRGs): a classification system for risk-adjusted capitation-based payment and health care management. Med Care. 2004;42:81-90. [DOI] [PubMed] [Google Scholar]
- 28.Insight & Feedback Team, NHS England. National patient reported outcome measures (PROMs) programme consultation report. London: NHS;2017. Available at: https://www.england.nhs.uk/wp-content/uploads/2017/10/proms-consultation-report.pdf. Accessed Dec 25, 2018. [Google Scholar]
- 29.Janssen MF, Pickard AS, Golicki D, Gudex C, Niewada M, Scalone L, Swinburn P, Busschbach J. Measurement properties of the EQ-5D-5L compared to the EQ-5D-3L across eight patient groups: a multi-country study. Qual Life Res . 2013;22:1717-1727. [DOI] [PMC free article] [PubMed] [Google Scholar]
- 30.Jenkins PJ, Clement ND, Hamilton DF, Gaston P, Patton JT, Howie CR. Predicting the cost-effectiveness of total hip and knee replacement: a health economic analysis. Bone Joint J . 2013;95-B:115-121. [DOI] [PubMed] [Google Scholar]
- 31.Juniper EF, Gordon HG, Roman J. How to develop and validate a new health-related quality of life instrument. In: Spilker B. Ed. Quality of Life and Pharmacoeconomics in Clinical Trials . 2nd ed. Philadelphia, PA: Lippincott-Raven Publishers; 1996. [Google Scholar]
- 32.Kim SH, Kim HJ, Lee SI, Jo MW. Comparing the psychometric properties of the EQ-5D-3L and EQ-5D-5L in cancer patients in Korea. Qual Life Res . 2012;21:1065-1073. [DOI] [PubMed] [Google Scholar]
- 33.Leuven E, Sianesi B. PSMATCH2: Stata module to perform full Mahalanobis and propensity score matching, common support graphing, and covariate imbalance testing. Available at: http://ideas.repec.org/c/boc/bocode/s432001.html. Accessed April 4, 2018.
- 34.Marshall DA, Christiansen T, Smith C, Squire Howden J, Werle J, Faris P, Frank C. Continuous quality improvement program for hip and knee replacement. Am J Med Qual. 2015;30:425-431. [DOI] [PubMed] [Google Scholar]
- 35.Oppe M, Devlin N, Black N. Comparison of the underlying constructs of the EQ-5D and Oxford Hip Score: implications for mapping. Value Health. 2011;14:884-891. [DOI] [PubMed] [Google Scholar]
- 36.Parkin D, Devlin N, Feng Y. What determines the shape of an EQ-5D index distribution? Med Decis Making. 2016;36:941-951. [DOI] [PubMed] [Google Scholar]
- 37.Pattanaphesaj J, Thavorncharoensap M. Measurement properties of the EQ-5D-5L compared to EQ-5D-3L in the Thai diabetes patients. Health Qual Life Outcomes . 2015;13:14. [DOI] [PMC free article] [PubMed] [Google Scholar]
- 38.Rosenlund S, Broeng L, Holsgaard-Larsen A, Jensen C, Overgaard S. Patient-reported outcome after total hip arthroplasty: comparison between lateral and posterior approach. Acta Orthop . 2017;88:239-247. [DOI] [PMC free article] [PubMed] [Google Scholar]
- 39.Shaw JW, Johnson JA, Coons SJ. US valuation of the EQ-5D health states: development and testing of the D1 valuation model. Med Care . 2005; 43:203-220. [DOI] [PubMed] [Google Scholar]
- 40.Sprague S Bhandari M Heetveld MJ Liew S Scott T Bzovsky S Heels-Ansdell D Zhou Q Swiontkowski M Schemitsch EH; FAITH Investigators. Factors associated with health-related quality of life, hip function, and health utility after operative management of femoral neck fractures. Bone Joint J. 2018;100-B: 361-9. [DOI] [PubMed] [Google Scholar]
- 41.The Swedish Hip Arthroplasty Register. The Swedish hip arthroplasty register annual report 2016. Available at: https://registercentrum.blob.core.windows.net/shpr/r/Annual-Report-2016-B1eWEH-mHM.pdf. Accessed August 7, 2018.
- 42.Tubach F Ravaud P Baron G Falissard B Logeart I Bellamy N Bombardier C Felson D Hochberg M van der Heijde D, and Dougados M. Evaluation of clinically relevant states in patient reported outcomes in knee and hip osteoarthritis: the patient acceptable symptom state. Ann Rheum Dis. 2005;64:34-37. [DOI] [PMC free article] [PubMed] [Google Scholar]
- 43.Wang P, Luo N, Tai ES, Thumboo J. The EQ-5D-5L is more discriminative than the EQ-5D-3L in patients with diabetes in Singapore. Value Health Reg Issues . 2016;9:57-62. [DOI] [PubMed] [Google Scholar]
- 44.Wolfe F, Hawley DJ. Measurement of the quality of life in rheumatic disorders using the EuroQol. Br J Rheumatol. 1997;36:786-793. [DOI] [PubMed] [Google Scholar]
- 45.Xie F, Pullenayegum E, Gaebel K, Bansback N, Bryan S, Ohinmaa A, Poissant L, Johnson JA; Canadian EQ-5D-5L Valuation Study Group. A time trade-off-derived value set of the EQ-5D-5L for Canada. Med Care. 2016;54:98-105. [DOI] [PMC free article] [PubMed] [Google Scholar]
- 46.Yfantopoulos J, Chantzaras A, Kontodimas S. Assessment of the psychometric properties of the EQ-5D-3L and EQ-5D-5L instruments in psoriasis. Arch Dermatol Res . 2017;309:357-370. [DOI] [PubMed] [Google Scholar]


