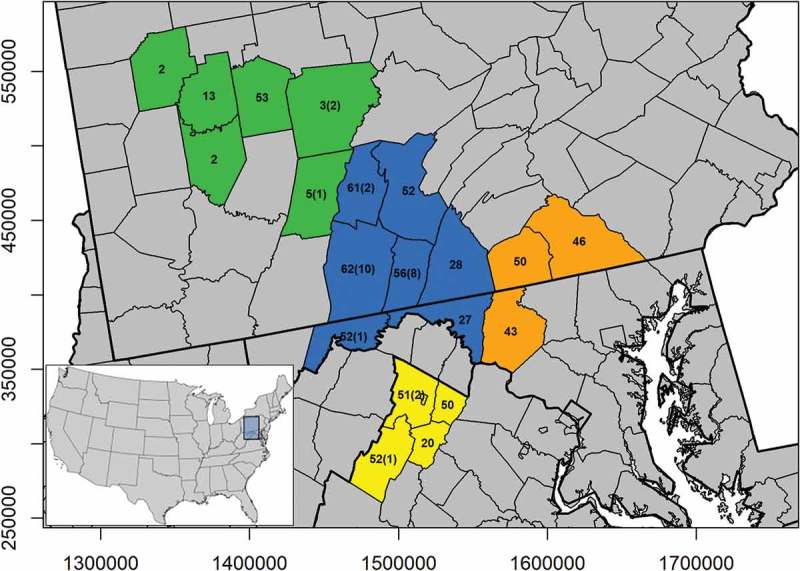
Figure 1.

The distribution and sample size of white-tailed deer used to determine Prnp variability in the Mid-Atlantic region. Samples were georeferenced by sampling unit (county). The number of infected samples genotyped are indicated in parentheses. Sampling units were stratified into four subregions (orange = one, blue = two, green = three, and yellow = four) that generally conformed to predicted dispersal barriers and disease management units.
