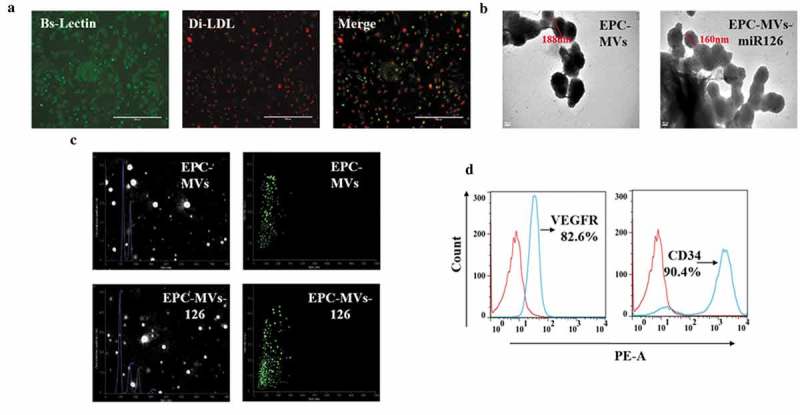
Figure 1.

Characterization of EPCs and EPC-MVs. (a) EPCs were identified by Di-LDL and Bs-Lectin staining. (b) Representative image of EPC-MVs and EPC-MVs-miR126 examined by TEM. (c) Size distribution of EPC-MVs and EPC-MVs-miR126 detected by NTA. (d) EPC-MVs stained with PE-CD34 and PE-VEGFR were analysed by flow cytometry.
