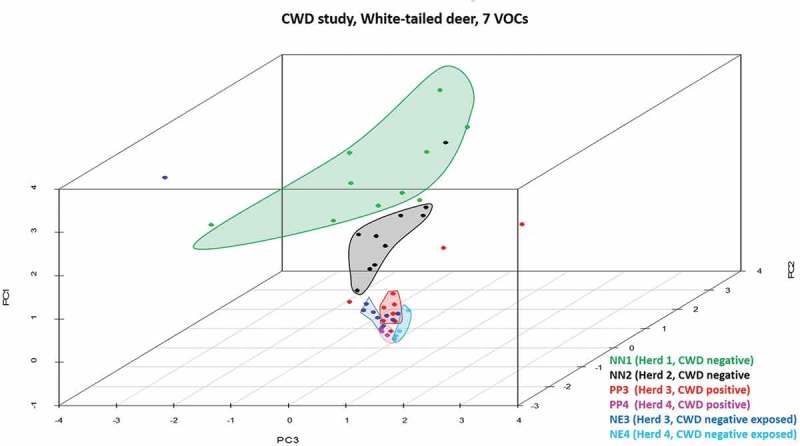
Figure 1.

Three-dimensional PCA scatterplot of CWD-positive, -negative exposed, and -negative deer. All known negative animals from Herd 1 (NN1; green dots) and one from Herd 2 (NN2, black dot) are located in a cluster (green) closely associated with all other NN2 individuals (black cluster). Three Herd 3 CWD-positive (PP3, red dots) and one -negative exposed individual (NE3, blue dot) are not associated with clusters in the plot and represent outliers. Remaining PP3 and NE3 animals and Herd 4 (PP4, pink dots; NE4, aqua dots) animals form closely associated clusters, with the exception of four NE3 animals found within or in close association to the PP3 cluster.
