

Abstract
Fluorescence in situ hybridization (FISH) is a widely used technique to detect and localize specific DNA or RNA sequences in cells. Although supplanted in many ways by fluorescently labeled DNA binding proteins, FISH remains the only cytological method to examine many genetic loci at once (up to six), and can be performed in any cell type and genotype. These advantages have proved invaluable in studying the spatial relationships between chromosome regions and the dynamics of chromosome segregation in bacteria. A detailed protocol for DNA FISH in E. coli is described.
Keywords: Fluorescence in situ hybridization, FISH, Bacterial chromosomes, E. coli chromosome
1. Introduction
Technological advances using fluorescently labeled DNA binding proteins, such as the fluorescent repressor-operator system (FROS), have revolutionized chromosome dynamics research (reviewed in [1]). While these systems have the clear advantage of allowing the tracking of genetic loci in living cells, they have significant drawbacks. First, for every chromosomal site to be examined (at best two in the same cell) a large array of protein binding sequences must be cloned into the chromosome by homologous recombination—often a difficult procedure because of their repetitive nature (cannot PCR). Second, the resulting large protein complexes often interfere with DNA replication [2] and may even change the cellular localization of the genetic locus being analyzed. Fluorescent in situ hybridization (FISH) requires no cloning, does not involve an in vivo tag of any kind, and can be performed in any strain. Since several genetic loci (up to six) can be analyzed simultaneously, FISH is particularly suited for analyzing the spatial relationship between chromosome regions and was the primary tool used to document chromosome cohesion in E. coli [3–5]. Undoubtedly, bacterial FISH is underutilized because it is technically challenging and most protocols have been optimized for eukaryotic cells. We describe here a highly optimized method that is based on pioneering work by Sota Hiraga [6], and later modified in our E. coli chromosome dynamics studies [3, 5, 7]. The methods are applicable to a variety of gram-negative and gram-positive bacteria with minor adjustments to the permeabilization procedure due to differences in cell wall structure.
2. Materials
2.1. Fluorescence Imaging System
As FISH markers contain only a few fluorescent molecules, the primary consideration when choosing an imaging system for FISH is light sensitivity. Sensitivity is determined largely by the imaging sensor or charge-coupled device (CCD), with the most sensitive cameras having very large pixels with a high dynamic range. These cameras generally have electron multiplying sensors (EMCCD) with quantum efficiency (the percentage of photons detected) approaching 100%, thus capable of detecting a single photon. However, with increased pixel size there is an equal reduction in spatial resolution for the object being imaged. While this is usually not a concern with interpretation of FISH signals on eukaryotic chromosome spreads, bacterial applications often require resolution to the light limited value of ~0.2 μm. By sampling theory, the image pixel size must be less than half the desired resolution (0.1 μm). Under 100× magnification, this corresponds to an actual CCD sensor pixel size of less than 10 μm. Note that further reduction in CCD pixel size does not confer any additional gain in resolution because of the light diffraction limit. Cameras, especially EMCCD types, also require an active cooling system (e.g., peltier block or liquid nitrogen) to reduce thermal energy (dark current) that can activate the CCD sensors. With FISH’s typical long exposure times, dark current can significantly reduce the ability to detect weaker signals. Lastly, fluorescence excitation and emission filters most useful for multicolor FISH are narrow spectrum bandpass filters designed to reduce bleed-through of fluorescent signals into adjacent filter channels (cross talk; Fig. 1). Because background fluorescence is generally present in all wavelengths, long exposures with a narrow spectrum filter produce a higher signal-to-noise ratio than short exposures with a wide spectrum filter.
Fig. 1.

Fluorescence spectra for six-color FISH. (a) Absorption and emission spectra for six fluorescent dyes as indicated; (BV) Brilliant Violet (BD Biosciences, San Jose, CA, USA), (AF) Alexa Fluor (ThermoFisher Scientific). (b) Excitation and emission filter sets (Chroma Technology Corp, Bellows Falls, VT, USA) to image six fluorescent dyes with minimal cross talk (dichroic mirror spectra not shown)
Fluorescence microscope: the most important features of a fluorescence microscope are high quality (and clean) optics, a high numerical aperture objective, and a multichannel filter wheel or cube turret for illuminating and observing specific fluorescent dyes. Motorized stages and computer-controlled filter selection and image acquisition save time and allow precise three-dimensional imaging.
Illumination source: the most common light source is a high-pressure mercury arc lamp, which has several intensity peaks that correspond to excitation spectra of several fluorescent dyes. An alternative light source is a xenon lamp, which has a more homogeneous spectral coverage and is able to excite far-red dyes better than mercury lamps. Light-emitting diode (LED) illumination technology is rapidly emerging, but may, as of yet, not provide sufficient light output for FISH.
Fluorescence bandpass filters: multicolor FISH demands narrow wavelength excitation and emission filters to avoid cross talk between channels. Six-color FISH with minimal cross talk can be performed using the dyes and filter sets shown in Fig. 1.
CCD camera: a sensitive camera with reasonably small pixels and active cooling (example, EMCCD 1K × 1K 8 μm pixel camera C9100–02, Hamamatsu Photonics, Japan).
Image processing and analysis software: dedicated image processing software is required to align phase contrast and fluorescent images of the same field, adjust brightness and contrast, and remove out of focus signal (deconvolution). Image analysis software facilitates FISH signal detection, measurement, and recording (see Subheading 3.3.2). Processing and analysis software may be coupled with acquisition software or separate. Examples are Metamorph (Molecular Devices, Sunnyvale, CA, USA), Axiovision (Carl Zeiss Microscopy, Jena, Germany), and the open source Micro-Manager (www.micro-manager.org).
2.2. Cell Fixation and Hybridization
Phosphate-buffered saline (PBS): 80 mM Na2HPO4, 20 mM NaH2PO4, 100 mM NaCl in dH2O. Mix and adjust pH to 7.5 with HCl. Autoclave, then filter through 0.2 μm membrane. Stable at room temperature for several months.
2.5% formaldehyde: immediately before use dilute 16% EM-grade formaldehyde from a sealed ampoule (Electron Microscopy Services, Hatfield, PA) to 2.5% in PBS (see Note 1).
Glucose–Tris–EDTA buffer (GTE) for cell permeabilization: 20 mM Tris–HCl (pH 7.5), 10 mM EDTA, 50 mM glucose in dH2O.
10 mg/ml Lysozyme: dissolve in dH2O, pass through 0.2 μm syringe filter, and store small single-use aliquots at −20 °C for up to 6 months.
Subbed microscope slides: soak frosted slides in a NaOH–ethanol solution (2 M NaOH, 50% ethanol in dH2O) in a glass staining dish for 1 h, then rinse continually with dH2O for 10 min (place jar under running water). Transfer the slides (without drying) to a plastic staining dish filled with poly-l-lysine solution (0.01% poly-l-lysine in 0.1 × PBS) and soak with gentle shaking for 1 h. Rinse the slides three times in dH2O and dry with compressed air to avoid streaks. Prepared slides may be stored in a desiccator for several weeks.
20 × SSC: 4 M NaCl, 0.4 M sodium citrate in dH2O, pH to 7.5 with HCl, and autoclave.
50% dextran sulfate: dissolve 2.5 g dextran sulfate in 2.5 ml dH2O at 60 °C with stirring. Filter through 0.2 μm membrane and store at −20 °C.
Denaturing solution: 50 ml 2 × SSC, 70% formamide (recently deionized), 0.1 mM EDTA in dH2O. Verify that pH is 7.0–7.5 with a test strip. Solution may be reused up to 1 month if stored at 4 °C.
1.2× hyb buffer: 60% formamide, 2× SSC, 12% dextran sulfate, 30 mM Na2HPO4, 30 mM NaH2PO4 in dH2O. Store small single-use aliquots at −20 °C for up to 1 year.
Several glass staining dishes, both upright (~50 ml volume) and horizontal (~200 ml volume) styles. Horizontal staining dishes have removable racks and are convenient for transferring the slides rapidly between successive treatments.
85 °C heating source for denaturing genomic DNA in situ: heated circulating water bath, thermal cycler with in situ PCR attachment, or solid aluminum dry block incubator (see Subheadings 3.2.3, 3.2.4)
Hybridization chamber: fill an empty tip box (holds four slides) or large Tupperware with inner rack with ~1 cm water. Preheat container to 37 °C before hybridization and cover with light-proof material.
Blocking buffer: 1 ml 0.1% Tween 20, 2% BSAin 1× PBS.
10× 4′,6-diamidine-2′-phenylindole dihydrochloride (DAPI): 3 μg/ml in dH2O.
2.3. Probe Labeling (Nick Translation)
Nucleotide stocks: 5 mM each of dATP, dGTP, dCTP, dTTP, and fluorescent or hapten-labeled dUTP.
10× nick translation buffer: 0.5 M Tris–HCl (pH 7.5), 0.1 M MgSO4, 1 mM dithiothreitol (DTT). Store single-use aliquots at −20 °C.
25× enzyme mix: 5 U/μl DNA Pol I and 0.05 U/μl DNase I in storage buffer (25 mM Tris–HCl pH 7.5, 1 mM DTT, 0.1 mM EDTA, 50% glycerol). Store small single-use aliquots at −20 °C.
Stop buffer: 0.5 M EDTA (pH 8.0).
TE buffer: 10 mM Tris–HCl (pH 7.5), 1 mM EDTA.
Sephadex spin columns.
Small volume spectrophotometer.
3. Methods
3.1. Probe Preparation
DNA probes can be labeled enzymatically by nick translation, PCR, or random-primed synthesis using a fluorescent nucleotide. Alternatively, a biotin or hapten-labeled nucleotide may be used that is subsequently detected by a fluorescently conjugated streptavidin or antibody. Although indirect labeling methods utilizing secondary fluorescent antibodies produce an amplified signal, they generally have higher background fluorescence and fewer labels can be used in one experiment due to the limited number of available hapte-n–antibody pairs. Alternatively, fluorophores can be chemically conjugated to dsDNA, with the universal linking system (ULS) being the most common commercially available method (Ulysis Nucleic Acid Labeling Kit, ThermoFisher Scientific, Waltham, MA, USA). Nick translation, our preferred labeling method (described below), is relatively inexpensive, works well with a wide range of fluorescent nucleotides, and has the advantage of producing short DNA fragments without secondary sonication steps. All steps using fluorescent dyes should be performed under low light conditions.
Prepare several micrograms of a 2–6-kb DNA fragment at the site of interest by PCR amplification or plasmid purification. Although probes as small as 100 bp can produce detectable signals, longer probes are brighter and less prone to sequence-specific differences in labeling and detection efficiency. It has also been reported that probes prepared from whole plasmids increase FISH signals due to chain hybridization of vector sequences at the site of genomic target [8].
Prepare a 50 μl nick translation reaction in a 0.5 ml PCR tube on ice: 5 μl 10 × nick translation buffer, 1 μg template DNA (in 1–23 μl H2O), 5 μl 5 mM dATP, 5 μl 5 mM dCTP, 5 μl 5 mM dGTP, 2.5 μl 5 mM dTTP, 2.5 μl 5 mM fluorescently labeled dUTP, 2 μl 25 × enzyme mix, and bring volume to 50 μl with dH2O.
Mix well, incubate at 15 °C for 3 h, and place reaction on ice.
Run 5 μl of the reaction on an agarose gel to check for proper fragment length (200–500 bp). If fragment length is >500 bp, add 1 μl of enzyme mix and incubate for an additional 3 h at 15 °C (see Note 2).
Stop reaction by adding 2 μl Stop Buffer.
Remove unincorporated fluorescent nucleotides by passing through a Sephadex spin column using the manufacturer’s protocol, then precipitate the DNA with ethanol and resuspend in 15 μl TE.
- (Optional) To calculate labeling efficiency, measure the optical density of the labeled probe using a small volume spectrophotometer at 260 nm and at the excitation maximum of the fluorescent dye and apply the following equation:
where the extinction coefficient for dsDNA (ECdsDNA) is 6600, and the corrected 260 nm absorbance (Abs260corr) is calculated from:
Extinction coefficient (ECdye) and absorbance contribution at 260 nm (CF260) of the dye are provided by the supplier. Incorporation rates >0.03 (3 dye molecules per 100 bases) are acceptable and are typically 0.05–0.08 in nick translation reactions.
3.2. In Situ Hybridization
3.2.1. Cell Fixation
To preserve chromosome morphology during chemical and temperature treatments of FISH, DNA and protein must be fixed prior to FISH treatment. Aldehyde fixatives, either formaldehyde or glutaraldehyde, physically cross-link proteins and nucleic acid and offer excellent morphological preservation. Glutaraldehyde forms cross-links between more distantly separated molecules and is often used in combination with formaldehyde. Commercial 37% formaldehyde solutions (formalin) often contain up to 10% methanol, which can cause protein clumping, so we recommend using sealed ampoules of formaldehyde that are made by dissolving polymerized formaldehyde (paraformaldehyde) in dH2O under nitrogen. Alcohol fixatives preserve morphology by precipitating proteins and nucleic acids, and can result in greater accessibility for FISH probes over cross-linking fixatives. However, precipitation causes significant contraction of neighboring molecules and can visibly alter cellular morphology. The addition of acetic acid, which causes cellular swelling, can counteract alcohol induced contraction.
Pellet ~2 × 10⁸ cells from an exponentially growing culture (approx. 2 ml at OD = 0.2) by centrifugation at 5000 × g for 3 min at room temperature. This quantity of cells is sufficient for a single FISH experiment including lysozyme optimization.
Resuspend cell pellet thoroughly in 1 ml 2.5% formaldehyde in PBS by gently pipetting up and down.
Incubate tube at room temperature for 15 min, then on ice for an additional 30 min.
Wash cells three times in 250 μl ice-cold PBS by repeated centrifugation (5000 × g for 2 min at 4 °C). Resuspend the cell pellet in 200 μl ice-cold PBS, and store at 4 °C up to 1 month (cross-links reverse slowly in aqueous conditions).
3.2.2. Lysozyme Treatment
Prior to hybridization, cells must be permeabilized with lysozyme to allow probe entry. This step varies significantly between bacterial species, with gram positives requiring more vigorous treatment. However, even within a species cell wall composition is affected by genotype and growth conditions, and the activity of lysozyme stocks can vary. Overdigestion can undermine the membrane integrity to the point that cells burst, and underdigestion prevents adequate probe penetration. In our experience, improper lysozyme digestion is the most common cause ofpoor FISH signals, and it is well worth the effort to optimize lysozyme treatment for every experiment.
Pellet 200 μl fixed cells (5000 × g for 2 min at room temperature) and resuspend in 45 μl GTE.
Add 5 μl diluted lysozyme (freshly diluted to 25 μg/ml in GTE from frozen 10 mg/ml stock), place into a 37 °C heated block, and start a timer.
At 1-min intervals, transfer 5 μl cells to 45 μl ice-cold GTE. Take a total of six samples. Place all tubes in ice.
With the flat side of a pipette tip, spread 5 μl of each sample (keeping the rest of the sample on ice) onto a ~20 × 20 mm area on a poly-l-lysine coated slide and allow to dry 10 min on the bench.
Assemble four staining dishes containing room temperature PBS, 70% ethanol (in dH2O), 85% ethanol, and 100% ethanol. Alcohol baths can be reused in later steps.
Place the five slides into a staining rack and immerse into the four dishes in order of increasing ethanol for 1 min each then dry the slides with compressed air.
Apply 3 μl PBS with 0.3 ng/μl DAPI, add coverslip, and image cells.
A range of cell morphologies should be observed with shortest lysozyme treatments appearing completely intact and the longest treatments appearing burst with DNA outside the cell (Fig. 2). The optimal lysozyme treatment for FISH will have mostly intact cells but a few (1–5%) burst cells. If no burst cells are observed in the longest incubation sample, place the undiluted reaction at 37 °C for additional time.
Spread 10 μl diluted cells from the best time point over the entire area (~20 × 40 mm) of a poly-l-lysine-coated slide and allow to dry 20 min on the bench (use a desiccator in humid conditions).
Fig. 2.

Lysozyme test slides show underdigested, correctly digested, and overdigested cells. Formaldehyde fixed E. coli were permeabilized with lysozyme and incubated for the indicated times and stained with DAPI before imaging with a 100× objective. By 4 min in this example some cells have lost their integrity, but many high-quality cells remain for analysis. Bar is 5 μm
3.2.3. Denaturation and Hybridization, Immersion Method
Traditionally, genomic DNA is denatured in a large volume of hot denaturing solution containing 50–70% formamide, followed by ethanol dehydration and addition of denatured probe DNA in hybridization buffer. An alternative method is provided (Subheading 3.2.4), in which genomic DNA and probe DNA are denatured simultaneously directly in hybridization buffer using a thermal cycler or heated block.
Mix 1–2 μl labeled probe DNA (~60 ng/μl in TE) with 10 μl 1.2× hyb buffer. Add dH2O to 12 μl if necessary.
Denature probe DNA for 5 min at 80 °C then place on ice.
Wash the slides in fresh PBS for 5 min at room temperature, then in 70%, 85% and 100% ethanol for 1 min each. Dry the slides gently ~2–5 s with compressed air. Chill the 70% ethanol on ice for a later step.
Place the slides into 50 ml preheated denaturing solution for 5 min at exactly 75 °C in a heated water bath. Temperature is critical; place a clean thermometer directly in denaturing solution.
Dehydrate again by transferring the hot slides into ice-cold 70% ethanol, then room temperature 85% and 100% ethanol for 1 min each. Dry the slides gently with compressed air and proceed immediately to the next step or store the slides in a desiccator.
Apply the denatured probe (12 μl) to the center of a 40 mm coverslip and place inverted slide onto the coverslip to avoid air bubbles. Hydrophobic plastic hybridization slips (ThermoFisher Scientific) result in a more even distribution of hybridization buffer over the slide surface.
Seal edges of coverslip with rubber cement and place the slides into a prewarmed hybridization chamber at 37 °C. Hybridize in the dark for 12–24 h.
3.2.4. Denaturation and Hybridization, Dry Block Method
Immerse the slides in 50 ml fresh PBS for 5 min at room temperature, then in 70%, 85% and then 100% ethanol for 1 min each. Dry the slides gently ~2–5 s with compressed air.
Mix 1–2 μl labeled probe DNA (~60 ng/μl in TE) with 10 μl 1.2× hyb buffer. Add dH2O to 12 μl if necessary.
Apply probe mixture to the center of a 40 mm coverslip (plastic or glass) and lower an inverted slide onto the coverslip, and seal the edges with rubber cement.
Place the slides into an in situ PCR block, and program the cycler for 80 °C for 5 min then 4 °C for 3 min (temperature ramp times account for slide thickness). Alternatively, two solid aluminum blocks (dry incubation blocks turned upside down) at 80 °C and 4 °C may be used.
Transfer the slides into a prewarmed hybridization chamber and hybridize in the dark at 37 °C for 12–24 h.
3.2.5. Washing and Mounting
To remove unhybridized probe and nonspecific hybrids, a series of washes is performed with increasing stringency. Usually only weakly stringent washes are sufficient to remove nonspecific hybridized probe, but the slides can be rewashed under more stringent conditions if excessive background is present (see Note 3).
Carefully remove rubber cement from the coverslips, but do not remove coverslips from the slides.
Immerse the slides in 50 ml room temperature 2× SSC with gentle agitation. Coverslips should come off easily in the buffer. Do not pull, pry, or slide coverslips.
Wash the slides in 50 ml 37 °C 2× SSC 50% formamide for 10 min with gentle agitation (rotary platform).
Wash the slides again in 37 °C 2× SSC then once in room temperature 2× SSC (10 min each). Drain the slides.
(Optional) If using an antibody to detect probe, add 0.1% Tween 20 to above washes. Drain the slides, apply 50 μl blocking buffer, incubate for 15 min at room temperature. Drain the slides, apply 50 μl diluted antibody in blocking buffer, and incubate for 1–6 h in hybridization chamber at room temperature. Wash the slides three times with 500 μl PBS containing 0.1% Tween 20 for 5 min each at room temperature. Repeat blocking, annealing, and washing steps if using a secondary antibody. Drain the slides.
Allow the slides to dry 30 min on the bench then add 10 μl mounting medium with 0.3 μg/ml DAPI (optional). To aid spatial alignment of multiple channels (colors) of the same field, add diluted multifluorescent beads (e.g., TetraSpeck Microspheres, ThermoFisher Scientific) in the mounting medium.
Seal edges of coverslips with nail polish. The slides may be stored temporarily at 4 °C or for several months at −20 °C.
3.3. Imaging and Analysis
3.3.1. Image Acquisition and Processing
To maximize signal detection, it is important to utilize as much of the dynamic range of your CCD sensor as possible. With typically dim FISH signals, this means taking very long exposures (up to several seconds) with an antivibration table to reduce blurring. It is also important to equalize signals among all colors (channels) by adjusting exposure times and output of the excitation light source. For most applications, increasing sensitivity by pixel binning is not an option with bacterial FISH due to loss of spatial resolution. Acquisition of multiple images through the z-axis allows the capture of signals on the nucleoid periphery that might be outside the focal plane. Subsequent deconvolution to reduce out of focus light can result in a higher signal-to-noise ratio. Pixel shift, or misalignment of phase contrast and fluorescent images taken of a single field, is caused primarily by slight changes in the angles of dichroic mirrors or the filter cubes themselves. Post-acquisition image alignment is facilitated by the addition of multifluorescent beads on the slide.
Take several test exposures with each filter set and adjust exposure times such that average signal brightness (pixel grey value) is ~10–50% of the capacity of the CCD sensor. This will allow subsequent 2× bright signals to fall within the range of the camera. Use a nonhybridized slide as a negative control.
Take final images using the same optimized acquisition settings for each channel. Scan over the entire slide surface, as some regions will have better signals than others. Be sure that each image contains at least one fluorescent bead.
Adjust brightness and contrast settings for each channel as needed to visualize fluorescent signals (e.g., Fig. 3). Importantly, these steps only affect how the 16-bit CCD image (65,536 grey values) is scaled for viewing on an 8-bit monitor (256 grey values), they do not change the raw image data or affect downstream image analysis as long as images are not saved as 8-bit conversions.
Align individual channel images using the multifluorescent beads as a reference.
For 3D applications, obtain three to five z-axis images for each channel. Perform deconvolution (these steps alter the raw image data). Some deconvolution algorithms are additive (increasing overall image brightness), and thus raw images must be well below the bit depth dynamic range to avoid pixel saturation. Proprietary deconvolution algorithms differ widely among and within different software packages, and must be chosen empirically with your particular images.
Fig. 3.
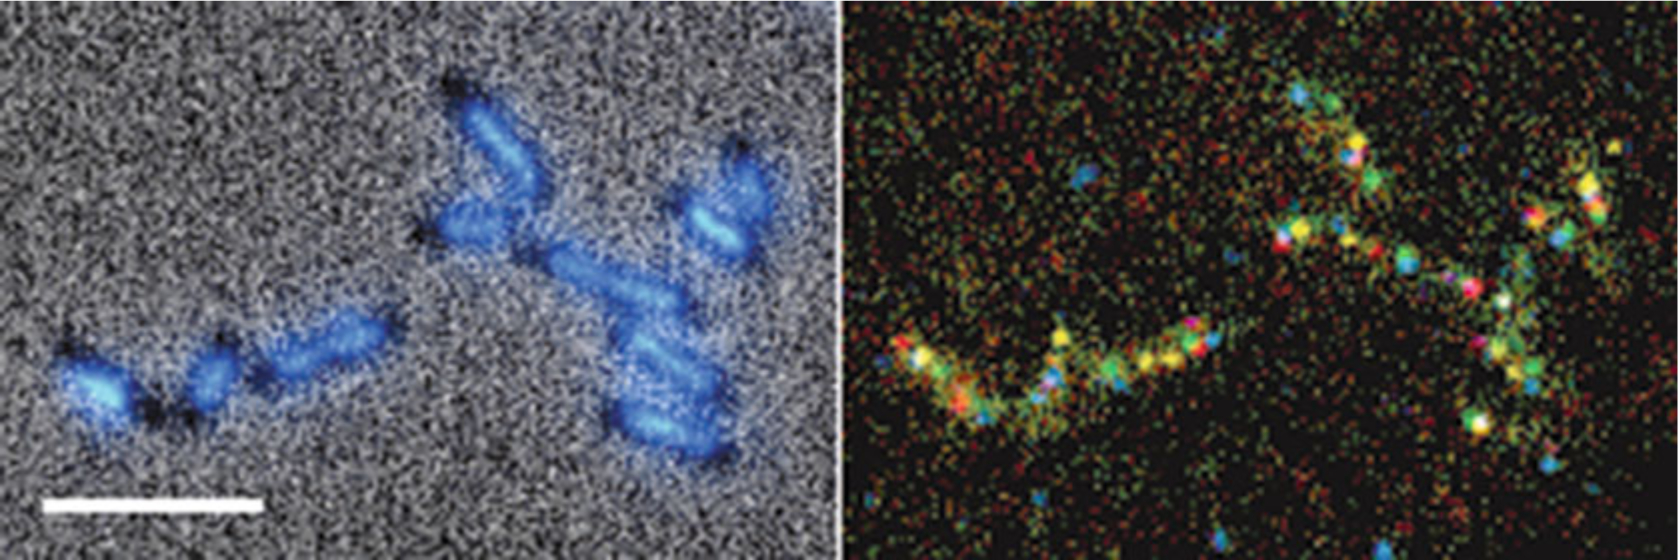
Five-color FISH with DAPI in E. coli. Phase contrast with DAPI fluorescence image (left panel). Combined 5-color FISH image (right panel). E. coli cells exponentially growing in minimal media (containing ≤2 chromosomes) were hybridized with 3 kb probes targeted to five equally spaced (~500 kb) sites on the E. coli chromosome. Probes were labeled by nick translation with the following nucleotide base conjugates: digoxigenin-dUTP secondarily detected with anti-digoxigenin BV480 (blue), AF488-dUTP (green), AF546-dUTP (yellow), AF594-dUTP (red), and AF647-dUTP (magenta). Brightness and contrast of color channels were independently adjusted and merged into a composite image in Axiovision. Bar is 5 μm
3.3.2. Signal Calling and Quantification
FISH signals at well-separated loci appear as round, diffraction-limited spots (foci) with a radius (width of the point spread function) determined by the microscope optics and wavelength of light imaged (infra-red foci are approx. twice the size of blue foci). Spot detection programs, such as FocusCounter [9], Spatzcells [10], FindFoci [11], MicrobeTracker [12], and Oufti [13], find and characterize foci by fitting signal intensity profiles to a Gaussian function. Signals resulting from hybridization of probe to target DNA can be discriminated from background signals (free dye molecules, cross-fluorescence, or autofluorescence) by selecting foci with the highest intensity. These programs also automatically detect cell outlines (segmentation) for numeration of foci per cell and localization of foci within cells. As the efficiency of detecting any given locus is always less than 100%, focus counts will underrepresent the actual number of spatially separate loci in the cell. When accurate focus counting is important (e.g., using FISH to determine the frequency of segregated loci), measured counts can be adjusted upward by the factor of detection inefficiency, which is calculated from target copy number (e.g., by qPCR or flow cytometry) and the fraction of cells exhibiting zero foci [5].
4. Notes
Although paraformaldehyde depolymerizes to formaldehyde in water, some manufacturers may still label solutions as paraformaldehyde. Aqueous formaldehyde decomposes rapidly when exposed to air and heat, precipitating and oxidizing to formic acid, and should be made fresh from a sealed ampoule for every experiment. Formaldehyde is highly toxic and gloves should be worn when handling concentrated solutions under a fume hood.
Resulting fragment sizes in nick translation reactions are also dependent on the ratio of DNA Pol I and DNase I, and we have found that an activity ratio of 100:1 (0.6 U/μl/h DNA Pol I and 0.006 U/μl/h DNase I) produces ideal fragment sizes in 3 h. However, variations in enzyme activity of commercially supplied stocks may result in fragment sizes that are over or under the optimal 200–500 bp range. In these cases, the concentration of DNase I should be increased or decreased, respectively, to produce the desired fragment size. For this reason, new enzyme stocks should be tested prior to use.
High background as indicated by abundant signals (foci) in and around cells can be caused by a number of factors including improperly cleaned slides, excessive debris in cell samples, or inadequate washing after hybridization. Signal over the entire nucleoid indicates additional stringent washes are required.
Acknowledgments
We thank Beth Weiner, Nancy Kleckner, Sota Hiraga, and Lucy Shapiro for sharing their detailed FISH protocols, which formed the basis of our methods. We thank Jeff Carmichael (Chroma Technology Corp) for technical assistance with fluorescent filters, and Po J. Chen and Anna K. Barker for comments on the manuscript. All work was supported by NIH Grant GM102679 to D.B.
References
- 1.Wang X, Montero Llopis P, Rudner DZ (2013) Organization and segregation of bacterial chromosomes. Nat Rev Genet 14 (3):191–203. doi: 10.1038/nrg3375 [DOI] [PMC free article] [PubMed] [Google Scholar]
- 2.Possoz C, Filipe SR, Grainge I, Sherratt DJ (2006) Tracking of controlled Escherichia coli replication fork stalling and restart at repressor-bound DNA in vivo. EMBO J 25 (11):2596–2604 [DOI] [PMC free article] [PubMed] [Google Scholar]
- 3.Bates D, Kleckner N (2005) Chromosome and replisome dynamics in E. coli: loss of sister cohesion triggers global chromosome movement and mediates chromosome segregation. Cell 121(6):899–911. doi: 10.1016/j.cell.2005.04.013 [DOI] [PMC free article] [PubMed] [Google Scholar]
- 4.Sunako Y, Onogi T, Hiraga S (2001) Sister chromosome cohesion of Escherichia coli. Mol Microbiol 42(5):1233–1241 [DOI] [PubMed] [Google Scholar]
- 5.Joshi MC, Bourniquel A, Fisher J, Ho BT, Magnan D, Kleckner N, Bates D (2011) Escherichia coli sister chromosome separation includes an abrupt global transition with concomitant release of late-splitting intersister snaps. Proc Natl Acad Sci U S A 108(7):2765–2770. doi: 10.1073/pnas.1019593108 [DOI] [PMC free article] [PubMed] [Google Scholar]
- 6.Niki H, Hiraga S (1997) Subcellular distribution of actively partitioning F plasmid during the cell division cycle in E. coli. Cell 90 (5):951–957 [DOI] [PubMed] [Google Scholar]
- 7.Magnan D, Joshi MC, Barker AK, Visser BJ, Bates D (2015) DNA replication initiation is blocked by a distant chromosome-membrane attachment. Curr Biol 25(16):2143–2149. doi: 10.1016/j.cub.2015.06.058 [DOI] [PMC free article] [PubMed] [Google Scholar]
- 8.Weiner BM, Kleckner N (2009) Assaying chromosome pairing by FISH analysis of spread Saccharomyces cerevisiae nuclei In: Keeney S (ed) Meiosis: volume 2, cytological methods. Humana Press, Totowa, NJ, pp 37–51. doi: 10.1007/978-1-60761-103-5_3 [DOI] [PubMed] [Google Scholar]
- 9.Joshi MC, Magnan D, Montminy TP, Lies M, Stepankiw N, Bates D (2013) Regulation of sister chromosome cohesion by the replication fork tracking protein SeqA. PLoS Genet 9(8): e1003673. doi: 10.1371/journal.pgen.1003673 [DOI] [PMC free article] [PubMed] [Google Scholar]
- 10.Skinner SO, Sepulveda LA, Xu H, Golding I (2013) Measuring mRNA copy number in individual Escherichia coli cells using single-molecule fluorescent in situ hybridization. Nat Protoc 8(6):1100–1113. doi: 10.1038/nprot.2013.066 [DOI] [PMC free article] [PubMed] [Google Scholar]
- 11.Herbert AD, Carr AM, Hoffmann E (2014) FindFoci: a focus detection algorithm with automated parameter training that closely matches human assignments, reduces human inconsistencies and increases speed of analysis. PLoS One 9(12):e114749. doi: 10.1371/journal.pone.0114749 [DOI] [PMC free article] [PubMed] [Google Scholar]
- 12.Sliusarenko O, Heinritz J, Emonet T, Jacobs-Wagner C (2011) High-throughput, subpixel precision analysis of bacterial morphogenesis and intracellular spatio-temporal dynamics. Mol Microbiol 80:612–627. doi: 10.1111/j.1365-2958.2011.07579.x [DOI] [PMC free article] [PubMed] [Google Scholar]
- 13.Paintdakhi A, Parry B, Campos M, Irnov I, Elf J, Surovtsev I, Jacobs-Wagner C (2016) Oufti: an integrated software package for high-accuracy, high-throughput quantitative microscopy analysis. Mol Microbiol 99 (4):767–777. doi: 10.1111/mmi.13264 [DOI] [PMC free article] [PubMed] [Google Scholar]