. 2019 Dec 23;8:e50161. doi: 10.7554/eLife.50161

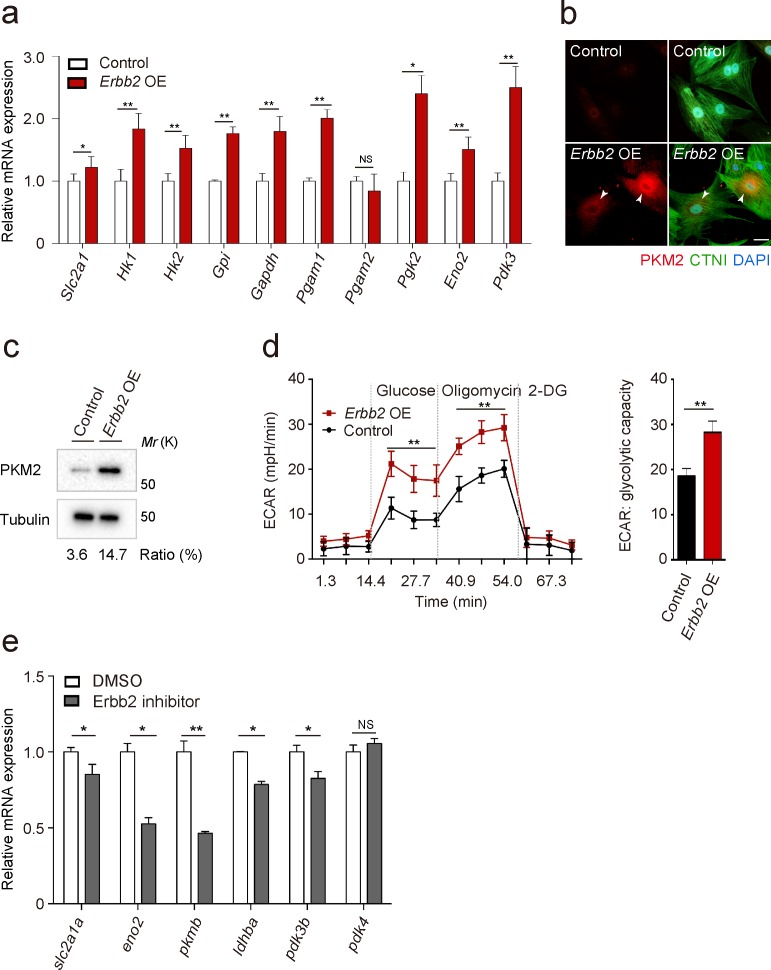
Figure 2. ERBB2 signaling activates glycolysis in cardiomyocytes.

(a) qPCR analysis of mRNA levels of glycolytic enzyme genes in control and Erbb2 overexpressing (OE) rat neonatal CMs (n = 3). Error bars, s.e.m. (b) Staining for PKM2, CTNI and DNA (DAPI) in control and Erbb2 OE rat neonatal CMs; arrowheads point to PKM2+ CMs. (c) Western blot analysis of PKM2 levels in control and Erbb2 OE rat neonatal CMs. (d) Extracellular acidification rate (ECAR) analysis in control and Erbb2 OE rat neonatal CMs; glycolytic capacity shown on the right (n = 7). Error bars, s.d. (e) qPCR analysis of mRNA levels of glycolytic enzyme genes in DMSO and Erbb2 inhibitor treated zebrafish hearts (n = 3). Error bars, s.e.m.; *p<0.05 and **p<0.001 by two-tailed unpaired t-test. NS, not significant. Scale bar, 20 μm.

Figure 2—source data 1. Mass spectrometry data.
P7 WT and CAERBB2 OE mouse hearts were isolated and protein expression levels analyzed by mass spectrometry. All presented proteins are statistically significant at p<0.05.
elife-50161-fig2-data1.docx (343.6KB, docx)
Figure 2—source data 2. Primer sequences for qPCR analysis.
Primer sequences used in Figure 2a and e.
elife-50161-fig2-data2.docx (548.1KB, docx)
Figure 2—source data 3. Mean Ct values of qPCR analysis in Figure 2a and e.
elife-50161-fig2-data3.docx (442.2KB, docx)

Figure 2.

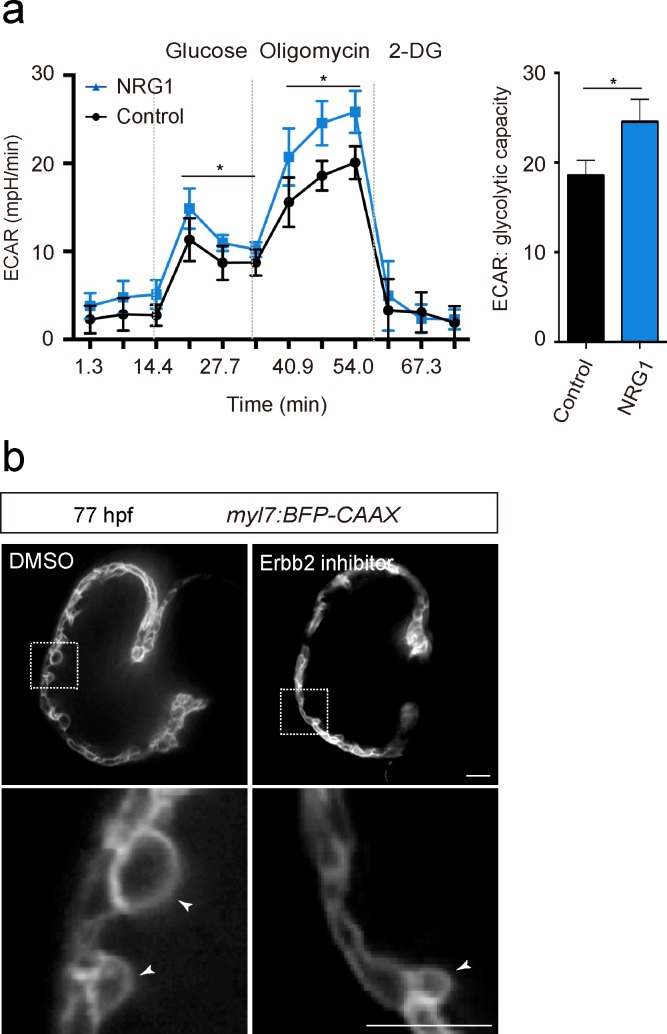
Figure 2—figure supplement 1. NRG1/ERBB2 signaling activates glycolysis in CMs.

Figure 2—figure supplement 1.

(a) ECAR analysis in control and NRG1 treated rat neonatal CMs; glycolytic capacity shown on the right (n = 7). (b) Confocal images (mid-sagittal sections) of 77 hpf zebrafish hearts treated with DMSO or Erbb2 inhibitor; magnified view of area in white boxes shown below; arrowheads point to CMs in the trabecular layer. Error bars, s.d.; *p<0.05 by two-tailed unpaired t-test. Scale bars, 20 μm.
Figure 2—figure supplement 2. Uncropped images related to western blotting data.

Figure 2—figure supplement 2.