. 2019 Dec 23;8:e50163. doi: 10.7554/eLife.50163

Figure 1. Single-cell mRNA sequencing identifies different cardiomyocyte-populations in the injured zebrafish heart.

(a) Schematic of cryoinjury procedure on adult TgBAC(nppa:mCitrine) fish and immunohistochemistry on section of injured TgBAC(nppa:mCitrine) heart 7 dpi. Overview image on left and zoom-in of boxed region on the right. Mef2 (in magenta) labels cardiomyocytes, nppa:mCitrine (in green) marks the borderr zone, and PCNA (in cyan) marks proliferating cells. Arrows indicate triple-positive cells. Dashed line indicates injury site. Scale bar in overview 50 μm. Scale bar in zoom-ins 20 μm. (b) Experimental outline of the single-cell mRNA-sequencing of injured zebrafish hearts (blue, injury area; green, border zone) (c) Pairwise correlation between individual cells across all genes detected. Color-code indicates cell-to-cell distances measured by [1 – Pearson’s correlation coefficient]. StemID clusters are indicated by color and number on the x- and y-axis. (d) t-distributed stochastic neighbor embedding (tSNE) map representation of transcriptome similarities between individual cells. (e) tSNE maps visualizing log2-transformed read-counts of the border zone marker genes nppa, mustn1b and vmhc.

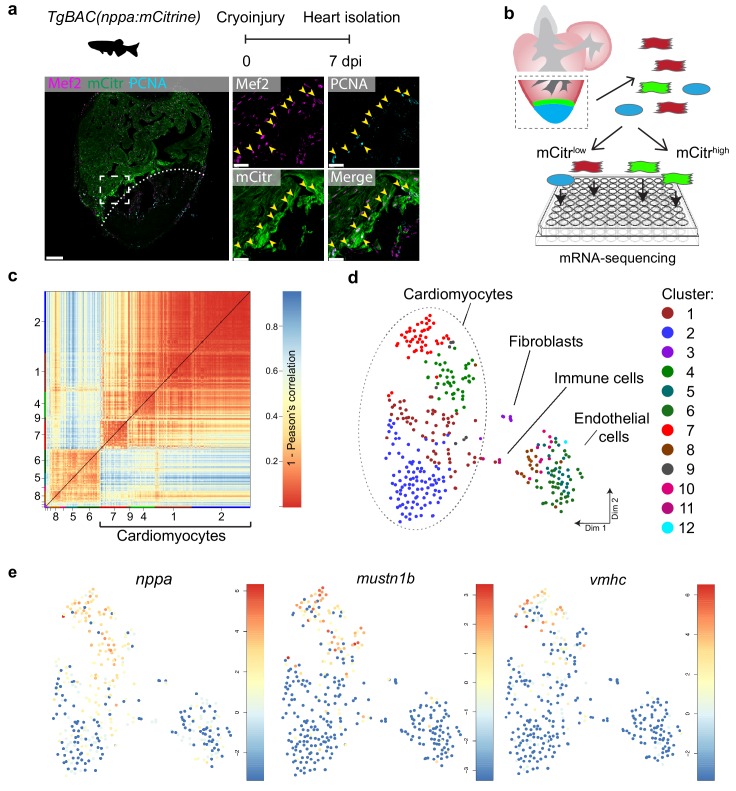
Figure 1—source data 1. Single-cell mRNA sequencing data from cryoinjured TgBAC(nppa:mCitrine) zebrafish hearts at 7 dpi.
Raw reads are represented per gene (rows) and single cell (columns).
Figure 1—source data 2. List of the clusters in the adult injured heart (raw data see SD1), as identified by StemID and the associated cells per cluster.
Figure 1—source data 3. List of differentially expressed genes between cardiomyocytes clusters 2 and 7 of the adult heart dataset.
Only genes with a p-value<0.05 are listed. Per gene, the log2 fold change, adjusted p-value (padj) and associated gene name are given. GO-terms for genes upregulated between clusters 2 and 7 (p<0.01) are listed in separate excel sheets.

Figure 1.

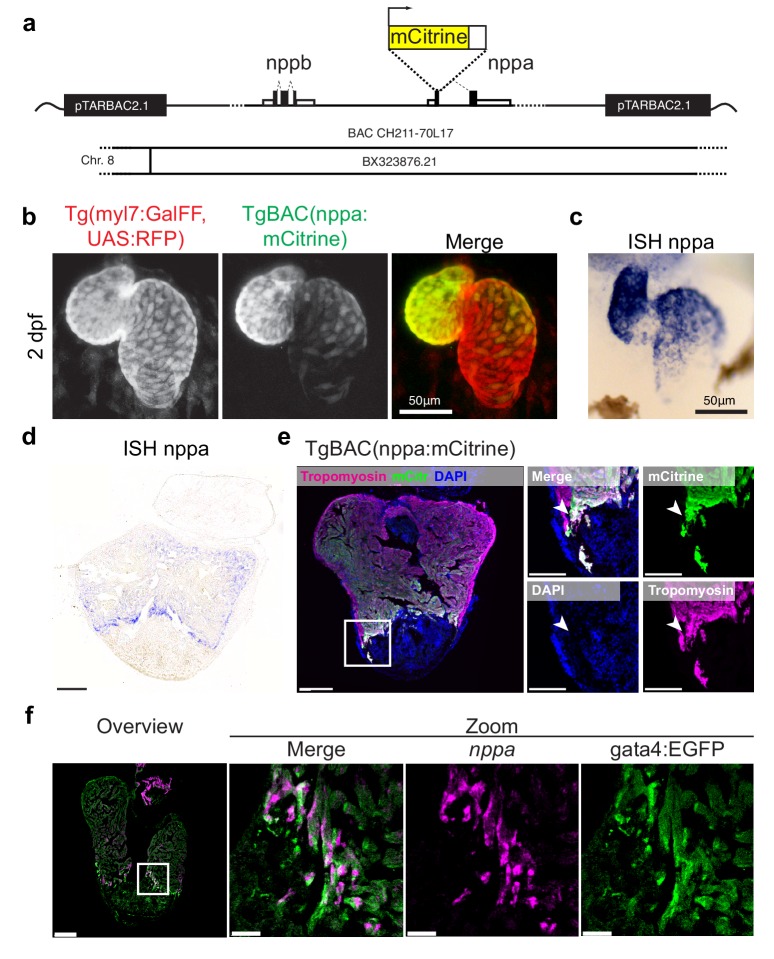
Figure 1—figure supplement 1. TgBAC(nppa:mCitrine) expression recapitulates endogenous nppa gene expression.

Figure 1—figure supplement 1.

(a) Design of the bacterial artificial chromosome (BAC) used for generation of the transgenic line TgBAC(nppa:mCitrine). (b) Transgenic mCitrine expression in the heart in relation to RFP expression in the whole myocardium of Tg(myl7:GFF, UAS:RFP, nppa:mCitrine) in embryos at 2 days post-fertilization (dpf). (c) Whole mount in situ hybridization for endogenous nppa expression in embryos at two dpf. Note the specific expression in ventricle and atrium and absence of expression in atrioventricular canal of the nppa:mCitrine transgene expression (in panel b) as well as for the endogenous nppa expression (in panel c). (d, e) Endogenous nppa expression (d) and nppa:mCitrine expression (e) in the adult heart at 7 days post-injury (dpi). Note expression of nppa:mCitrine in the cortical borderzone (arrowheads). (f) Fluorescent in situ hybridization for nppa performed on gata4:EGFP hearts 7dpi. Note the overlap of nppa and gata4:EGFP in trabecular borderzone cardiomyocytes.
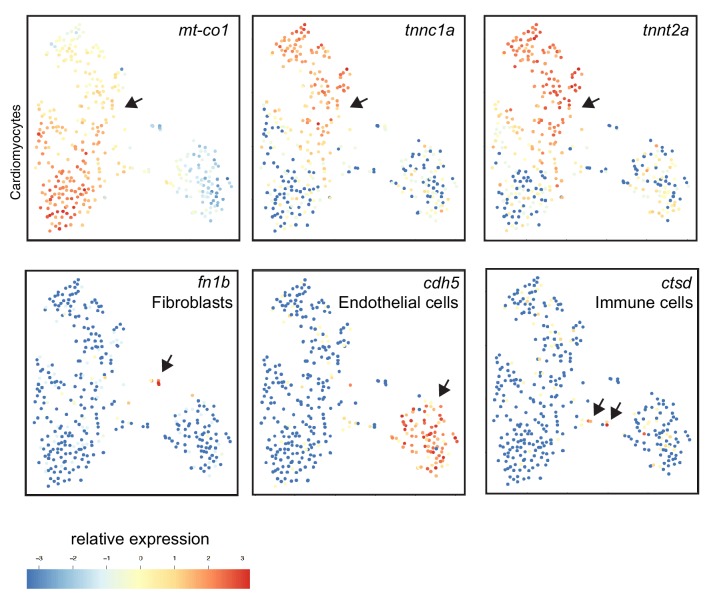
Figure 1—figure supplement 2. Single-cell mRNA sequencing identifies different cell-populations in the injured zebrafish heart.

Figure 1—figure supplement 2.

tSNE maps visualizing log2-transformed read-counts of genes with high expression in cardiomyocytes (mt-co1, tnnc1a, tnnt2a), in fibroblasts (fn1b), in endothelial cells (cdh5) and immune cells (ctsd). Arrow indicates positive cell populations.
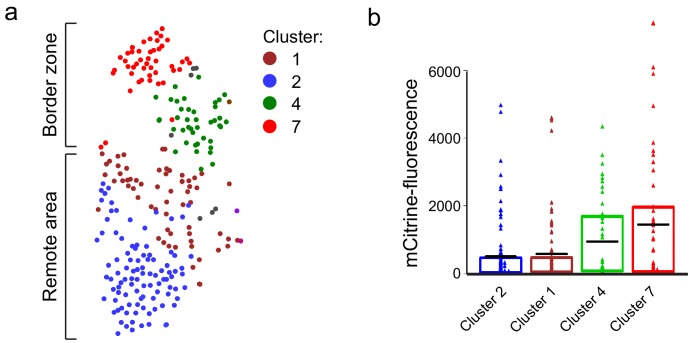
Figure 1—figure supplement 3. Cluster 7 cells display highest nppa:mCitrine expression.

Figure 1—figure supplement 3.

(a) tSNE map of the cardiomyocyte clusters derived from the single-cell mRNA-sequencing. (b) mCitrine fluorescence levels of the nppa:mCitrine FACS sorted cells from injured hearts that were used for the single-cell RNA-sequencing. Triangles represent individual cells of the four cardiomyocyte clusters. The box indicates the 25–75% quartiles, black lines indicate mean-fluorescence per cluster.
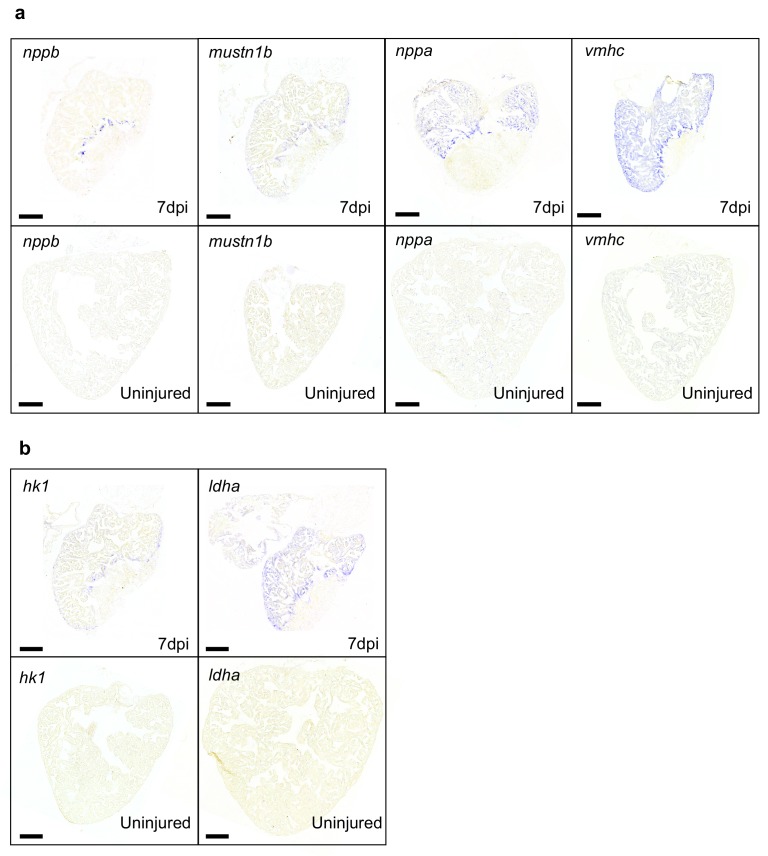
Figure 1—figure supplement 4. Enhanced expression of genes elevated in cluster 7 versus cluster 2 is injury induced.

Figure 1—figure supplement 4.

(a) In situ hybridizations for border zone genes nppb, mustn1, nppa and vmhc in zebrafish hearts at seven dpi compared to uninjured hearts. (b) In situ hybridizations for glycolysis genes hk1 and ldha in zebrafish hearts at seven dpi compared to uninjured hearts. Staining for injured and uninjured hearts was stopped simultaneously. Scale bars indicate 200 μm. (n = 3 per condition).