

Abstract
Objective:
Global and national trends of out-of-hospital cardiac arrest (OHCA) have been examined, however geographic variation and socioeconomic disparities of OHCA outcomes in the community setting are less understood. We developed and tested a replicable, community-oriented assessment strategy aimed to identify spatial variations in OHCA outcomes using socioeconomic, prehospital, and in-hospital factors.
Methods:
Emergency medical service records of adult, non-traumatic OHCA within Alachua County, FL (2012-2017) were retrospectively reviewed and matched to corresponding medical records at the University of Florida (UF). Incidence of cardiac arrest was geocoded to census tracts and connected to U.S. census socioeconomic attribute data. Primary outcomes include survival to emergency department (ED), hospital admission, discharge, and discharge to home. Multilevel mixed-effects logistic regression models were developed to assess sub-county geographic variance, probabilities of survival, and prehospital risk factors. Getis-Ord Gi statistic and Moran’s I-test was applied to assess spatial clustering in outcome survival rates.
Results:
Of the 1562 OHCA cases extracted from EMS records, 1335 (85.5%) were included with 372 (27.9%) transported to study site ED. Predicted probability of survival to ED was 57.0% (95CI: 51.3–62.3%). Of transported cases to study site ED, predicted probabilities of survival was to 41.7% (95CI: 36.1–47.6%) for hospital admission, 16.1% (95CI: 10.7–23.5%) for hospital discharge, and 7.1% (95CI: 3.7–13.3%) for home discharge. Census tracts accounted for significant variability in survival to ED (p<0.001), discharge (p=0.031), and home discharge outcomes (p=0.036). There was no significant geographic variation in survival to admission outcome. Neighborhood-level factors significantly improved model fit for survival to ED, discharge, and discharge home outcomes. Multiple modifiable patient- and neighborhood-level variables of interest were identified, including rural-urban differences.
Conclusion:
We identified important geographic disparities that exist in OHCA outcomes at the community level. By using a replicable schematic, this variation can be explained through community-oriented modifiable socioeconomic and prehospital factors.
Keywords: Out-of-Hospital Cardiac Arrest, Spatial Distribution, Chain of Survival, Neurological Outcomes, Community-Based, Prehospital
INTRODUCTION
Death and disability from out-of-hospital cardiac arrest (OHCA) are a major public health challenge in the United States, where OHCA accounts for approximately 350, 000 deaths annually [1]. Twenty five percent of OHCA treated by Emergency Medical Services (EMS) have no symptoms before onset of arrest [2]. The American Heart Association (AHA) introduced the concept of the ‘chain of survival’ in 1991, which refers to chain of events that has to occur in succession to increase the odds of survival after cardiac arrest [3]. Despite recent reports of improvement in survival rates by specific cardiac arrest registries [4, 5], overall rates of survival-to-discharge have remained the same in the last three decades [6], with only 12 percent of OHCA patients surviving to discharge according to the AHA.
Disparities in survival rates have been documented. Nichol et al. reported variation that ranged from 3% to 16% across ten study sites in the US [7]. These variations may be explained by modifiable factors such as rate of bystander cardiopulmonary resuscitation (CPR), access to public defibrillators, and prehospital care. Variations may also be caused by geographic characteristics, differences in patient demographics and baseline health status, and regions’ social deprivation factors. Multiple studies have analyzed factors that contribute to regional variations, identifying areas with low bystander CPR rates [8–11], high OHCA incidence rates [4,12], or high risk areas where there was a combination of both [13–15]. Okubo et al. found variations in patient outcomes after OHCA amongst 112 EMS agencies in North America that could not be explained by patient-level and EMS agency-level variables [32]. More recent studies aimed at identifying variation of OHCA outcomes also acknowledge the importance of adjusting for geographic socioeconomic disparities [31].
The goal of this study was to assess sub-county geographic patterns of OHCA survival outcomes and identify prehospital, medical, and local neighborhood characteristics that influence these outcomes within the context of a socioeconomically diverse setting. Identifying the geographic disparities, sociodemographic risk factors, and prehospital characteristics can help develop an evidence-based strategy to create policies for public health initiatives at the community setting and guide future allocation of resources in order to improve outcomes.
METHODS
Study Design
This was a retrospective analysis of OHCAs within Alachua County between January 2012 and January 2017. Prehospital data were obtained from the local EMS agency (Alachua County Fire Rescue). This included prehospital data such as age, gender, location of arrest, witness arrest, bystander CPR, bystander automated external defibrillator (AED) use, and initial cardiac rhythm, and EMS response time data. Records with defined dispatch locations and dispatch time stamps were included. Pediatric cardiac arrests (<18 years) and cardiac arrest with traumatic etiology were excluded. EMS records were matched to medical records at the University of Florida. In-hospital patient-level data, including hospital disposition, were obtained from medical records.
Locations of cardiac arrests were geocoded using dispatch address using ArcGIS (ESRI, Redlands, CA). Each geocoded location was spatially joined to corresponding 2010 census tract using TIGER/Line Shapefile obtained from U.S. Census Bureau [18]. Census tract attribute data, including racial, age, income, and household factors, were obtained from the U.S. Census Bureau. Rural-urban classification was derived from the USDA Economic Research Service 2010 Rural-Urban Commuting Area (RUCA) coding classification [19, 20].
Primary outcomes for this study were survival to ED, hospital admission, discharge, and discharge with CPC score of 1 or 2. Home discharge status without need for acute rehabilitation at hospital disposition was used as a surrogate to imply a CPC 1 or 2 [33]. Category 1 represents good cerebral performance; category 2, conscious patients with moderate cerebral disability. Patients with a CPC of 1 or 2 at discharge were considered to have favorable neurologic outcome.
This study was approved by the University of Florida Institutional Review Board, which waived the requirement of informed consent because the analysis included only de-identified data.
Study Setting
Alachua County is located in North Central Florida covering covers approximate 2510 km2 and has a population estimate of 263,496 people. Population dynamics is largely reflected by the presence of the University of Florida at the center of the urbanized area within the county. Thirteen point four percent (13.4%) of the population are ages 65 years and over with 70.2% of the population is classified as Caucasian/White and 20.6% as African American/Black. Median household income in Alachua County is $44,702, lower than the national median income, and 24.2% of individuals are below poverty level according to 2012-2016 American Community Survey 5-Year Estimates.
There are two 911-response providers in Alachua County, Alachua County Fire Rescue (ACFR) and Gainesville Fire Rescue (GFR). The Alachua County Combined Communications Center is the county’s public safety answering point and manages law enforcement, fire, and EMS calls.
Response metrics are recorded on the Computer Aided Dispatch software interface. ACFR receives approximates 35,000 calls per year, with approximate 20,500 of these calls resulting in transports to the hospitals in the area. GFR typically is dispatched to provide first response within the city of Gainesville but does not provide ambulance transport. The closest unit is dispatched to a priority 1 call. For cardiac arrest or other medical problems that may result in an arrest, both an ambulance and a fire unit will be dispatched.
The University of Florida Health is located in Gainesville, FL is a 996-bed tertiary care center, with over 200 intensive care beds. The ED of the hospital is a level 1 trauma center, serving as the regional tertiary receiving care for transplant, trauma, burn, and complex critically ill patients for large parts of Florida and the neighboring states. There is a central pharmacy, access to radiology, and laboratories in close proximity to the ED. This hospital discharges approximately 124,000 patients per year. Cardiac catheterization is available around the clock, and TTM is being implemented routinely in compliance with international guidelines.
Statistical Analysis
Descriptive statistics were initially calculated for the population and summarized. Patient risk factors and census determinants associated with outcomes were assessed using chi-square test for nominal variables and one-way ANOVA for continuous variables. Associations with survival to admission, discharge, and home discharge analyses were conducted using matched inpatient medical records. Missing data were multiply imputed via a fully conditional specification algorithm using the BLImP software application [21].
Geographic variation between census tracts and primary outcomes was assessed using an unconditional multilevel logistic regression model, where incidences (level 1) were nested in respective census tracts (level 2). Each of the four primary outcomes were modeled independently. Predicted probabilities of survival and intraclass correlation coefficients (ICC) were calculated to identify the variability in survival rates explained by census tracts [22]. Patient-level variables (e.g. prehospital factors and inpatient clinical data) and, subsequently, census-level variables (e.g. socioeconomic demographics) were subsequently added to the models as fixed effects. Improvement in model fit between the unconditional, patient-level only, and patient-level and census-level models was assessed using a likelihood ratio test using the −2 log likelihood statistics [27]. Spatial clustering was further explored using the application of two spatial statistic tools, Getis-Ord Gi (Hot Spot Analysis) and Anselin Local Moran’s I (Outlier Analysis) [23–26].
Statistical analyses was conducted using SAS 9.4 (SAS Institute, Cary, NC). Spatial analysis was conducted using ArcGIS 10.5 (ESRI, Redlands, C). Full details on multiple imputation procedures and analyses are described in supplementary material.
RESULTS
During the study period, ACFR responded to 1562 OHCA incidences. Application of inclusion and exclusion criteria resulted in 1335 (85.5%) eligible incidence for survival to ED analysis and 372 for in-hospital survival analysis. Of the 372 eligible in-hospital cases, 319 (85.9%) were successfully matched with in-hospital records. Figure 1 displays the flow diagram of case inclusion and exclusion for the study population
Figure 1:
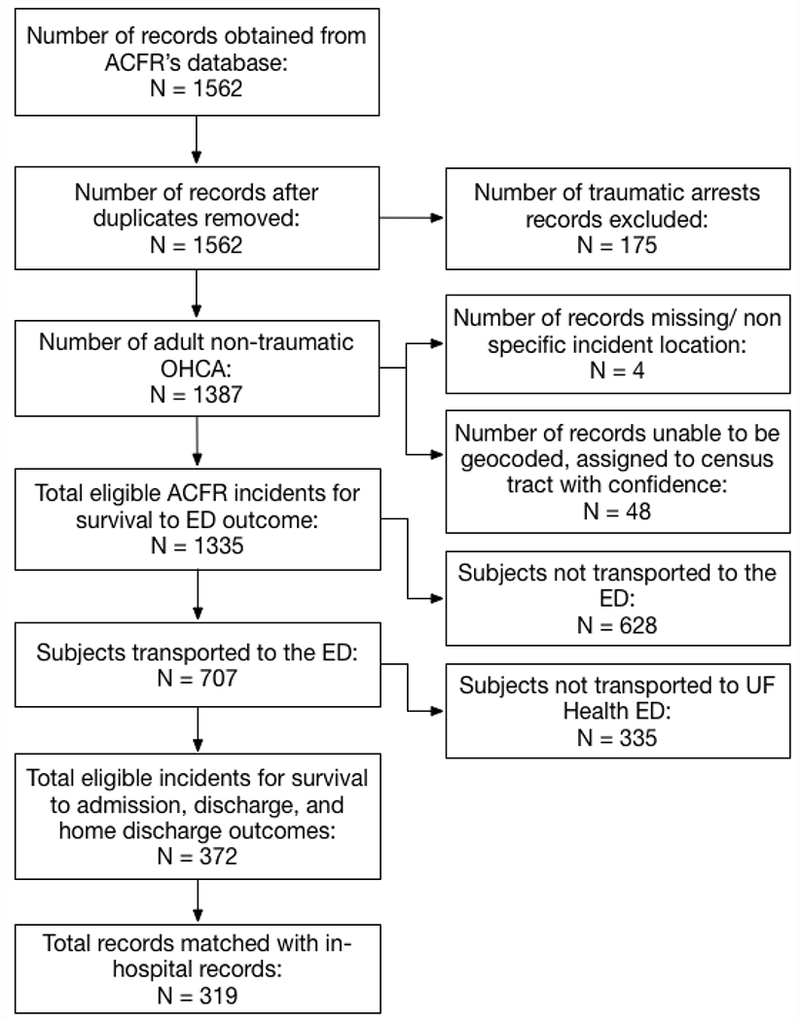
Flowchart of inclusions and exclusions of OHCA incidences responded by Alachua County Fire Rescue from January 2012 through January 2017.
Descriptive and Unadjusted Statistics
Study population demographics are displayed in Table 1. The mean age of all eligible cases was 66.3 ± 16.9 years, where 541 (40.5%) were female and 350 (26.2%) were Black or African American. Crude survival rate to the ED was 55.0% (n=734). Relative to the subset who survived to ED admission to study site ED (n=319), 39.8% subjects survived to hospital admission, 16.3%, survived to hospital discharge, and 8.5% survived to home discharge. In the study population, 540 (41.7%) arrests were witnessed and 310 (24.0%) were specifically witnessed by a lay person (non-healthcare provider). 400 (42.9%) arrest victims received bystander CPR, while 68 (7.3%) received bystander AED (analyze or shock). The majority of incidences occurred before EMS arrival, at the subject’s home address, and between afternoon-evening hours. Average time for EMS to arrive on scene from dispatch was 7.43 minutes while the average time to arrive at the ED from scene departure was 14.5 minutes with an average patient transport distance of 6.10 miles. Average time EMS was on scene was 10.18 minutes.
Table 1:
Variable definitions and descriptive statistics of primary outcomes, patient-level determinants and census-level determinants of study population.
| Variable Type | Study Population (n=1335) | |
|---|---|---|
| Primary Outcomes | ||
| Survival to Emergency Department | Nominal | 734 (55.0) |
| Survival to Hospital Admission | Nominal | 127(39.8)* |
| Survival to Hospital Discharge | Nominal | 52 (16.3)* |
| Survival to Hospital Discharge (CPC 1–2) | Nominal | 27(8.5)* |
| Patient Level Predictors | ||
| Age, mean (SD) | Continuous | 66.3 (16.9) |
| Sex (% Female) | Continuous | 541 (40.5) |
| Race: | Nominal | |
| Black/African-American | 350 (26.2) | |
| White | 967 (72.4) | |
| Other/Unknown | 18(1.4) | |
| Witnessed Arrest: | Nominal | 540 (41.7) |
| Witnessed Arrest by Lay Person: | Nominal | 310 (24.0) |
| ROSC Prior to ED Arrival: | Nominal | 271 (20.3) |
| Bystander AED: | Nominal | 68 (7.3) |
| Bystander CPR: | Nominal | 400 (42.9) |
| Shockable Initial Rhythm (VF/FT): | Nominal | 181 (14.3) |
| Arrest at Home (vs. Public): | Nominal | 916 (68.6) |
| Cardiac Arrest Onset: | Nominal | |
| Before EMS Arrival | 1211 (90.7) | |
| After EMS Arrival | 124(9.3) | |
| Time of Day EMS Dispatch: | Nominal | |
| Morning to Afternoon (0000 – 1159) | 606 (45.4) | |
| Afternoon to Evening (1200 – 2359) | 729 (54.6) | |
| Time EMS Dispatch to Scene (min.), mean (SD) | Continuous | 7.43 (3.92) |
| Time EMS On Scene (min.), mean (SD) | Continuous | 10.18(6.71) |
| Time Scene Depart to ED (min.), mean (SD) | Continuous | 14.5 (6.15) |
| Transport Miles (mi.), mean (SD) | Continuous | 6.10 (5.44) |
| Census Level Predictors | ||
| Urban Core (1.0) | Nominal | 956 (71.6) |
| Metropolitan Area (2.0) | 379 (28.4) | |
| Percent Living Alone, mean (SD) | Continuous | 29.71(8.10) |
| Percent Uninsured, mean (SD) | Continuous | 13.20(5.26) |
| Percent College Graduate, mean (SD) | Continuous | 19.78(8.63) |
| Percent High School Graduate, mean (SD) | Continuous | 88.29(9.69) |
| Unemployment Rate, mean (SD) | Continuous | 7.09 (4.92) |
| Percent of Families in Poverty, mean (SD) | Continuous | 14.22 (10.61) |
| Percent 65 Years or Older, mean (SD) | Continuous | 11.93(5.86) |
| Percent 85 Years or Older, mean (SD) | Continuous | 1.72 (1.42) |
| Percent Female, mean (SD) | Continuous | 51.58(3.62) |
| Percent Black or African American, mean (SD) | Continuous | 22.9 (20.2) |
| Average Household Size, mean (SD) | Continuous | 2.35 (0.25) |
| Percent Vacant Housing Units, mean (SD) | Continuous | 11.22 (4.51) |
Frequencies relative to inhospital sample (n=319)
Unadjusted statistics yielded distinguishing associations between patient level factors, social demographics, and the four primary outcomes (Table 2). Arrests occurring in public, patients who had ROSC prior to ED arrival, and witnessed arrests were more likely to survive at all four outcomes. Patients receiving bystander CPR were more likely to survive to ED (OR: 4.1 [95CI 3.0 – 5.5]) and survival to hospital discharge (OR: 2.2 [95CI 1.2 – 4.2]) compared to those without survival. Bystander AED was associated with those who survived to hospital discharge with good neurological outcome (p=0.012). More neighborhood level associations were observed in relation to survival to ED outcome. Those living in more urban areas, areas with higher percentage of people living alone, and areas with a higher percentage of Black or African American demographic were more likely to survive to ED compared to those without survival.
Table 2:
Unadjusted associations patient-level and census-level determinants with study outcomes for total study population.
| Prehospital Outcome (n=1335) | In-hospital Outcomes (n=319) | |||||||||||
|---|---|---|---|---|---|---|---|---|---|---|---|---|
| Survival to Emergency Department | Survival to Hospital Admission | Survival to Hospital Discharge | Survival to Hospital Discharge (CPC 1-2) | |||||||||
| Patient Level Predictors | Yes (n=734) | No (n=601) | P-value | Yes (n=127) | No (n=192) | P-value | Yes (n=52) | No (n=267) | P-value | Yes (n=27) | No (n=292) | P-value |
| Age, mean (SD) | 65.2 (16.9) | 67.6 (16.8) | 0.009* | 61.3 (17.0) | 64.5 (17.4) | 0.114 | 58.2 (20.0) | 64.2 (16.8) | 0.023* | 52.0 (18.7) | 64.3 (18.8) | <0.001* |
| Sex (% female) | 290 (39.5) | 251 (41.8) | 0.404 | 48 (37.8) | 74 (38.5) | 0.893 | 18 (34.6) | 104 (39.0) | 0.5561 | 7 (25.9) | 115 (39.4) | 0.169 |
| Race: | ||||||||||||
| Black/African-American | 235 (32.0) | 115 (19.1) | <0.001* | 43 (33.9) | 76 (39.6) | 0.134 | 20 (38.5) | 99 (37.1) | 0.8128 | 11 (40.7) | 108 (37.0) | 0.862 |
| White | 492 (67.0) | 475 (79.0) | 82 (64.6) | 116 (60.4) | 32 (61.5) | 166 (62.2) | 16 (59.3) | 182 (62.3) | ||||
| Other/Unknown | 7 (1.0) | 11 (1.8) | 2 (1.57) | 0 (0.0) | 0 (0.0) | 2 (0.7) | 0 (0.0) | 2 (0.7) | ||||
| Witnessed Arrest: | 477 (66.7) | 63 (10.9) | <0.001* | 94 (74.0) | 114 (59.4) | 0.007* | 43 (82.7) | 165 (61.8) | 0.004* | 25 (92.6) | 183 (62.7) | 0.002* |
| Witnessed Arrest by Lay Person: | 272 (38.0) | 38 (6.6) | <0.001* | 55 (43.3) | 62 (32.3) | 0.046* | 28 (53.9) | 89 (33.3) | 0.005* | 19 (70.4) | 98 (33.6) | <0.001* |
| ROSC Prior to ED Arrival: | 271 (36.9) | 0 (0.0) | <0.001* | 88 (69.3) | 20 (10.4) | <0.001* | 47 (90.4) | 61 (22.9) | <0.001* | 25 (92.6) | 83 (28.4) | <0.001* |
| Bystander AED: | 47 (8.0) | 21 (6.0) | 0.248 | 7(5.5) | 11 (5.7) | 0.934 | 5 (9.6) | 13 (4.9) | 0.174 | 5 (18.5) | 13 (4.5) | 0.012* |
| Bystander CPR: | 320 (54.8) | 80 (22.9) | <0.001* | 71 (55.9) | 99 (51.6) | 0.445 | 36 (69.2) | 134 (50.2) | 0.012* | 19 (70.4) | 151 (51.7) | 0.063 |
| Shockable Initial Rhythm (VF/VT): | 177 (24.5) | 4 (0.7) | <0.001* | 42 (33.1) | 36 (18.8) | 0.004* | 25 (48.1) | 53 (19.9) | <0.001* | 13 (48.2) | 65 (22.3) | 0.003* |
| Arrest at Home (vs. Public): | 448 (61.0) | 462 (76.9) | <0.001* | 68 (53.5) | 139 (72.4) | <0.001* | 19 (36.5) | 138 (70.4) | <0.001* | 8 (29.6) | 199 (68.2) | <0.001* |
| Arrest Before EMS Arrival | 613 (83.5) | 598 (99.5) | <0.001* | 102 (80.3) | 157 (81.8) | 0.745 | 45 (86.5) | 214 (80.2) | 0.281 | 24 (88.9) | 235 (80.5) | 0.285 |
| Time of Day EMS Dispatch: | ||||||||||||
| Morning to Afternoon | 304 (41.4) | 302 (50.3) | 0.001* | 48 (37.8) | 85 (44.3) | 0.251 | 23 (44.2) | 110 (41.2) | 0.685 | 10 (37.0) | 123 (45.1) | 0.608 |
| Afternoon to Evening | 430 (58.6) | 299 (49.8) | 79 (62.2) | 107 (55.7) | 29 (55.8) | 157 (58.8) | 17 (63.0) | 169 (57.9) | ||||
| Time EMS Dispatch to Scene (min.) | 7.66 (3.85) | 7.14 (3.99) | 0.016* | 7.5 (3.6) | 7.5 (3.6) | 0.971 | 7.4 (3.9) | 7.5 (3.5) | 0.859 | 8.0(3.7) | 7.44 (3.6) | 0.409 |
| Time EMS On Scene (min.) | --- | --- | --- | 15.0 (6.4) | 14.5 (5.2) | 0.433 | 13.9 (5.1) | 14.9 (5.9) | 0.277 | 12.9 (4.4) | 14.9 (5.8) | 0.083 |
| Time Transport to ED (min.) | --- | --- | --- | 10.2 (7.3) | 9.9 (6.4) | 0.700 | 10.9 (9.0) | 9.8 (6.3) | 0.284 | 12.7 (9.6) | 9.8 (6.4) | 0.032* |
| Transport Miles (mi.) | --- | --- | --- | 5.3 (4.9) | 6.0 (5.2) | 0.241 | 5.7 (5.7) | 5.7 (4.9) | 0.983 | 6.5 (6.1) | 5.7 (5.0) | 0.391 |
| Census Level Predictors | ||||||||||||
| RUCA Classification: | ||||||||||||
| Urban Core (1.0) | 572 (77.9) | 384 (63.9) | <0.001* | 108 (85.0) | 159 (82.8) | 0.598 | 41 (78.9) | 226 (84.6) | 0.300 | 20 (74.1) | 247 (84.6) | 0.157 |
| Metropolitan Area (2.0) | 162 (22.1) | 217 (36.1) | 19 (15.0) | 33 (17.2) | 11 (21.2) | 41 (15.4) | 7 (25.9) | 45 (15.4) | ||||
| Percent Living Alone | 30.9 (8.7) | 28.2 (7.1) | <0.001* | 35.4 (10.5) | 33.7 (9.6) | 0.150 | 36.0 (11.1) | 34.1 (9.7) | 0.191 | 33.9 (8.4) | 34.4 (10.1) | 0.803 |
| Percent Uninsured | 13.3 (5.1) | 13.1 (5.4) | 0.544 | 14.6 (4.9) | 14.3 (4.7) | 0.635 | 14.9 (4.7) | 14.3 (4.8) | 0.459 | 13.9 (4.3) | 14.5 (4.8) | 0.613 |
| Percent College Graduate | 19.7 (9.2) | 19.8 (7.9) | 0.863 | 17.4 (9.4) | 17.6 (9.6) | 0.798 | 17.3 (8.8) | 17.6 (9.7) | 0.864 | 16.5 (7.1) | 17.6 (9.7) | 0.564 |
| Percent High School Graduate | 87.6 (11.0) | 89.1 (7.6) | 0.006* | 84.3 (12.5) | 85.0 (12.3) | 0.626 | 84.2 (10.7) | 84.8 (12.7) | 0.749 | 84.0 (10.1) | 84.8 (12.6) | 0.754 |
| Unemployment Rate | 7.35 (5.2) | 6.77 (4.5) | 0.033* | 9.35 (6.4) | 8.73 (6.2) | 0.383 | 9.29 (6.3) | 8.92 (6.3) | 0.697 | 8.42 (4.9) | 9.03 (6.4) | 0.631 |
| Percent of Families in Poverty | 12.9 (9.9) | 15.3 (11.0) | <0.001* | 21.0 (12.4) | 18.3 (10.4) | 0.034* | 23.5 (12.8) | 18.5 (10.8) | 0.004* | 21.0 (12.9) | 19.2 (11.2) | 0.419 |
| Percent 65 Years or Older | 11.7 (6.0) | 12.2 (5.7) | 0.074 | 10.2 (6.9) | 10.68 (6.1) | 0.542 | 9.73 (6.9) | 10.7 (6.3) | 0.343 | 10.4 (8.0) | 10.5 (6.3) | 0.914 |
| Percent 85 Years or Older | 1.70 (1.4) | 1.74 (1.5) | 0.593 | 1.48 (1.6) | 1.54 (1.4) | 0.736 | 1.38 (1.5) | 1.54 (1.5) | 0.478 | 1.47 (1.9) | 1.52 (1.4) | 0.879 |
| Percent Female | 51.7 (3.5) | 51.4 (3.8) | 0.205 | 51.9 (3.4) | 51.0 (4.0) | 0.038* | 52.3 (3.1) | 51.2 (3.9) | 0.064 | 52.2 (2.9) | 51.3 (3.9) | 0.255 |
| Percent Black or African American | 24.7 (21.8) | 20.8 (17.9) | <0.001* | 31.4 (25.3) | 31.6 (24.7) | 0.965 | 28.1 (22.3) | 32.2 (25.3) | 0.274 | 23.1 (14.4) | 32.3 (25.5) | 0.065 |
| Average Household Size | 2.32 (0.3) | 2.40 (0.2) | <0.001* | 2.23 (0.3) | 2.26 (0.3) | 0.391 | 2.21 (0.3) | 2.26 (0.4) | 0.369 | 2.24 (0.2) | 2.25 (0.3) | 0.889 |
| Percent Vacant Housing Units | 11.3 (4.7) | 11.1 (4.2) | 0.419 | 13.0 (5.2) | 12.9 (5.0) | 0.919 | 13.5 (5.6) | 12.8 (5.0) | 0.355 | 11.9 (2.9) | 13.0 (5.3) | 0.296 |
Areas with lower rates of familial poverty were more likely to survive to ED while communities with higher familial poverty were more likely to both survive to admission and discharge.
Probabilities of Survival, Census Tract Variance, and Geospatial Distribution
The unconditional multilevel models demonstrated distinct probabilities of survival and geographic variability for the four primary outcomes. The average predicted probability of survival to the ED amongst the tracts was 57.0% (95CI: 51.3–62.3%). Census tracts accounted for 12.2% (p<0.001) variability in rates of survival to the ED as indicated by the intraclass correlation coefficient (ICC). Predicted probabilities of survival was 41.7% (95CI: 36.1–47.6%) for hospital admission, 16.1% (95CI: 10.7–23.5%) for hospital discharge, and 7.1% (95CI: 3.7–13.3%) for home discharge. ICC for survival to discharge was 18.0% and ICC for survival to home discharge was 26.0%. The median ICC P-value for the 15 imputed datasets were significant for both outcomes. There was no significant census tract variation in survival to hospital admission outcomes. Fig. 2 illustrates the distribution of predicted probabilities of survival for each outcome.
Figure 2:

Distribution of probabilities of survival for each census tract and outcome. Whisker extent is reflected by Tukey definition.
Spatial statistics performed on the predicted probabilities of survival for each outcome yielded significant geographic clustering. For survival to ED outcome, both Gi* and Local Moran’s I analysis identified 38 census tracts with high probability (hot spot) of survival and 5 census tracts with low probability of survival (cold spot) (Fig. 3). Local Moran’s I analysis identified 12 of these 38 hot spot census tracts as having significantly low rates of survival relative to surrounding tracts (Low-High Clusters) (Fig. 3B). General G* and Global Moran’s I statistics were statistically insignificant for survival to admission, discharge, and discharge home outcomes.
Figure 3:
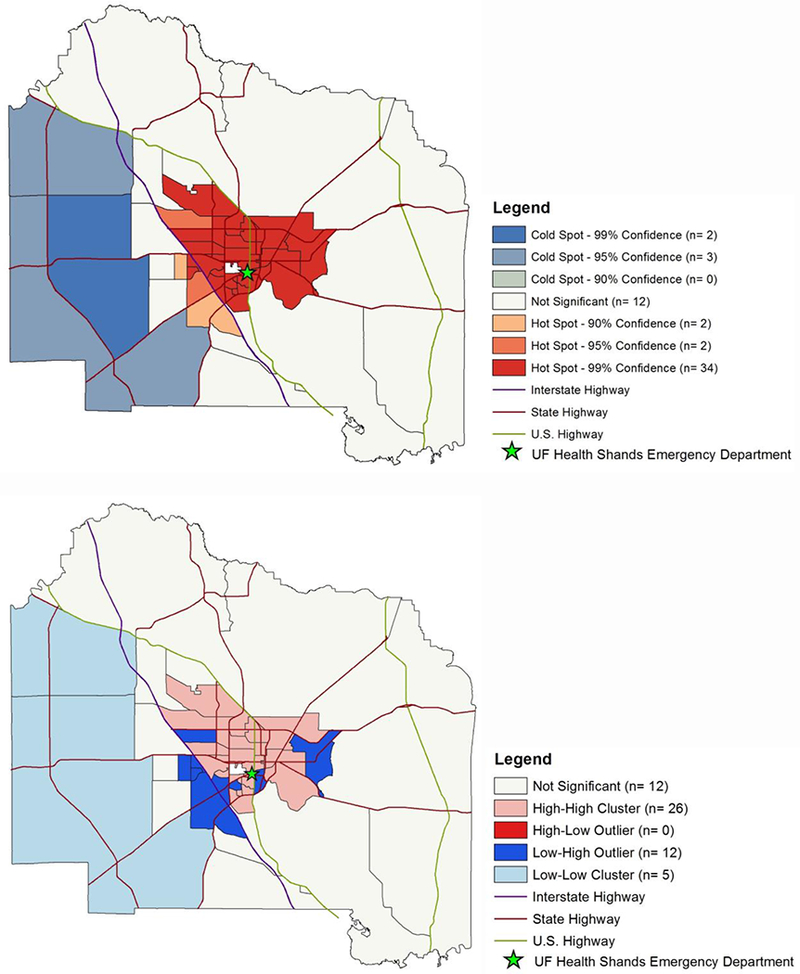
(A) Getis-Ord Gi* hotspot analysis of average predicted probabilities of survival to ED for each census tract. General G* = 0.691 (p<0.0001). (B) Local Moran’s I spatial outlier analysis of average predicted probabilities of survival to ED for each census tract. Global Moran’s I = 0.0797 (p<0.0001).
Adjusted Multilevel Modeling Statistics
The multilevel regression model building process, as described in the methods, yielded distinct patient-level and census tract-level characteristics that predict the probability of survival for each primary outcome (Table 3). Assessing the improvement of model fit after the addition of patient-level variables (model 2) and addition of census tract-level variables (model 3) indicated that the addition of neighborhood socioeconomic demographics significantly improved the prediction for survival to ED, hospital discharge, and home discharge. Table 4 summarizes the significant predictors of survival for each primary outcome.
Table 3:
Adjusted log odds (SE) of determinants with study outcomes for total study population and in-hospital study sample
| Prehospital Outcome (n=1335) | In-Hospital Outcomes (n=372) | |||||||||||
|---|---|---|---|---|---|---|---|---|---|---|---|---|
| Survival to Emergency Department | Survival to Hospital Admission | Survival to Hospital Discharge | Survival to Hospital Discharge (CPC 1–2) | |||||||||
| Model 1 | Model 2 | Model 3 | Model 1 | Model 2 | Model 3 | Model 1 | Model 2 | Model 3 | Model 1 | Model 2 | Model 3 | |
| Patient Fixed Effects (Level 1) | ||||||||||||
| Intercept | 0.33 (0.12) | −1.44 (0.45) | 8.56 (5.69) | −0.34 (0.12) | −0.36 (0.87) | −5.93 (8.28) | −1.65 (0.24) | −1.73 (1.22) | −32.3 (14.8) | −2.57 (0.35) | −2.63 (2.44) | 8.76 (24.6) |
| Age | −0.01 | −0.01 | −0.02 (0.01)* | −0.03 (0.01)* | −0.04 | −0.05 | −0.09 (0.04)* | −0.12 | ||||
| Sex (Female vs. Male) | 0.17 (0.17) | 0.18 (0.17) | 0.13 (0.31) | 0.10 (0.33) | 0.19 (1.46) | 0.23 (0.49) | −1.26 (0.99) | −1.69 | ||||
| Race (vs. White) | ||||||||||||
| Black/African-American | 0.72 (0.20)* | 0.70 (0.20)* | −0.31 (0.33) | −0.30 (0.4) | 0.14 (0.49) | 0.13 (0.53) | −0.36 (0.94) | −0.44 (1.06) | ||||
| Other/Unknown | 0.11 (0.76) | 0.20 (0.75) | 6.46 (15.7) | 6.86 (15.1) | −4.67 (20.3) | 0.13 (0.53) | −2.18 (45.6) | −1.57 (22.1) | ||||
| Witnessed Arrest: | 1.98 (0.30)* | 1.94 (0.30)* | −0.02 (0.51) | −0.24 (0.55) | 0.88 (0.78) | 0.47 (0.80) | 3.02 (1.87)* | 2.89 (1.88) | ||||
| Witnessed Arrest by Lay Person: | 0.46 (0.35) | 0.55 (0.35) | 0.21 (0.51) | 0.23 (0.54) | −0.11 (0.68) | 0.15 (0.71) | 0.92 (1.40) | 1.09 (1.49) | ||||
| ROSC Prior to ED Arrival: | --- | --- | --- | 2.91 (0.35)* | 3.16 (0.39)* | 3.83 (0.75)* | 4.17 (0.89)* | 5.53 (2.48)* | 6.60 (2.71)* | |||
| Bystander AED: | −0.65 (0.4) | −0.58 (0.39) | −0.10 (0.65) | −0.26 (0.72) | 0.99 (0.91) | 0.86 (0.97) | 4.60 (2.01)* | 4.08 (1.70)* | ||||
| Bystander CPR: | 1.37 (0.23)* | 1.31 (0.22)* | −0.19 (0.36) | −0.17 (0.39) | 0.31 (0.56) | −0.15 (0.60) | −0.37 (0.96) | −0.29 (1.01) | ||||
| Shockable Initial Rhythm (VF/VT): | 3.23 (0.50)* | 3.18 (0.50)* | 0.96 (0.35)* | 0.95 (0.38)* | 1.80 (0.54)* | 1.88 (0.58)* | 0.45 (0.90) | 0.62 (0.91) | ||||
| Arrest at Home (vs. Public): | −0.50 | −0.46 | −0.51 (0.31) | −0.45 (0.33) | −0.81 | −0.63 (0.50) | −1.22 (0.87) | −0.97 (0.88) | ||||
| Arrest After EMS Arrival | 3.19 (0.67)* | 3.11 (0.67)* | 0.59 (0.56) | 0.84 (0.59) | 0.52 (0.83) | 0.68 (0.82) | 0.52 (1.49) | 0.90 (1.56) | ||||
| Arrest in Afternoon-Evening Hours | 0.60 (0.17)* | 0.59 (0.17)* | 0.14 (0.31) | 0.14 (0.32) | −0.88 | −0.98 | −1.32 (1.04) | −1.91 | ||||
| Time EMS Dispatch to Scene (min.) | 0.10 (0.02)* | 0.12 (0.02)* | 0.06 (0.05) | 0.06 (0.05) | 0.03 (0.07) | 0.03 (0.07) | 0.09 (0.13) | 0.01 (0.13) | ||||
| Time EMS On Scene (min.) | --- | --- | --- | 0.00 (0.03) | −0.01 (0.03) | −0.08 | −0.09 | −0.15 (0.10) | −0.15 (0.10) | |||
| Time Transport to ED (min.) | --- | --- | --- | 0.05 (0.05) | 0.07 (0.05) | 0.02 (0.05) | 0.04 (0.07) | 0.02 (0.07) | 0.06 (0.08) | |||
| Transport Miles (mi.) | --- | --- | --- | −0.12 (0.06)* | −0.12 (0.09) | 0.03 (0.09) | 0.03 (0.12) | 0.10 (0.15) | 0.06 (0.17) | |||
| Census Fixed Effects (Level 2) | ||||||||||||
| Metropolitan Area (2.0) | −0.77 | −0.35 (1.01) | 1.21 (1.57) | −2.07 (2.18) | ||||||||
| Percent Living Alone | 0.00 (1.05) | 0.05 (0.07) | 0.14 (0.11) | −0.14 (0.21) | ||||||||
| Percent Uninsured | −0.01 (0.03) | 0.01 (0.04) | 0.10 (0.08) | 0.03 (0.14) | ||||||||
| Percent College Graduate | 0.02 (0.03) | −0.10 (0.05) | −0.09 (0.08) | −0.45 | ||||||||
| Percent High School Graduate | −0.04 | 0.03 (0.02)* | 0.05 (0.04) | 0.055 (0Ό6) | ||||||||
| Unemployment Rate | 0.05 (0.03) | −0.05 (0.05) | −0.19 | −0.27 | ||||||||
| Percent of Families in Poverty | −0.02 (0.02) | 0.03 (0.03) | 0.00 (0.04)* | −0.04 (0.08) | ||||||||
| Percent 65 Years or Older | 0.02 (0.04) | 0.08 (0.09) | 0.06 (0.16) | −0.11 (0.27) | ||||||||
| Percent 85 Years or Older | −0.10 (0.15) | −0.26 (0.33) | −0.10 (0.52) | 0.66 (0.90) | ||||||||
| Percent Female | 0.01 (0.03) | 0.11 (0.06)* | 0.31 (0.17)* | 0.33 (0.25) | ||||||||
| Percent Black or African American | 0.01 (0.01) | −0.02 (0.02) | −0.02 (0.03) | −0.07 (0.05) | ||||||||
| Average Household Size | −3.03 | −0.75 (2.70) | 2.94 (4.08) | −6.84 (7.46) | ||||||||
| Percent Vacant Housing Units | −0.08 | −0.04 (0.05) | 0.00 (0.08) | −0.03 (0.16) | ||||||||
| Model Fit | ||||||||||||
| -2 log likelihood (−2LL) | 1778.73 | 1093.48** | 1056.58** | 504.31 | 339.49** | 319.60 | 340.93 | 202.75** | 176.42** | 227.31 | 117.91** | 89.00** |
Indicates p <0.05
Indicates p <0.10
Likelihood ratio test compared to previous model is significant (improvement of model fit)
Table 4:
Significant adjusted patient-level and neighborhood-level predictors of survival from multilevel logistic regression modeling
| Survival to Emergency Department | Survival to Hospital Admission | Survival to Hospital Discharge | Survival to Hospital Discharge (CPC 1–2) |
|---|---|---|---|
| Positive Association | Positive Association | Positive Association | Positive Association |
| Black/African-American | ROSC Prior to ED Arrival | ROSC Prior to ED Arrival | ROSC Prior to ED Arrival |
| Witnessed Arrest | Shockable Initial Rhythm | Shockable Initial Rhythm | Bystander AED Use |
| Bystander CPR | |||
| Shockable Initial Rhythm | |||
| Arrest After EMS Arrival | |||
| Arrest in Afternoon-Evening | |||
| Time EMS Dispatch to Scene | |||
| Negative Association | Negative Association | Negative Association | Negative Association |
| Age | Age | Age | Age |
| Arrest at Home | Time EMS On Scene | Percent College Graduate* | |
| Vacant Housing Units* | Arrest in Afternoon-Evening | ||
| Unemployment Rate* | |||
Neighborhood-level variable
DISCUSSION
This retrospective observational analysis of OHCA incidences over a 5-year period shows significant local variation of OHCA outcomes based on patient-, geographic-, and neighborhood-level factors. The combination of EMS and hospital medical records allows for the logistics of prehospital cardiac management to be correlated with survival outcomes. This is especially important in patients who do not receive any prehospital treatment or survive to the emergency department setting, two sub-populations that are often not captured in cardiac arrest registries [13, 17, 28]. Although it is possible to identify areas where outcomes can directly be improved through large registries [7], we propose a framework that can be applied in places where uniformed surveillance systems are lacking. This study comprehensively assesses patient characteristics, prehospital factors, geographic variation, and neighborhood sociodemographic characteristics along the chain of survival in a sub-county urban-rural setting.
These chain of survival links largely rely on public engagement via recognition of cardiac events, initiation of early CPR, and decrease ambulance call to arrival interval. It has been previously reported that these individual factors are associated with neighborhood socioeconomic variations [29]. The AHA published recommendation that GIS be used by researchers to identify associations between neighborhoods and bystander CPR [30] If EMS agencies know which regions are at higher risk of OHCA, they can adapt protocols to neighborhood typology.
The first link involves early access to emergency response services, which includes recognition of the cardiac event and notification of professional support. The absence of a bystander witness of the cardiac event continues to be revealed as an important barrier in survival outcomes. In our study, only 10% of cases that did not survive to the emergency department setting were witnessed while over 90% of cases that survived to home discharge were witnessed. After adjusting for geographic variation, OHCA patients are 7.0 times more likely to survive to the emergency department setting if there was a bystander witness. This survival to ED outcome is not patient-oriented, but it does suggest that these patients are likely physiologically better and did not meet the criteria for field termination of resuscitation. Factors that are associated with bystander witnessed arrests, including arrests occurring in public and in the afternoon-evening hours, also showed strong positive associations with survival outcomes. The household vacancy also had a strong negative association with survival to ED. Despite the sudden nature of cardiac arrest, this publicly available neighborhood socioeconomic information can be used by prehospital management systems and emergency department as a proxy to identify areas that may have less witnessed arrests.
The next two links are early initiation of CPR and defibrillation using AEDs. Bystander CPR was associated with survival to ED, discharge, and discharge home outcomes. However, controlling for other factors indicated that it was only a significant predictor in early milestones.
Bystander AED use remains low at 7% and is comparable to national trends [1]. Despite this, bystander AED was only independently associated with late milestones, where patients with AED use had a ~60-fold increases odds of survival to home discharge outcome. In our sample, bystander AED use is not critical for early milestones, however it appears to dramatically increase improved neurological outcomes for patients who pass the initial phases of the care process. The increased occurrence of bystander CPR and AED use in the urban setting compared to rural areas highlights modifiable factors including lack of training or AED access. It should be noted that the bystander AED use factor in our study does not differentiate between cases where shock was administered.
The fourth link involves early advanced care by EMS and hospital personnel. Time for EMS to be dispatched and arrive on scene was observed to significantly influence survival to emergency department outcomes, where the average time for EMS to arrive on scene from time of dispatch was 7.43 minutes. Our spatial statistic models (Figure 3A and 3B) illustrates how interstate highway separates those areas with significantly poor and good survival to emergency department outcomes, giving our local EMS agencies defined locations for improvement. This stresses the importance of communities assessing their own unique profile of determinants that influences OHCA outcomes. Adjusted models indicate less time spent on scene independently leads to better odds of surviving to discharge, suggesting the importance of getting the patient to more advanced care early. On the other hand, unadjusted models indicate a positive association between time from scene departure to ED arrival and discharge with good neurological outcome, though no relationship was observed after adjustment. This suggests that transport time appears to be dependent on geography, however it could hint at potential strains in CPR quality during rapid transport. Nevertheless, the achievement of ROSC prior to emergency department arrival remains the strongest predictor in our adjusted model for all hospital survival milestones.
The final link is post-resuscitative care. Although specific emergency department and in-hospital interventions were not specifically studied (e.g. TTM, catheterization, medication, labs, imaging), this study provides evidence that where and when OHCA occurs influences in-hospital survival milestones. In our study, the addition of neighborhood-level variables significantly improved the overall fit of the adjusted model when exploring survival to discharge and home discharge outcomes. Furthermore, there was significant geographic variation in survival probabilities for both outcomes. This offers the possibility to explore neighborhood demographics influence on the decision to withdraw life-support or aggressive resuscitation, especially with the negative independent association between college education demographics and these late survival milestones. This negative association is also particularly interesting within the context of the study setting. On the contrary, neighborhood demographics did not significantly improve model fit in the survival to hospital admission outcome. This supports the notion that reaching the hospital admission milestone is mostly dependent on patient factors and the resuscitative effort in the emergency department setting.
LIMITATIONS
We acknowledge that limitations exist in our study. First, we are only reporting patient hospital outcomes for cases that were transported to a single ED by a single EMS agency. However, ACFR is the only 911 transport agency within the county. Second, interventions performed in the ED or in-hospital setting that highly influence outcomes were not included in our adjusted model. Our objective was to identify prehospital interventions and neighborhood socioeconomic demographics that influence survival milestones though the model schematic provided can easily be expanded to include hospital interventions using administrative data. Third, Alachua County has a large college population at the center of the urban setting, affecting the generalizability of the rural-urban analysis. As illustrated by the sub-county outcome variation, we recognize the importance of controlling for socioeconomic heterogeneity when identifying determinants that influence health outcomes.
CONCLUSION
Geographic differences exist in outcomes of OHCA at the community level and this variation can be explained through potentially modifiable socioeconomic and prehospital factors. The methodological approach presented in this study represents a replicable schematic for assessing geographic variations in cardiac arrest outcomes in local communities. Most OHCA recommendations come from research networks that encompass select areas, mainly in locations with large urban centers. We propose that communities should jointly develop comprehensive plans using the socioeconomic patterns unique to their region along with national guidelines in order to address local variation in OHCA outcomes.
Supplementary Material
ACKNOWLEDGEMENTS
We acknowledge the University of Florida Integrated Data Repository (IDR) and the UF Health Office of the Chief Data Officer for providing the analytic data set for this project. The research reported in this publication was supported by the National Center for Advancing Translational Sciences of the National Institutes of Health under University of Florida Clinical and Translational Science Awards UL1 TR000064 and UL1TR001427.
The content of this publication is solely the responsibility of the authors and does not necessarily represent the official views of the National Institutes of Health.
Funding: The research reported in this publication was supported by the National Center for Advancing Translational Sciences of the National Institutes of Health under University of Florida Clinical and Translational Science Awards UL1 TR000064 and UL1TR001427.
Footnotes
Study Group: This paper is submitted on behalf of the Florida Cardiac Arrest Resource Team
Conflict of Interests:
The authors report no conflict of interest
REFERENCES
- 1.Benjamin EJ, Blaha MJ, Chiuve SE, Cushman M, Das SR, Deo R, de Ferranti SD, Floyd J, Fornage M, Gillespie C. Heart Disease and Stroke Statistics-2017 Update: A Report From the American Heart Association. Circulation. 2017;135:e146–e603. [DOI] [PMC free article] [PubMed] [Google Scholar]
- 2.Muller D, Agrawal R, Arntz HR. How sudden is sudden cardiac death? Circulation. 2006;114:1146–1150. [DOI] [PubMed] [Google Scholar]
- 3.Cummins RO, Ornato JP, Thies WH, Pepe PE. Improving survival from sudden cardiac arrest: the “chain of survival” concept. A statement for health professionals from the Advanced Cardiac Life Support Subcommittee and the Emergency Cardiac Care Committee, American Heart Association. Circulation. 1991;83:1832–1847. [DOI] [PubMed] [Google Scholar]
- 4.Chen CC, Chen CW, Ho CK, Liu IC, Lin BC, Chan TC. Spatial Variation and Resuscitation Process Affecting Survival after Out-of-Hospital Cardiac Arrests (OHCA). PloS one. 2015;10:e0144882. [DOI] [PMC free article] [PubMed] [Google Scholar]
- 5.Daya MR, Schmicker RH, Zive DM, Rea TD, Nichol G, Buick JE, Brooks S, Christenson J, MacPhee R, Craig A, Rittenberger JC. Out-of-hospital cardiac arrest survival improving over time: Results from the Resuscitation Outcomes Consortium (ROC). Resuscitation. 2015;91:108–115. [DOI] [PMC free article] [PubMed] [Google Scholar]
- 6.Sasson C, Rogers MA, Dahl J, Kellermann AL. Predictors of survival from out-of hospital cardiac arrest: a systematic review and meta-analysis. Circulation. Cardiovascular quality and outcomes. 2010;3:63–81. [DOI] [PubMed] [Google Scholar]
- 7.Nichol G, Thomas E, Callaway CW, Hedges J, Powell JL, Aufderheide TP, Rea T, Lowe R, Brown T, Dreyer J, Davis D. Regional variation in out-of-hospital cardiac arrest incidence and outcome. JAMA 2008;300:1423–1431. [DOI] [PMC free article] [PubMed] [Google Scholar]
- 8.Dahan B, Jabre P, Karam N, Misslin R, Tafflet M, Bougouin W, Jost D, Beganton F, Marijon E, Jouven X. Impact of neighbourhood socio-economic status on bystander cardiopulmonary resuscitation in Paris. Resuscitation. 2017;110:107–113. [DOI] [PubMed] [Google Scholar]
- 9.Ong ME, Wah W, Hsu LY, Ng YY, Leong BS, Goh ES, Gan HN, Tham LP, Charles RA, Foo DC, Earnest A. Geographic factors are associated with increased risk for out-of hospital cardiac arrests and provision of bystander cardio-pulmonary resuscitation in Singapore. Resuscitation. 2014;85:1153–1160. [DOI] [PubMed] [Google Scholar]
- 10.Root ED, Gonzales L, Persse DE, Hinchey PR, McNally B, Sasson C. A tale of two cities: the role of neighborhood socioeconomic status in spatial clustering of bystander CPR in Austin and Houston. Resuscitation. 2013;84:752–759. [DOI] [PMC free article] [PubMed] [Google Scholar]
- 11.Uber A, Sadler RC, Chassee T, Reynolds JC. Bystander Cardiopulmonary Resuscitation Is Clustered and Associated With Neighborhood Socioeconomic Characteristics: A Geospatial Analysis of Kent County, Michigan. Academic Emergency Medicine. 2017;24:930–939. [DOI] [PubMed] [Google Scholar]
- 12.Kao JH, Chan TC, Lai F, Lin BC, Sun WZ, Chang KW, Leu FY, Lin JW. Spatial analysis and data mining techniques for identifying risk factors of Out-of-Hospital Cardiac Arrest. International Journal of Information Management. 2017;37:1528–1538. [Google Scholar]
- 13.Girotra S, van Diepen S, Nallamothu BK, Carrel M, Vellano K, Anderson ML, McNally B, Abella B, Sasson C, Chan PS. Regional Variation in Out-of-Hospital Cardiac Arrest Survival in the United States. Circulation. 2016;133:2159–2168. [DOI] [PMC free article] [PubMed] [Google Scholar]
- 14.Nassel AF, Root ED, Haukoos JS, McVaney K, Colwell C, Robinson J, Eigel B, Magid DJ, Sasson C. Multiple cluster analysis for the identification of high-risk census tracts for out-of-hospital cardiac arrest (OHCA) in Denver, Colorado. Resuscitation. 2014;85:1667–1673. [DOI] [PMC free article] [PubMed] [Google Scholar]
- 15.Sasson C, Cudnik MT, Nassel A, Semple H, Magid DJ, Sayre M, Keseg D, Haukoos JS, Warden CR. Identifying high-risk geographic areas for cardiac arrest using three methods for cluster analysis. Academic Emergency Medicine. 2012;19:139–146. [DOI] [PubMed] [Google Scholar]
- 16.Edgren E, Hedstrand U, Kelsey S, Sutton-Tyrrell K, Safar P. Assessment of neurological prognosis in comatose survivors of cardiac arrest. BRCT I Study Group. Lancet (London, England). 1994;343:1055–1059. [DOI] [PubMed] [Google Scholar]
- 17.Jacobs I, Nadkarni V, Bahr J, et al. Cardiac arrest and cardiopulmonary resuscitation outcome reports: update and simplification of the Utstein templates for resuscitation registries: a statement for healthcare professionals from a task force of the International Liaison Committee on Resuscitation (American Heart Association, European Resuscitation Council, Australian Resuscitation Council, New Zealand Resuscitation Council, Heart and Stroke Foundation of Canada, InterAmerican Heart Foundation, Resuscitation Councils of Southern Africa). Circulation. 2004;110:3385–3397. [DOI] [PubMed] [Google Scholar]
- 18.Bureau USC. “TIGER Products - Geography.” Vol 2012. [Google Scholar]
- 19.USDA. USDA Economic Research Service Rural-Urban Commuting Area Codes. Vol 2017. https://www.ers.usda.gov/data-products/rural-urban-commuting-area-codes/2017.
- 20.Hall SA, Kaufman JS, Ricketts TC. Defining Urban and Rural Areas in U.S. Epidemiologic Studies. Journal of Urban Health. 2006;83:162–175. [DOI] [PMC free article] [PubMed] [Google Scholar]
- 21.Enders CK, Keller BT, Levy R. A fully conditional specification approach to multilevel imputation of categorical and continuous variables. Psychological Methods. 2018;23:298–317. [DOI] [PubMed] [Google Scholar]
- 22.Snijders TABBR. Multilevel analysis: an introduction to basic and advanced multilevel modeling. 1 ed Thousand Oaks, CA: Sage; 1999. [Google Scholar]
- 23.Ord JK, Getis A. Local Spatial Autocorrelation Statistics: Distributional Issues and an Application. Geographical Analysis. 1995;27:286–306. [Google Scholar]
- 24.Mitchell A, Institute ESR. The ESRI Guide to GIS Analysis: Geographic patterns & relationships’. ESRI Press; 1999. [Google Scholar]
- 25.Scott LM, Janikas MV. Spatial Statistics in ArcGIS In: Fischer MM, Getis A, eds. Handbook of Applied Spatial Analysis: Software Tools, Methods and Applications. Berlin, Heidelberg: Springer Berlin Heidelberg; 2010:27–41. [Google Scholar]
- 26.Anselin L Local Indicators of Spatial Association—LISA. Geographical Analysis. 1995;27:93–115. [Google Scholar]
- 27.Mihaela Ene EAL, Blue Genine L., and Bell Bethany A. Multilevel Models for Categorical Data Using SAS® PROC GLIMMIX: The Basics. SAS Global Forum 2015 Proceedirrgs 2015. [Google Scholar]
- 28.Sasson C, Magid DJ, Chan P, Root ED, McNally BF, Kellermann AL, Haukoos JS. Association of Neighborhood Characteristics with Bystander-Initiated CPR. The New England journal of medicine. 2012;367:1607–1615. [DOI] [PMC free article] [PubMed] [Google Scholar]
- 29.Sasson C, Meischke H, Abella BS, Berg RA, Bobrow BJ, Chan PS, Root ED, Heisler M, Levy JH, Link M, Masoudi F. Increasing cardiopulmonary resuscitation provision in communities with low bystander cardiopulmonary resuscitation rates: a science advisory from the American Heart Association for healthcare providers, policymakers, public health departments, and community leaders. Circulation. 2013;127:1342–1350. [DOI] [PubMed] [Google Scholar]
- 30.Benjamin EJ, Virani SS, Callaway CW, Chamberlain AM, Chang AR, Cheng S, Chiuve SE, Cushman M, Delling FN, Deo R, de Ferranti SD. Heart Disease and Stroke Statistics-2018 Update: A Report From the American Heart Association. Circulation. 2018;137:e67–e492. [DOI] [PubMed] [Google Scholar]
- 31.Zive DM, Schmicker R, Daya M, Kudenchuk P, Nichol G, Rittenberger JC, Aufderheide T, Vilke GM, Christenson J, Buick JE, Kaila K. Survival and variability over time from out of hospital cardiac arrest across large geographically diverse communities participating in the Resuscitation Outcomes Consortium. Resuscitation. 2018;131:74–82. [DOI] [PubMed] [Google Scholar]
- 32.Okubo Masashi, et al. “Variation in survival after out-of-hospital cardiac arrest between emergency medical services agencies.” JAMA cardiology 310 (2018): 989–999. [DOI] [PMC free article] [PubMed] [Google Scholar]
- 33.Rittenberger Jon C., et al. “Outcomes of a hospital-wide plan to improve care of comatose survivors of cardiac arrest.” Resuscitation 792 (2008): 198–204. [DOI] [PMC free article] [PubMed] [Google Scholar]
Associated Data
This section collects any data citations, data availability statements, or supplementary materials included in this article.