

Abstract
Purpose
To introduce a prognostic model for women’s assisted fecundity before starting the first IVF/ICSI treatment cycle.
Methods
In contrast to previous predictive models, we analyze two groups of women at the extremes of prognosis. Specifically, 708 infertile women that had either a live birth (LB) event in the first autologous IVF/ICSI cycle (“high-assisted-fecundity women”, n = 458) or did not succeed in having a LB event after completing three autologous IVF/ICSI cycles (“low-assisted-fecundity women”, n = 250). The initial sample of 708 women was split into two sets in order to develop (n = 531) and internally validate (n = 177) a predictive logistic regression model using a forward-stepwise variable selection.
Results
Seven out of 32 initially selected potential predictors were included into the model: women’s age, presence of multiple female infertility factors, number of antral follicles, women’s tobacco smoking, occurrence of irregular menstrual cycles, and basal levels of prolactin and LH. The value of the c-statistic was 0.718 (asymptotic 95% CI 0.672–0.763) in the development set and 0.649 (asymptotic 95% CI: 0.560–0.738) in the validation set. The model adequately fitted the data with no significant over or underestimation of predictor effects.
Conclusion
Women’s assisted fecundity may be predicted using a relatively small number of predictors. This approach may complement the traditional procedure of estimating cumulative and cycle-specific probabilities of LB across multiple complete IVF/ICSI cycles. In addition, it provides an easy-to-apply methodology for fertility clinics to develop and actualize their own predictive models.
Keywords: Cumulative live birth, Fecundity, In vitro fertilization, Oocyte retrieval cycle, Predictive model
Introduction
McLernon et al. [1] created an online calculator that estimates the cumulative chances of having a baby on the characteristics of the couple and treatment (https://w3.abdn.ac.uk/clsm/opis). These estimates are based on individualized pre- and post-treatment discrete time logistic regression models of cumulative live birth (LB) across multiple complete in vitro fertilization (IVF)/intracytoplasmic sperm injection (ICSI) cycles. The Society for Assisted Reproductive Technology (SART) patient predictor also estimates cumulative LB probabilities after one, two, and three oocyte retrieval cycles (ORC), assuming that women have not had prior IVF treatments (https://www.sartcorsonline.com/Predictor/Patient). These predictive models may facilitate the women’s decision-making process about pursuing further IVF/ICSI treatments before or after one or more unsuccessful cycles. However, we should note that by definition, cumulative LB probabilities always increase as number of ORC rises. This fact may incentivize infertile women to have more treatment cycles after one or more unsuccessful attempts and, therefore, may bias the women’s decision-making process [2], particularly, in those women displaying low or zero fecundity (“fecundity” is clinically defined as the capacity to have a LB [3]). In order to counteract this potential bias, we have recently proposed that, in addition to be informed about their cumulative LB probabilities across multiple IVF/ICSI cycles, infertile women should know before starting the first IVF/ICSI treatment that their cycle-specific probabilities of achieving a LB decrease as number of ORC increases [2]. Infertile women may be also interested to know before starting the first IVF/ICSI treatment cycle whether they have a high or low capacity to have a LB using assisted reproductive technology. That is, whether they can expect to have a LB at the first treatment cycle or will likely have to wait for longer to reach a LB. This is an important issue for infertile women because they do not know which their assisted fecundity is before they embark in an IVF/ICSI treatment journey. Certainly, the most-fecund women will be the first in becoming pregnant and having a LB, whereas less-fecund women will take longer to have a LB or even will never experience a LB event.
Previous predictive logistic regression models have estimated the woman-specific probability of LB at the first oocyte retrieval cycle after adjusting for many covariates [4–6] (note that when data analysis is focused exclusively on the first IVF/ICSI treatment cycle, the estimated probabilities can be expressed per woman/couple instead than per cycle [4]). The approach of estimating cumulative probabilities of LB across multiple IVF/ICSI cycles may also be used to estimate the woman-specific probability of LB at the first IVF/ICSI cycle after adjusting for many covariates [1, 7–9]. Both approaches, however, use cohorts of women exhibiting different capacities to have a LB using assisted reproduction techniques. In other words, cohorts with women that have a LB at the first ORC (the most-fecund women) and other less-fecund women that do not have a LB at the first ORC. These women may or may not repeat treatment cycles attempting to have a LB.
The present study aims to introduce a prognostic model for women’s assisted fecundity before starting the first IVF/ICSI treatment cycle. In order to reach this aim, clinical and demographic traits measured before starting the first treatment cycle were selected to build a predictive model. In contrast to previous predictive models, we analyzed two groups of women at the extremes of prognosis. In particular, women that had a LB at the first IVF/ICSI cycle (hereafter named “high-assisted-fecundity women”) and women that did not succeed in having a LB event after completing three treatment cycles (hereafter named “low-assisted-fecundity women”). Women with average assisted fecundity, i.e., women that had a LB in the second or third treatment cycle as well as women that underwent just one or two ORC without having achieved a LB, were excluded from the study. The strategy of using two groups of women with distinct and extreme IVF/ICSI outcomes may help to identify significant predictors of high and low-assisted fecundity before women start the first IVF/ICSI treatment cycle. Women with low or zero-assisted fecundity will most likely need several treatment cycles to have a LB, or even will never experience a LB event after undergoing many treatment cycles. The early detection of women displaying clinical and demographics traits associated with a low or zero-assisted fecundity may avoid unnecessary exposure to risks associated with IVF/ICSI treatments and waste of resources.
Material and methods
Study design
This is a retrospective analysis of 708 out of 1433 infertile women enrolled in the Assisted Reproduction Unit of the Valencia University Clinic Hospital from January 2009 to July 2018. Two different groups of women were entered into the study: (1) high-assisted-fecundity women that had a LB event in the first autologous IVF/ICSI cycle using fresh or frozen embryos and (2) low-assisted-fecundity women that did not succeed in having a LB event after completing three autologous IVF/ICSI cycles. A complete IVF/ICSI cycle was defined as an ovarian stimulation cycle performed to generate embryos to be transferred in subsequent fresh or embryo transfers, with no frozen embryos left over for further transfers. A LB event was defined as the birth of at least one living child that survived for more than 1 month, regardless of the duration of gestation. Note that, according to the Spanish Royal Decree-Law 1030/2006 and the Order SSI/2065/2014, IVF/ICSI treatment should be applied in the National Health System only for a maximum of three cycles of ovarian stimulation. Thus, the group of low-assisted-fecundity women consisted of women that experienced just three complete unsuccessful IVF/ICSI cycles. All the stages of treatment from the start of ovarian stimulation to the outcomes of the fresh and/or subsequent frozen embryo transfers were taken into consideration. Consequently, cycles canceled before either oocyte retrieval or a particular embryo transfer were included into the final statistical analysis [10]. Furthermore, in order to reduce the variability among women in length of time required to complete IVF/ICSI treatments [11], a 24-month interval was established as the follow-up limit for women to undergo three complete oocyte retrieval cycles. Women, who did not complete treatment in 24 months, were excluded from the study.
The total population of 708 women entered into the study was divided into two sets in order to either develop or internally validate a predictive model for women’s assisted fecundity. In particular, all the women that either had a LB in the first IVF/ICSI cycle (n = 335) or did not succeed in having a LB after three complete IVF/ICSI cycles (n = 196) between January 2009 and October 2015 were selected to develop the model. This selection accounted for 75% of the 708 women entered into the study. The remaining 25% of women were set aside to perform an internal validation of the model using data that were more recent. Specifically, the validation set included all the women that either had a LB in the first IVF/ICSI cycle (n = 123) or exhibited three complete unsuccessful IVF/ICSI cycles (n = 54) between November 2015 and July 2018.
This study was approved by the Ethical Committee of Clinical Investigation, Valencia University Clinical Hospital, on November 30 2017 (2017/316). Written informed consent was not required from the participants because the retrospective nature of the study.
Statistical analysis
The entire set of variables recorded in our Assisted Reproduction Unit database was revised to select potential predictors of women’s assisted fecundity, i.e., those variables that occurred or were measured before women started the first IVF/ICSI treatment cycle. Such a preliminary screening selected a total number of 23 continuous or categorical potential predictors (Table 1). Two-tailed t test for continuous variables and two-sided Pearson’s chi-squared tests for categorical variables were applied to compare descriptive data from high- and low-assisted-fecundity women. Yates’s correction for continuity was applied to Pearson’s chi-squared tests in 2 × 2 contingency table analyses.
Table 1.
Descriptive data of potential predictors of women’s assisted fecundity in the development and validation set
| Potential predictors | Number | Development set | Number | Validation set | P |
|---|---|---|---|---|---|
| Women’s age | 531 | 34.7 (3.1)a | 177 | 35.9 (2.9) | 0.0005 |
| Men’s age | 531 | 36.9 (4.6) | 167 | 37.8 (4.6) | 0.016 |
| Women’s BMI | 531 | 23.0 (3.9) | 177 | 23.0 (3.5) | 0.889 |
| Women’s tobacco smokingb | 531 | 3.4 (6.6) | 177 | 3.3 (6.6) | 0.917 |
| Men’s tobacco smokingb | 531 | 4.9 (8.1) | 167 | 3.8 (6.9) | 0.065 |
| Type of menstrual cycle | 0.002 | ||||
| Regular | 468/531 | 88.1c | 142/177 | 80.2 | |
| Irregular | 61/531 | 11.5 | 30/177 | 16.9 | |
| Amenorrhea | 2/531 | 0.4 | 5/177 | 2.8 | |
| Duration of menstrual cycle (days) | 531 | 30.3 (10.6) | 175 | 29.6 (12.1) | 0.506 |
| Duration of infertility (yrs) | 531 | 2.7 (1.4) | 177 | 2.6 (1.8) | 0.837 |
| No. of previous artificial insemination cycles | 531 | 1.0 (1.4) | 177 | 1.0 (1.4) | 0.733 |
| No. of previous IVF/ICSI cycles | 531 | 0.1 (0.4) | 177 | 0.1 (0.3) | 0.529 |
| No. of previous abortions | 531 | 0.3 (0.7) | 177 | 0.4 (0.8) | 0.140 |
| No. of previous LBs | 531 | 0.05 (0.25) | 177 | 0.04 (0.20) | 0.153 |
| Women’s medical conditiond | 0.302 | ||||
| Healthy | 415/531 | 78.2 | 131/177 | 74.0 | |
| Diseased | 116/531 | 21.8 | 46/177 | 26.0 | |
| Men’s medical conditiond | 0.756 | ||||
| Healthy | 457/531 | 86.1 | 150/177 | 84.7 | |
| Diseased | 74/531 | 13.9 | 27/177 | 15.3 | |
| Female infertility etiology | 0.209 | ||||
| Tubal factor | 35/531 | 6.6 | 7/177 | 4.0 | |
| Uterine factor | 75/531 | 14.1 | 21/177 | 11.9 | |
| Endometriosis | 36/531 | 6.8 | 6/177 | 3.4 | |
| Ovulatory dysfunction | 43/531 | 8.1 | 18/177 | 10.2 | |
| Diminished ovarian reserve | 55/531 | 10.4 | 16/177 | 9.0 | |
| Unknown factor | 140/531 | 26.4 | 62/177 | 35.0 | |
| Multiple female factors | 136/531 | 25.6 | 45/177 | 25.4 | |
| Other factors | 11/531 | 2.1 | 2/177 | 1.1 | |
| Male infertility etiology | 0.0005 | ||||
| Donor sperm | -- | -- | 10/177 | 5.6 | |
| Oligo, astheno-, and/or teratozoospermia | 241/531 | 45.4 | 65/177 | 36.7 | |
| Cryptozoospermia or azoospermia | 63/531 | 11.9 | 18/177 | 10.2 | |
| Unknown (normozoospermia) | 227/531 | 42.7 | 84/177 | 47.5 | |
| No. of antral follicles | 531 | 14.9 (8.8) | 177 | 15.4 (7.7) | 0.469 |
| Basal AMH (ng/mL) | 531 | 2.2 (1.5) | 177 | 2.4 (1.5) | 0.113 |
| Basal FSH (mIU/mL) | 531 | 7.4 (5.0) | 177 | 7.2 (2.7) | 0.610 |
| Basal LH (mIU/mL) | 531 | 6.5 (6.3) | 177 | 6.8 (4.3) | 0.469 |
| Basal E2 (pg/mL) | 531 | 50.7 (29.5) | 177 | 58.2 (44.9) | 0.011 |
| Basal TSH (μIU/mL) | 531 | 2.1 (0.9) | 177 | 2.1 (1.2) | 0.666 |
| Basal prolactin (ng/mL) | 531 | 22.9 (14.7) | 177 | 22.1 (10.6) | 0.412 |
aValues are means SDs in parenthesis
bNumber of cigarettes smoked per day for the 3 months before starting the first intended oocyte retrieval cycle
cValues are percentages
dMedical conditions were assessed following the International Statistical Classification of Diseases and Related Health Problems 10th Revision (ICD-10 Version: 2016) [14]
A forward-stepwise-selection logistic regression model was used to predict women’s assisted fecundity in the development and validation set. The area under the receiver operating characteristic (ROC) curve, a.k.a. concordance statistic (c-statistic), was applied to evaluate the model’s discriminatory capacity in both the development and the validation set. The area under the ROC curve can be interpreted as the proportion of all pairs of women where one woman had a LB in the first IVF/ICSI cycle and the other did not succeed in having a LB after completing three IVF/ICSI cycles. The woman with the lower risk score should be the one who did not succeed in having a LB after completing three IVF/ICSI cycles [12]. That is, the test correctly classifies the two women in the random pair. ROC curves were constructed by plotting the false positive rate, i.e., the rate of misclassifying low-assisted-fecundity women as high-assisted-fecundity women (1 specificity), against the true positive rate, i.e., the rate of correctly classifying high-assisted-fecundity women (sensitivity), of the test data. The ROC curve is a visual index of the discriminatory capacity of the model. The further the curve lies above the reference line, at which the model has similar chances of correctly classifying women with high-assisted fecundity versus women with low-assisted fecundity (i.e., area under the ROC curve = 0.5), the more the discriminatory capacity of the model. As a general guideline, an area under the ROC curve = 0.5 can be considered that has not discrimination ability, > 0.5 and < 0.7 poor discrimination, ≥ 0.7 and < 0.8 acceptable discrimination, ≥ 0.8 and < 0.9 excellent discrimination, and ≥ 0.9 outstanding discrimination [13].
The significance value of the Hosmer-Lemeshow statistic and the resulting calibration plot were used as indexes of model’s goodness of fit or calibration. The calibration plot represents graphically the agreement between predicted and actual probabilities. It is based on the contingency table for Hosmer-Lemeshow statistic, which aggregates cases into 10 groups of approximately equal size established according to their predicted values arranged from lowest to highest values. A linear regression model was applied to estimate the coefficients of the linear equation and draw the line that best fitted the points in the calibration plot.
Values shown in the text and tables are means and standard deviations (SDs), medians and interquartile ranges (IQRs), absolute frequencies and percentages, regression coefficients and standard errors (SEs), and exponentiated regression coefficients and 95% confidence intervals (CIs). Note that exponentiated regression coefficients should be interpreted as odds ratios (ORs). All the analyses were carried out using the Statistical Package for Social Sciences (IBM SPSS Statistics, version 24; © Copyright IBM Corporation and its licensors 1989, 2016).
Results
Table 1 shows descriptive data of potential predictors of women’s assisted fecundity in the development and validation set. Women’s age (P ≤ 0.0005), men’s age (P ≤ 0.016), and basal E2 (P ≤ 0.011) were significantly lower in the development set compared with the validation set. The distribution of types of menstrual cycle (P ≤ 0.002) and male infertility etiologies (P ≤ 0.0005) in the development and validation set were also significantly different.
Table 2 displays descriptive data of potential predictors of women’s assisted fecundity in the development and validation set stratified by women’s assisted fecundity. In the development set, the high-assisted-fecundity group displayed significantly lower women’s age (P ≤ 0.0005), men’s age (P ≤ 0.001), and number of cigarettes smoked per day by women (P ≤ 0.01) compared with the low-assisted-fecundity group. In addition, high-assisted-fecundity women exhibited distinct (P ≤ 0.01) proportions of infertility etiologies as well as a higher duration of the menstrual cycle (P ≤ 0.049), number of antral follicles (P ≤ 0.0005), and basal levels of AMH (P ≤ 0.0005) and LH (P ≤ 0.034). Likewise, in the validation set, high-assisted-fecundity women exhibited lower women’s age (P ≤ 0.0005) and higher number of antral follicles (P ≤ 0.002) and basal levels of AMH (P ≤ 0.0005). However, in contrast to the development set, no significant differences between the low and the high-assisted-fecundity group in men’s age, number of cigarettes smoked per day by women, duration of the menstrual cycle, basal levels of LH, and female infertility etiology were evidenced. Moreover, a significantly (P ≤ 0.005) lower percentage of diseased women (19.5 vs. 40.7%) and a heterogeneous distribution of male infertility etiology (P ≤ 0.037) were observed in the high-assisted-fecundity group.
Table 2.
Descriptive data of potential predictors of women’s assisted fecundity in the development and validation set stratified by women’s assisted fecundity
| Potential predictors | Development set | Validation set | ||||||||
|---|---|---|---|---|---|---|---|---|---|---|
| n | Low-assisted fecundity | n | High-assisted fecundity | P | n | Low-assisted fecundity | n | High-assisted fecundity | P | |
| Women’s age | 196 | 35.7 (3.0)a | 335 | 34.1 (2.9) | 0.0005 | 54 | 37.1 (2.9) | 123 | 35.4 (2.8) | 0.0005 |
| Men’s age | 196 | 37.8 (5.2) | 335 | 36.3 (4.1) | 0.001 | 49 | 38.8 (5.4) | 118 | 37.4 (4.2) | 0.080 |
| Women’s BMI | 196 | 23.3 (3.5) | 335 | 22.8 (4.0) | 0.160 | 54 | 23.6 (3.6) | 123 | 22.8 (3.6) | 0.195 |
| Women’s tobacco smokingb | 196 | 4.4 (7.3) | 335 | 2.8 (6.17) | 0.010 | 54 | 3.2 (6.5) | 123 | 3.4 (6.7) | 0.896 |
| Men’s tobacco smokingb | 196 | 5.4 (8.4) | 335 | 4.7 (8.0) | 0.370 | 49 | 4.0 (7.5) | 118 | 3.6 (6.7) | 0.750 |
| Type of menstrual cycle | 0.568 | 0.541 | ||||||||
| Regular | 169/196 | 86.2c | 299/335 | 89.3 | 46/54 | 85.2 | 96/123 | 78.0 | ||
| Irregular | 26/196 | 13.3 | 35/335 | 10.4 | 7/54 | 13.0 | 23/123 | 18.7 | ||
| Amenorrhea | 1/196 | 0.5 | 1/335 | 0.3 | 1/54 | 1.9 | 4/123 | 3.3 | ||
| Duration of menstrual cycle (days) | 196 | 29.2 (8.8) | 335 | 31.0 (11.6) | 0.049 | 53 | 28.3 (9.7) | 122 | 30.2 (13.1) | 0.353 |
| Duration of infertility (yrs) | 196 | 2.8 (1.6) | 335 | 2.6 (1.3) | 0.180 | 54 | 2.8 (2.5) | 123 | 2.53 (1.5) | 0.394 |
| No. of previous artificial insemination cycles | 196 | 0.9 (1.4) | 335 | 1.0 (1.4) | 0.568 | 54 | 0.7 (1.3) | 123 | 1.1 (1.4) | 0.053 |
| No. of previous IVF/ICSI cycles | 196 | 0.1 (0.5) | 335 | 0.1 (0.4) | 0.374 | 54 | 0.1 (0.4) | 123 | 0.1 (0.3) | 0.291 |
| No. of previous abortions | 196 | 0.4 (0.8) | 335 | 0.3 (0.6) | 0.097 | 54 | 0.4 (1.0) | 123 | 0.3 (0.7) | 0.683 |
| No. of previous LBs | 196 | 0.07 (0.31) | 335 | 0.04 (0.20) | 0.153 | 54 | 0.04 (0.19) | 123 | 0.04 (0.20) | 0.910 |
| Women’s medical conditiond | 0.146 | 0.005 | ||||||||
| Healthy | 146/196 | 74.5 | 269/335 | 80.3 | 32/54 | 59.3 | 99/123 | 80.5 | ||
| Diseased | 50/196 | 25.5 | 66/335 | 19.7 | 22/54 | 40.7 | 24/123 | 19.5 | ||
| Men’s medical conditiond | 0.465 | 0.738 | ||||||||
| Healthy | 172/196 | 87.8 | 285/335 | 85.1 | 47/54 | 87.0 | 103/123 | 83.7 | ||
| Diseased | 24/196 | 12.2 | 50/335 | 14.9 | 7/54 | 13.0 | 20/123 | 16.3 | ||
| Female infertility etiology | 0.010 | 0.098 | ||||||||
| Tubal factor | 16/196 | 8.2 | 19/335 | 5.7 | 2/54 | 3.7 | 5/123 | 4.1 | ||
| Uterine factor | 24/196 | 12.2 | 51/335 | 15.2 | 7/54 | 13.0 | 14/123 | 11.4 | ||
| Endometriosis | 10/196 | 5.1 | 26/335 | 7.8 | 2/54 | 3.7 | 4/123 | 3.3 | ||
| Ovulatory dysfunction | 7/196 | 3.6 | 36/335 | 10.7 | 5/54 | 9.3 | 13/123 | 10.6 | ||
| Diminished ovarian reserve | 20/196 | 10.2 | 35/335 | 27.2 | 10/54 | 18.5 | 6/123 | 4.9 | ||
| Unknown factor | 49/196 | 25.0 | 71/335 | 10.4 | 12/54 | 22.2 | 50/123 | 40.7 | ||
| Multiple female factors | 65/196 | 33.2 | 91/335 | 21.2 | 15/54 | 27.8 | 30/123 | 24.4 | ||
| Other factors | 5/196 | 2.6 | 6/335 | 1.8 | 1/54 | 1.9 | 1/123 | 0.8 | ||
| Male infertility etiology | 0.570 | 0.037 | ||||||||
| Donor sperm | – | – | – | – | 5/54 | 9.3 | 5/123 | 4.1 | ||
| Oligo, astheno- and/or teratozoospermia | 94/196 | 48.0 | 147/335 | 43.9 | 25/54 | 46.3 | 40/123 | 32.5 | ||
| Cryptozoospermia or azoospermia | 24/196 | 12.2 | 39/335 | 11.6 | 7/54 | 17/54 | 13.0 | 11/123 | 8.9 | |
| Unknown (normozoospermia) | 78/196 | 39.8 | 149/335 | 44.5 | 31.5 | 67/123 | 54.5 | |||
| No. of antral follicles | 196 | 12.9 (7.0) | 335 | 16.1 (9.4) | 0.0005 | 54 | 12.8 (7.5) | 123 | 16.6 (7.6) | 0.002 |
| Basal AMH (ng/mL) | 196 | 1.9 (0.9) | 335 | 2.3 (1.7) | 0.0005 | 54 | 1.7 (1.1) | 123 | 2.6 (1.6) | 0.0005 |
| Basal FSH (mIU/mL) | 196 | 7.3 (6.2) | 335 | 7.4 (4.3) | 0.833 | 54 | 7.3 (2.5) | 123 | 7.2 (2.8) | 0.780 |
| Basal LH (mIU/mL) | 196 | 5.8 (2.5) | 335 | 6.9 (7.6) | 0.034 | 54 | 6.5 (5.6) | 123 | 6.9 (3.6) | 0.524 |
| Basal E2 (pg/mL) | 196 | 51.8 (35.7) | 335 | 50.0 (25.2) | 0.483 | 54 | 61.6 (46.5) | 123 | 56.7 (44.3) | 0.505 |
| Basal TSH (μIU/mL) | 196 | 2.1 (0.8) | 335 | 2.1 (0.9) | 0.700 | 54 | 1.9 (1.0) | 123 | 2.2 (1.3) | 0.180 |
| Basal prolactin (ng/mL) | 196 | 24.2 (17.6) | 335 | 22.1 (12.7) | 0.115 | 54 | 20.7 (8.5) | 123 | 22.7 (11.3) | 0.256 |
aValues are means and SDs in parenthesis
bNumber of cigarettes smoked per day for the 3 months before starting the first intended oocyte retrieval cycle
cValues are percentages
dMedical conditions were assessed following the International Statistical Classification of Diseases and Related Health Problems 10th Revision (ICD-10 Version 2016) [14]
After converting the categorical variables “type of menstrual cycle” (reference level: “regular menstrual cycle”), “female infertility etiology” (reference level: “tubal factor”), and “male infertility etiology” (reference level: “donor sperm”) into two, seven, and three binary dummy variables, respectively, a forward-stepwise-selection logistic regression model was applied. Seven out of 32 potential predictors were finally included into the predictive model: women’s age, cause of female infertility due to multiple female factors, number of antral follicles, women’s tobacco smoking, presence of irregular menstrual cycles, and basal levels of prolactin and LH. Table 3 shows the coefficient table output from this logistic regression analysis. The intercept (constant), number of antral follicles, and basal levels of LH exhibited positive regression coefficients. In contrast, the remaining variables displayed negative coefficients.
Table 3.
Coefficient table output from the logistic regression model predicting women’s assisted fecundity
| Predictorsa | Regression coefficient (SE) | P | OR (95% CI) |
|---|---|---|---|
| Intercept (constant) | 5.678 (1.295) | P ≤ 0.0005 | 292.416 |
| Women’s age (yrs) | − 0.162 (0.034) | P ≤ 0.0005 | 0.850 (0.795–0.910) |
| Multiple female factors | − 0.632 (0.224) | P ≤ 0.005 | 0.532 (0.343–0.825) |
| No. of antral follicles | 0.045 (0.015) | P ≤ 0.001 | 1.046 (1.017–1.077) |
| Women’s tobacco smokingb | − 0.042 (0.014) | P ≤ 0.001 | 0.959 (0.932–0.986) |
| Irregular menstrual cycle | − 0.885 (0.332) | P ≤ 0.008 | 0.413 (0.215–0.792) |
| Basal prolactin (ng/mL) | − 0.015 (0.007) | P ≤ 0.026 | 0.985 (0.972–0.998) |
| Basal LH (mIU/mL) | 0.104 (0.038) | P ≤ 0.002 | 1.110 (1.030–1.196) |
aPredictors are arranged following the order in which they were entered into the forward-stepwise logistic regression analysis. All the predictors are continuous variables excepting “multiple female factors” and “irregular menstrual cycle” that are binary dummy variables
bNumber of cigarettes smoked per day for the 3 months before starting the first intended oocyte retrieval cycle
Overall, the predictive model is correct about two out of three times. In particular, the value of the area under the ROC curve shown in Fig. 1 is 0.718 (asymptotic 95% CI 0.672–0.763) in the development set and 0.649 (asymptotic 95% CI 0.560–0.738) in the validation set. We should bear in mind that the area under the ROC curve indicates how much the model is capable of discriminating between high and low-assisted-fecundity women. The higher the area under the ROC curve (up to the maximum 1.0), the better the model is at distinguishing between these groups of women.
Fig. 1.

ROC curves in the development (a) and validation (b) set. The diagonal depicts the reference line at which the model has similar chances of correctly classifying women with high- or low-assisted fecundity (i.e., the line whose area under the ROC curve = 0.5)
The Hosmer-Lemeshow goodness-of-fit statistic was non-significant (P ≤ 0.329), which means that the model adequately fitted the data. The respective calibration plot showed no significant over or underestimation of predictor effects (Fig. 2). Note that the 95% CI of the calibration slope (regression beta coefficient: 1.004; P ≤ 0.0005) includes one (0.737–1.270) and the 95% CI of the intercept (constant: − 0.122; P ≤ 0.977) includes zero (− 9.400–9.157).
Fig. 2.
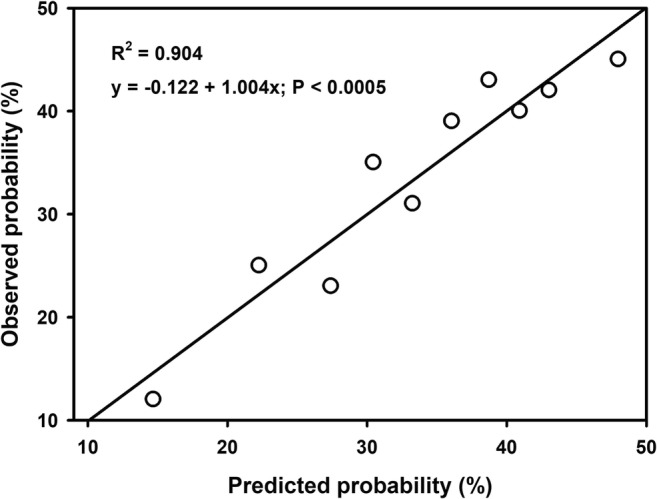
Calibration plot based on the contingency table for Hosmer-Lemeshow statistic, which aggregates the observations into 10 groups of approximately equal size established according to their predicted values arranged from lowest to highest values
Table 4 shows the estimated probabilities of being a high-assisted-fecundity woman in six groups of women established according to both the total number of ORC women underwent and whether or not they had a LB. A total number of 1433 women were analyzed including the groups of women that were excluded from the study because they did not meet the methodological criteria for inclusion in the high or low-assisted-fecundity group. The estimated probability of being a high-assisted-fecundity woman was significantly higher in women that had a LB in the first, second, or third ORC compared to women that did not have a LB in the first, second, or third ORC, respectively. No significant differences among women that had a LB in the first, second, or third ORC were evidenced. Likewise, no significant differences among women that had no LB in the first, second, or third ORC were found.
Table 4.
Estimated probabilities of being a high-assisted-fecundity woman in six groups of women established according to both the total number of ORC women underwent and whether or not they had a LB
| Total number of ORC | LB | Inclusion into the study | Number | Estimated probability |
|---|---|---|---|---|
| 1 | Yes | Yes | 458 | 0.697a (0.227)c |
| No | No | 233 | 0.581 (0.318) | |
| 2 | Yes | No | 236 | 0.657b (0.242) |
| No | No | 162 | 0.567 (0.308) | |
| 3 | Yes | No | 94 | 0.686a (0.229) |
| No | Yes | 250 | 0.545 (0.284) |
a,bValue significantly different from women that did not have a LB after undergoing a total number of one (a,bP ≤ 0.0005), two (aP ≤ 0.0005; bP ≤ 0.005), or three (a,bP ≤ 0.0005) ORC, respectively. Independent-samples median test and independent-samples Kruskal-Wallis test were applied to test the null hypotheses that the medians and distribution of predictions, respectively, were the same across the six categories of women. Asymptotic significances (two-sided tests) were adjusted by the Bonferroni correction for multiple tests
cValues are medians and IQRs in parenthesis
Discussion
The present study introduces a prognostic logistic regression model for women’s assisted fecundity before starting the first IVF/ICSI treatment. The discriminatory capacity of this predictive model can be considered acceptable [13] with a value of c-statistic or area under de ROC curve of 71.8% in the development set, but displays a poor discriminatory capacity in the validation set with an area under the ROC curve of 64.9%. That is, overall, the predictive model is correct about two out of three times. In addition, the predictive model fits adequately the data with no significant over or underestimation of predictor effects.
Previous predictive models may be used to estimate the probability of LB prior to the first IVF/ICSI cycle after adjusting for many covariates [1, 4–9]. However, these models are based on cohorts of women displaying different capacities to have a LB using assisted reproduction techniques. The inclusion into the prediction model of a mixed cohort of women that have or have not a LB at the first treatment cycle may be a handicap to predict and discriminate between high- and low-assisted-fecundity women. In the present study, we have selected two groups of women at the extremes of prognosis: those that reached a LB at the first treatment cycle and those that did not succeed in having a LB event after completing three treatment cycles. This approach reduces the variability in assisted fecundity that may be present among women that do not have a LB in the first IVF/ICSI cycle. Therefore, it may help to more effectively identify the clinical and demographic traits that characterize women with high- or low-assisted fecundity. Notwithstanding, due to Spanish legal restrictions, the low-assisted-fecundity group was established on the basis of only three unsuccessful treatment cycles. In a private setting, low-assisted-fecundity women may undergo more treatment cycles and, therefore, the clinical and demographic traits of low-assisted-fecundity women may be better characterized. Unfortunately, this strategy may reduce the sample size of low-assisted-fecundity women and, consequently, decrease the predictive performance of the model. In the present study, the sample size of low-assisted-fecundity women used to develop (196 out of 531 women) and validate (54 out of 177 women) the model was also limited. However, despite this sample-size restriction, the values of the c-statistic (discriminatory capacity of the model) obtained in both the development and validation set are similar to those found in recent models based on either woman-specific or cumulative LB probabilities, even after analyzing large nationwide registry data [1] (Table 5).
Table 5.
C-statistic values found in the present study versus those reported in recent studies based on predictive models of either woman-specific LB probabilities at the first oocyte retrieval cycle or cumulative LB probabilities across multiple complete IVF/ICSI cycles
| Reference | Development set | Validation set | ||
|---|---|---|---|---|
| n | C-statistic | n | C-statistic | |
| Present study | 531 | 0.72 (0.67–0.76)a | 177 | 0.65 (0.56–0.74) |
| Predictive models based on woman-specific LB probabilities at the first oocyte retrieval cycle | ||||
| Dhillon et al. [4] | 9915 | 0.62 (0.61–0.63) | 2723 | 0.62 (0.60–0.64) |
| Sarais et al. [5] | – | – | 772 | 0.64 (0.61–0.67) |
| Qui et al. [6] | 5032 | 0.74 ± 0.02b | 2156 | 0.73 |
| Predictive models based on cumulative LB probabilities of LB across multiple cycles | ||||
| van Loendersloot et al. [15] | 2621 | 0.68 (0.65–0.70) | 515 | 0.68 (0.63–0.73) |
| McLernon et al. [1] (pretreatment model) | 113,873 | 0.73 (0.72–0.74) | – | – |
| McLernon et al. [1] (post-treatment model) | 113,873 | 0.72 (0.71–0.73) | – | – |
| Leijdekkers et al. [6] (pretreatment model) | – | – | 1515 | 0.66 (0.64–0.68) |
| Leijdekkers et al. [6] (post-treatment model) | – | – | 1515 | 0.71 (0.69–0.73) |
aValues in parenthesis are 95% CIs
bValue is the SD across different folds in a five-fold cross-validation
Note that we have defined a complete cycle as “an ovarian stimulation cycle performed to generate embryos to be transferred in subsequent fresh or embryo transfers, with no frozen embryos left over for further transfers”. Only women that had a LB in the first IVF/ICSI cycle using fresh or frozen embryos and women that did not succeed in having a LB after completing three IVF/ICSI cycles were entered into the study. That is, high-assisted-fecundity women may have had a LB in the first IVF/ICSI cycle after experiencing the first or any subsequent frozen embryo transfer. Likewise, low-assisted-fecundity women may have completed their third unsuccessful IVF/ICSI cycle after undergoing one or more embryo transfers. Consequently, the predicted probabilities of being a high or low-assisted-fecundity woman estimated by the present model should be interpreted as probabilities per IVF/ICSI cycle, irrespectively of the number of embryo transfers undergone by women. In any case, it is important to remark that this model does not estimate LB probabilities, just women’s assisted fecundity before starting the first IVF/ICSI treatment cycle.
As examples of model predictions, we may think on four imaginary women. The first woman is aged 30 years before undergoing her first IVF/ICSI cycle in our Assisted Reproduction Unit. She does not exhibit multiple causes of female infertility nor irregular menstrual cycles, has 20 antral follicles, does not smoke, and her basal levels of prolactin and LH are 22.14 ng/mL and 6.95 mIU/mL, respectively. She has a probability of 0.89 of being a high-assisted-fecundity woman. The second woman displays similar predictor values than the first woman, except that she smokes 20 cigarettes per day, has a probability of 0.78. The third woman is 40 years old, smokes 20 cigarettes per day, and has 10 antral follicles, all other things being equal. She has a probability of 0.31 of being a high-assisted-fecundity woman. Finally, the fourth woman is also 40 years old and smokes 20 cigarettes per day but has five antral follicles and exhibits multiple causes of female infertility and irregular menstrual cycles, all other things being equal. She has a probability of LB at the first treatment cycle of only 0.07. Thus, whereas the two 30-year-old women have relatively high probabilities of being high-assisted-fecundity women, the two 40-year-old women cannot expect to be high-assisted-fecundity women. They will most likely have to repeat treatments before having a successful cycle (the third woman) or even may not have a LB after undergoing three treatment cycles (the four woman). Note that low-assisted-fecundity women exhibit the opposite regression coefficients than high-assisted-fecundity women. As the present model was built to estimate the probability of being a high-assisted-fecundity woman, a probability of 0.07 of being a high-assisted-fecundity woman is translated into a probability of being a low-assisted-fecundity woman of 0.93.
We should bear in mind that the present model was built to discriminate between high- and low-assisted-fecundity women. Women with average assisted fecundity were excluded from the study. Thus, we may think that the model may have low clinical significance because it may only identify high- and low-assisted-fecundity women. However, the model may also discriminate between women displaying average-assisted fecundity and women with a low or zero-assisted fecundity. In fact, like women that had a LB in the first ORC, the estimated probability of being a high-assisted-fecundity woman in women that had a LB in the second or third ORC (average-assisted-fecundity women) was significantly higher than the probability exhibited by women that did not have a LB in the first, second, or third ORC, respectively (Table 4).
Note that IVF/ICSI practice and policy as well as clinical and demographic traits of infertile women are not constant along time. Likewise, clinical and demographic traits of infertile women are subjected to geographical, cultural, and ethnical variations. In the present study, women’s and men’s age, and basal E2 were significantly higher in the validation set compared to the development set. This is a clear example of time-based variations. Moreover, when clinical traits were similar in the development and validation set (i.e., there were not time variations), clinical traits of high and low-assisted-fecundity women differed between the development and validation set. For instance, Table 1 shows that there were not significant differences between the development and validation set in women’s tobacco smoking and medical condition. However, Table 2 indicates that whereas high-assisted-fecundity women in the development set smoked a significantly lower number of cigarettes per day than low-assisted-fecundity women, no significant differences between high and low-assisted-fecundity women were found in the validation set. Contrariwise, whereas no significant differences in medical condition between high and low-assisted-fecundity women were observed in the development set, a significantly higher percentage of diseased women were found in the low-assisted-fecundity group within the validation set. That is to say, the predictive model developed in the present study is not a final and robust model ready to be applied or externally validated in other settings. It is rather an introductory local model that should be continuously actualized as the number of cases increases. This model and their predictors are very specific to our patient population. The predictive variables entered into the present model may not necessarily be selected in other settings or periods of time. Note that we have deliberately developed this predictive model using IBM SPSS Statistics, a well-known intuitive statistical package that does not require high levels of statistical sophistication. Consequently, most fertility clinics may develop and actualize without much difficulty their own predictive models, adapted to their local geographical, cultural, and ethnical contexts, using IBM SPSS Statistics or other similar easy-to-apply statistical packages.
We have previously reported that cumulative LB probabilities exhibit an inverted pattern to that displayed by each individual consecutive ORC. In particular, whereas cumulative LB probabilities increase as number of ORC rises, cycle-specific LB probabilities decrease at each consecutive ORC [2]. Women should be informed about this inverse relationship before embarking in an IVF/ICSI treatment journey. Otherwise, cumulative probabilities may incentivize infertile women, specifically those with low or zero-assisted fecundity, to have more treatment cycles after one or more unsuccessful attempts [2]. In the present study, we have introduced a logistic regression model that may predict women’s assisted fecundity before starting the first IVF/ICSI cycle, i.e., whether women may expect to have a LB at the first treatment cycle or will likely have to wait longer for having a LB. The information provided by this predictive model complements the approach of estimating cumulative and cycle-specific probabilities of LB over multiple treatment cycles. With all this information in hand, infertile women would be in a better position to make decisions about pursuing further IVF/ICSI treatments before or after one or more unsuccessful attempts.
Conclusion
The present study shows that women’s assisted fecundity can be predicted before starting the first IVF/ICSI treatment using a relatively small number of predictors. The resulting model exhibits an acceptable discriminatory capacity and fits adequately the data with no significant over or underestimation of predictor effects. The approach we have followed to predict women’s assisted fecundity may complement the traditional procedure of estimating cumulative and cycle-specific probabilities of LB across multiple complete IVF/ICSI cycles. In addition, it provides an easy-to-apply methodology for fertility clinics to develop and actualize their own predictive models.
Compliance with ethical standards
This study was approved by the Ethical Committee of Clinical Investigation, Valencia University Clinical Hospital, on November 30 2017 (2017/316).
Footnotes
The original version fo this article was revised: In Table 2, the headers "Development set" and "Validation set" were not aligned to its sub-header.
Publisher’s note
Springer Nature remains neutral with regard to jurisdictional claims in published maps and institutional affiliations.
Change history
12/23/2019
The original article unfortunately contained a mistake. In Table 2, the headers “Development set” and “Validation set” were not aligned to to their sub-headers.
Change history
12/23/2019
The original article unfortunately contained a mistake. In Table 2, the headers ���Development set��� and ���Validation set��� were not aligned to to their sub-headers.
References
- 1.McLernon DJ, Steyerberg EW, Te Velde ER, Lee AJ, Bhattacharya S. Predicting the chances of a live birth after one or more complete cycles of in vitro fertilisation: population based study of linked cycle data from 113 873 women. BMJ. 2016;355:i5735. doi: 10.1136/bmj.i5735. [DOI] [PMC free article] [PubMed] [Google Scholar]
- 2.Tarín JJ, Pascual E, Pérez-Hoyos S, Gómez R, García-Pérez MA, Cano A. Cumulative probabilities of live birth across multiple complete IVF/ICSI cycles: a call for attention. J Assist Reprod Genet (in press). [DOI] [PMC free article] [PubMed]
- 3.Zegers-Hochschild F, Adamson GD, Dyer S, Racowsky C, de Mouzon J, Sokol R, Rienzi L, Sunde A, Schmidt L, Cooke ID, Simpson JL, van der Poel S. The international glossary on infertility and fertility care, 2017. Hum Reprod. 2017;32:1786–1801. doi: 10.1093/humrep/dex234. [DOI] [PMC free article] [PubMed] [Google Scholar]
- 4.Dhillon RK, McLernon DJ, Smith PP, Fishel S, Dowell K, Deeks JJ, Bhattacharya S, Coomarasamy A. Predicting the chance of live birth for women undergoing IVF: a novel pretreatment counselling tool. Hum Reprod. 2016;31:84–92. doi: 10.1093/humrep/dev268. [DOI] [PubMed] [Google Scholar]
- 5.Sarais V, Reschini M, Busnelli A, Biancardi R, Paffoni A, Somigliana E. Predicting the success of IVF: external validation of the van Loendersloot’s model. Hum Reprod. 2016;31:1245–1252. doi: 10.1093/humrep/dew069. [DOI] [PubMed] [Google Scholar]
- 6.Qiu J, Li P, Dong M, Xin X, Tan J. Personalized prediction of live birth prior to the first in vitro fertilization treatment: a machine learning method. J Transl Med. 2019;17:317. doi: 10.1186/s12967-019-2062-5. [DOI] [PMC free article] [PubMed] [Google Scholar]
- 7.McLernon DJ, Maheshwari A, Lee AJ, Bhattacharya S. Cumulative live birth rates after one or more complete cycles of IVF: a population-based study of linked cycle data from 178,898 women. Hum Reprod. 2016;31:572–581. doi: 10.1093/humrep/dev336. [DOI] [PubMed] [Google Scholar]
- 8.Leijdekkers JA, Eijkemans MJC, van Tilborg TC, Oudshoorn SC, McLernon DJ, Bhattacharya S, Mol BWJ, Broekmans FJM, Torrance HL, OPTIMIST group Predicting the cumulative chance of live birth over multiple complete cycles of in vitro fertilization: an external validation study. Hum Reprod. 2018;33:1684–1695. doi: 10.1093/humrep/dey263. [DOI] [PubMed] [Google Scholar]
- 9.Modest AM, Wise LA, Fox MP, Weuve J, Penzias AS, Hacker MR. IVF success corrected for drop-out: use of inverse probability weighting. Hum Reprod. 2018;33:2295–2301. doi: 10.1093/humrep/dey309. [DOI] [PMC free article] [PubMed] [Google Scholar]
- 10.Wilkinson J, Roberts SA, Vail A. Developments in IVF warrant the adoption of new performance indicators for ART clinics, but do not justify the abandonment of patient-centred measures. Hum Reprod. 2017;32:1155–1159. doi: 10.1093/humrep/dex063. [DOI] [PubMed] [Google Scholar]
- 11.Daya S. Life table (survival) analysis to generate cumulative pregnancy rates in assisted reproduction: are we overestimating our success rates? Hum Reprod. 2005;20:1135–1143. doi: 10.1093/humrep/deh889. [DOI] [PubMed] [Google Scholar]
- 12.Caetano SJ, Sonpavde G, Pond GR. C-statistic: a brief explanation of its construction, interpretation and limitations. Eur J Cancer. 2018;90:130–132. doi: 10.1016/j.ejca.2017.10.027. [DOI] [PubMed] [Google Scholar]
- 13.Hosmer DW, Lemeshow S, Sturdivant RX. Applied logistic regression. 3. New Jersey: John Wiley and Sons, Inc.; 2013. [Google Scholar]
- 14.Tarín JJ, Pascual E, García-Pérez MA, Gómez R, Cano A. Women’s morbid conditions are associated with decreased odds of live birth in the first IVF/ICSI treatment: a retrospective single-center study. J Assist Reprod Genet. 2019;36:697–708. doi: 10.1007/s10815-019-01401-4. [DOI] [PMC free article] [PubMed] [Google Scholar]
- 15.van Loendersloot LL, van Wely M, Repping S, Bossuyt PM, van der Veen F. Individualized decision-making in IVF: calculating the chances of pregnancy. Hum Reprod. 2013;28:2972–2980. doi: 10.1093/humrep/det315. [DOI] [PubMed] [Google Scholar]