Abstract
To test the hypothesis that fibroblast growth factor 23 (FGF23) is directly regulated by energy intake, in vivo and in vitro experiments were conducted. Three groups of rats were fed diets with high (HC), normal (NC) and low (LC) caloric content that resulted in different energy intake. In vitro, UMR106 cells were incubated in high (HG, 4.5 g/l) or low glucose (LG, 1 g/l) medium. Additional treatments included phosphorus (P), mannitol, rapamycin and everolimus. Intestinal absorption of P and plasma P concentrations were similar in the three groups of rats. As compared with NC, plasma FGF23 concentrations were increased in HC and decreased in the LC group. A significant correlation between energy intake and plasma FGF23 concentrations was observed. In vitro, mRNA FGF23 was significantly higher in UMR106 cells cultured in HG than in LG. When exposed to high P, mRNA FGF23 increased but only when cells were cultured in HG. Cells incubated with HG and mechanistic target of rapamycin (mTOR) inhibitors expressed low mRNA FGF23, similar to the values obtained in LG. In conclusion, this study shows a direct regulation of FGF23 production by energy availability and demonstrates that the mTOR signaling pathway plays a central role in this regulatory system.
Subject terms: Endocrinology, Endocrine system and metabolic diseases
Introduction
Fibroblast growth factor 23 (FGF23) is a phosphaturic hormone secreted by osteocytes/osteoblasts that plays a major role in the regulation of mineral metabolism1. The interaction of FGF23 with its receptor, FGFR1c, and its co-receptor, klotho, produces two distinct effects in the kidneys: (a) FGF23 increases phosphaturia by inducing internalization of the sodium-dependent phosphate (P) transporters (NaPi2a and NaPi2c)2; and, (b) FGF23 modulates vitamin D metabolism through downregulation of 1-α-hydroxylase (CYP27B1) and upregulation of 24-hydroxylase (CYP24A1), thus leading to a decrease in circulating calcitriol concentrations2.
Increased levels of FGF23, usually found in patients with renal failure, have been reported as a risk factor of cardiovascular mortality3. The relationship between high FGF23 and mortality is not restricted to patients with kidney disease but has also been identified in the general population4,5.
Synthesis and secretion of FGF23 is regulated mainly by dietary P and increased P balance is thought to be the main stimulus for FGF23 secretion6. In addition, FGF23 production is under hormonal control by calcitriol, that decreases FGF23 synthesis7. Moreover, parathyroid hormone8, inflammation9 and iron deficiency10 have been reported to influence FGF23 production.
Epidemiological studies have suggested that FGF23 might be regulated by energy intake. FGF23 has been shown to be elevated in obese people11 and increased energy intake has been identified as a potential predictor of plasma FGF23 concentrations12. In addition, metabolites involved in the regulation of energy metabolism have been recently reported to regulate FGF23 production, although the results are somewhat contradictory since increases in both insulin, that is typically associated to energy repletion, and AMP-activated kinase (AMPK), which is activated by energy depletion, have been reported to decrease FGF23 synthesis13,14.
Experimental work has shown that feeding hypercaloric diets to rodents results in a consistent increase in plasma and bone FGF2315,16. In these studies, energy density of food was increased by elevating the fat content of the diet. In addition to the effect of increased caloric intake, high fat feeding may elicit systemic inflammation17 and renal injury18 which could also influence FGF2319, thus a direct relationship between energy intake and FGF23 has not been clearly established.
The mechanistic (previously mammalian) target of rapamycin (mTOR) pathway controls cellular signaling in response to nutrients and mitogens, and inhibition of mTOR has been shown to mimic caloric restriction20. mTOR is a protein kinase that belongs to the phosphoinositide 3-kinase (PI3K)-related kinase family and interacts with several proteins to form two distinct multiprotein complexes: mTORC1 and mTORC221. Only mTORC1, which is a key sensor of energy availability and nutritional status, is inhibited by rapamycin22.
The aim of this work was to test the hypothesis that FGF23 is directly regulated by energy intake. To this purpose we investigated, in vivo, the effect of increased and reduced energy intake on FGF23. In addition, the effect of energy availability on FGF23 production by bone cells was studied in vitro and the involvement of the mTOR signaling pathway in the regulation of FGF23 production was evaluated.
Results
In vivo studies
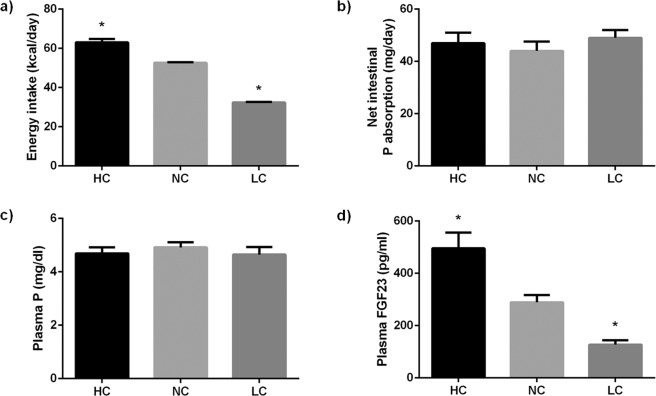
As expected, energy intake was significantly (p < 0.001) higher in the HC group, 63.0 ± 1.7 kcal/day, than in the NC group, 52.6 ± 0.3 kcal/day. Differences in energy intake in the HC group were not as high as would be predicted from the energy content of the diets because these rats, that were fed ad libitum, voluntarily reduced their food consumption to 12.0 ± 0.3 g/day, when compared with the NC group, 14.9 ± 0.1 g/day. Rats fed LC had their food supply adjusted to 24.7 ± 0.3 g/day and energy intake was much lower (p < 0.0001) in LC rats, 32.4 ± 0.3 kcal/day, than in NC rats (Fig. 1a). Plasma glucose concentrations were not influenced by caloric intake and similar values were obtained in rats fed NC, 124.6 ± 5.7 mg/dl, and LC, 126.9 ± 4.7 mg/dl; rats fed HC had slightly lower glucose concentrations, 113.0 ± 8.3 mg/dl, but the differences with NC and LC were not significant.
Figure 1.
Energy intake (a), net intestinal absorption of P (b), plasma P concentrations (c) and plasma FGF23 concentrations (d) in rats (n = 9 per group) fed diets with a high (HC), normal (NC) or low (LC) caloric content. *p < 0.05 vs NC; one-way ANOVA with Fisher LSD post-hoc test.
Even though all diets had the same P concentration (0.6%), P intake was modulated by food intake. Thus, the HC group ingested slightly less P, 72.2 ± 2.0 mg/day, than the NC group, 89.7 ± 0.6 mg/day, while rats fed LC ingested more P (p < 0.0001) than the other groups, 148.3 ± 1.5 mg/day. To assess whether P absorption was different between groups, fecal P was measured and net intestinal absorption of P was calculated. As shown in Fig. 1b, there were no major differences in the amount of P absorbed between the study groups: NC, 44.0 ± 3.6 mg/day, HC, 47.0 ± 4.0 mg/day, and LC, 49.0 ± 3.0 mg/day.
Plasma P concentration was not influenced by calorie intake and values were slightly lower in the HC group, 4.7 ± 0.2 mg/dl, and in the LC group, 4.7 ± 0.3 mg/dl, than the NC group, 5.0 ± 0.2 mg/dl (Fig. 1c).
Plasma FGF23 concentrations in NC rats were 289 ± 28 pg/ml. A significant (p = 0.001) increase in plasma FGF23 was observed in the HC group, 496 ± 60 pg/ml. In contrast, rats in the LC group had lower (p = 0.009) FGF23 concentrations, 127 ± 17 pg/ml, than rats in the NC group (Fig. 1d). A strong correlation between energy intake and plasma FGF23 was observed (r = 0.705, p < 0.0001) (Fig. 2a); however, FGF23 did not correlate with the intestinal absorption of P (r = −0.125, p = 0.535) (Fig. 2b) or with plasma P concentration (r = −0.154, p = 0.493) (Fig. 2c).
Figure 2.
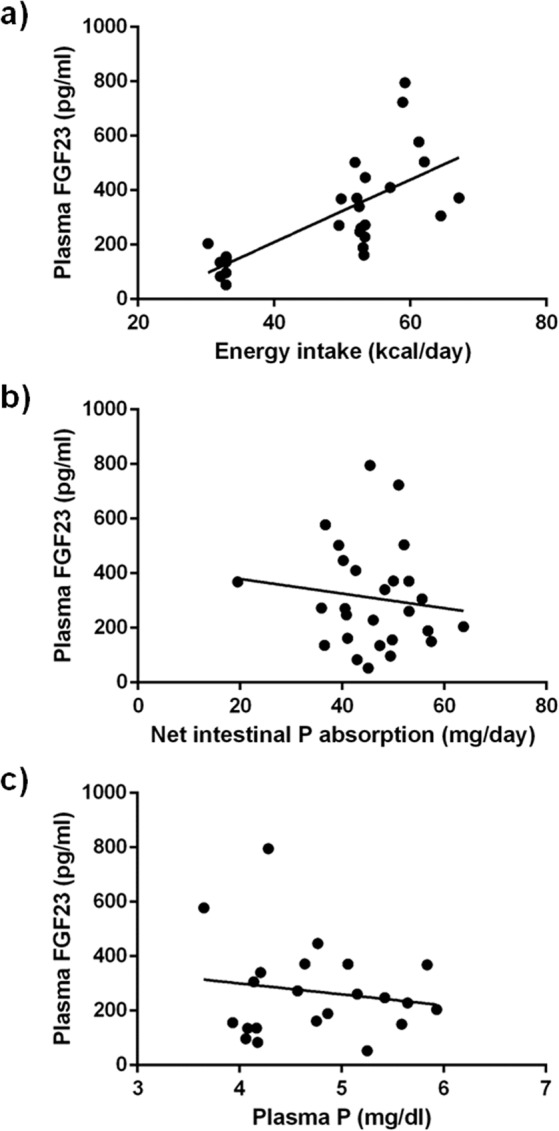
Correlation between: (a) plasma FGF23 concentrations and energy intake (r = 0.705, p < 0.0001), (b) plasma FGF23 concentrations and net intestinal absorption of P (r = −0.124, p = 0.535), and (c) plasma FGF23 and plasma P concentrations (r = −0.154, p = 0.493) in rats fed diets with a high (HC), normal (NC) or low (LC) caloric content. Pearson correlation test.
As compared with the NC group, 98.4 ± 17.8 pg/ml, plasma calcitriol levels were reduced (p = 0.0003) in the rats fed HC, 22.4 ± 8.2 pg/ml, whereas they were increased in the LC group, 185.6 ± 7.7 pg/ml, (p < 0.0001 vs NC) (Fig. 3a). Plasma calcitriol and FGF23 concentrations were inversely correlated (r = −0.803, p < 0.0001) (Fig. 3b).
Figure 3.
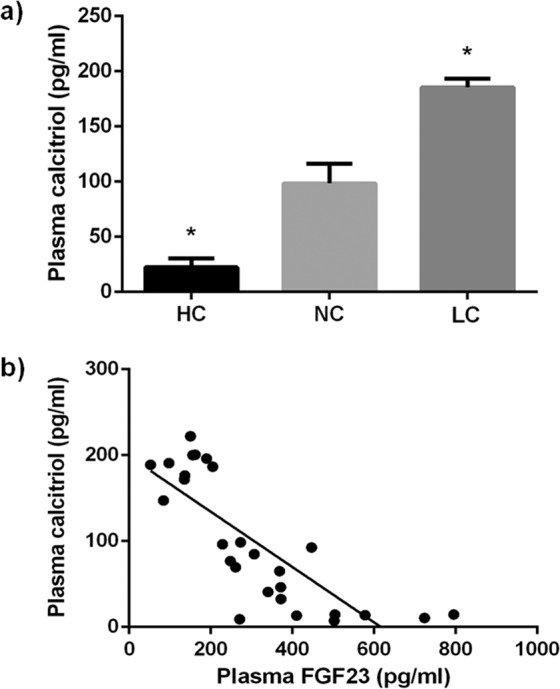
(a) Plasma calcitriol concentrations in rats (n = 9 per group) fed diets with a high (HC), normal (NC) or low (LC) caloric content. *p < 0.05 vs NC; one-way ANOVA with Fisher LSD post-hoc test. (b) Correlation between plasma FGF23 and plasma calcitriol concentrations (r = −0.803, p < 0.0001) in rats fed diets with a high (HC), normal (NC) or low (LC) caloric content. Pearson correlation test.
In vitro studies
FGF23 mRNA expression was significantly higher (p < 0.0001) in UMR 106 cells cultured for 6 days in HG, 1.02 ± 0.09, than in UMR 106 cells cultured in LG, 0.59 ± 0.03. However, a shorter exposure to LG or a moderate decrease in glucose concentration did not reduce mRNA FGF23 (Suppl. Fig. 1). When osmolality of the LG medium was increased to the same level than the HG medium by adding mannitol, mRNA FGF23 was not affected and remained lower (p = 0.002) in cells incubated in LG + Man, 0.56 ± 0.11, than in cells incubated in HG, 1.02 ± 0.09 (Fig. 4).
Figure 4.
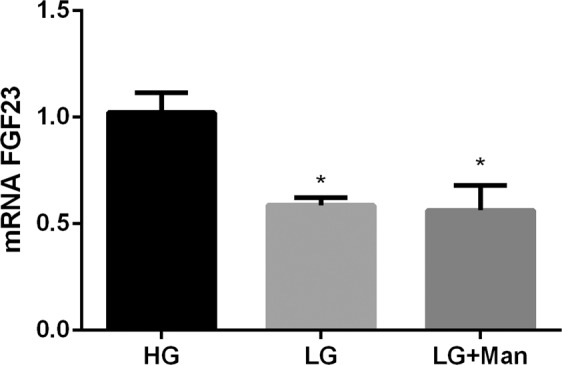
mRNA FGF23 vs Tbp expression (arbitrary units) by UMR 106 cells cultured in medium with high glucose (HG), low glucose (LG) and low glucose + mannitol (LG + Man). *p < 0.05 vs HG; one-way ANOVA with Fisher LSD post-hoc test.
UMR 106 cells increased FGF23 mRNA expression when exposed to HP but only if they were cultured in HG, 1.66 ± 0.18 vs 1.02 ± 0.09 (p < 0.0001). However, cells cultured in LG exposed to HP or NP had comparable FGF23 mRNA expression, 0.50 ± 0.02 and 0.59 ± 0.03, respectively (Fig. 5).
Figure 5.
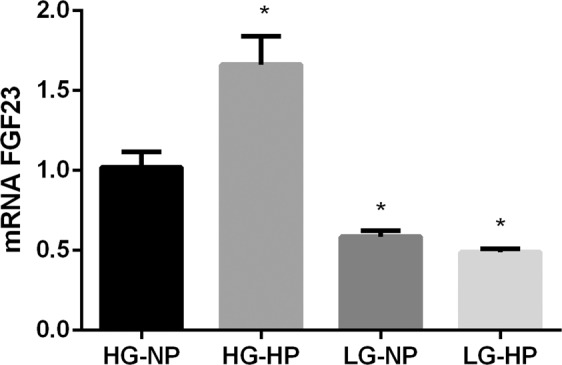
mRNA FGF23 vs Tbp expression (arbitrary units) by UMR 106 cells cultured in medium with high glucose and normal P (HG-NP), high glucose and high P (HG-HP), low glucose and normal P (LG-NP) and low glucose and high P (LG-HP). *p < 0.05 vs HG-NP; one-way ANOVA with Fisher LSD post-hoc test.
Expression of osteogenic genes in UMR 106 cells was not modulated by changes in glucose concentration in the culture medium. Thus, neither mRNA RunX2, 1.03 ± 0.12 vs 0.92 ± 0.06, nor mRNA Osterix, 1.00 ± 0.04 vs 0.96 ± 0.04, changed their expression when cultured in either HG or LG (Fig. 6).
Figure 6.
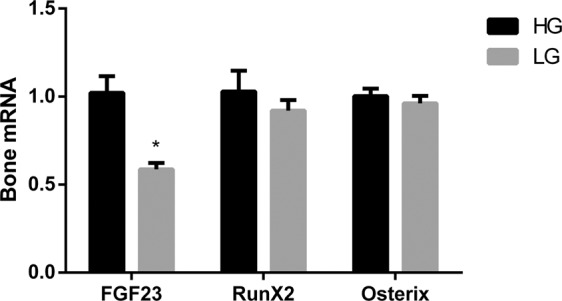
mRNA FGF23 vs Tbp, RunX2 vs Tbp and Osterix vs Tbp expression (arbitrary units) by UMR 106 cells cultured in medium with high glucose (HG, black bars) and low glucose (LG, grey bars). *p < 0.05 vs HG; Student’s t-test.
The addition of rapamycin to UMR 106 cells cultured in HG caused a marked reduction of FGF23 mRNA, from 1.02 ± 0.09 to 0.45 ± 0.03 (p = 0.001), reaching values similar to those observed in cells incubated in LG, 0.59 ± 0.03. Addition of DMSO (rapamycin solvent) to the HG medium did not affect FGF23 mRNA, 1.05 ± 0.14 vs 1.02 ± 0.09 (Fig. 7). Dose response and time response to incubation with rapamycin are shown in Suppl. Fig. 1.
Figure 7.
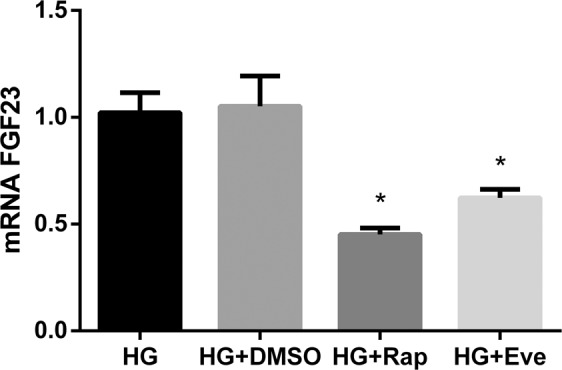
mRNA FGF23 vs Tbp expression (arbitrary units) by UMR 106 cells cultured in medium with high glucose (HG), high glucose + DMSO (HG + DMSO), HG + Rapamycin 10 nM (HG + Rap) and HG + Everolimus 10 nM (HG + Eve). *p < 0.05 vs HG; one-way ANOVA with Fisher LSD post-hoc test.
When UMR 106 cells were incubated with another mTOR inhibitor, everolimus, FGF23 mRNA was also reduced, from 1.02 ± 0.09 to 0.62 ± 0.04 (p = 0.005) (Fig. 7).
UMR 106 cells incubated with rapamycin decreased the expression of stromal interaction molecule 1 (STIM1); thus, after treatment with rapamycin, STIM1 mRNA decreased from 1.01 ± 0.05 to 0.79 ± 0.05 (p = 0.004). Moreover, incubation with everolimus also decreased STIM1 expression from 1.01 ± 0.05 to 0.82 ± 0.06 (p = 0.02) (Fig. 8).
Figure 8.
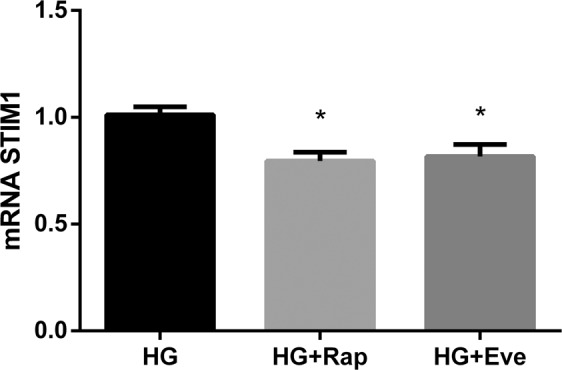
mRNA STIM1 vs Tbp expression (arbitrary units) by UMR 106 cells cultured in medium with high glucose (HG), HG + Rapamycin 10 nM (HG + Rap) and HG + Everolimus 10 nM (HG + Eve). *p < 0.05 vs HG; one-way ANOVA with Fisher LSD post-hoc test.
Discussion
This study was designed to investigate the influence of energy intake on FGF23. Our results demonstrate a direct relationship between these two parameters. Thus, in vivo, an increase in energy intake was associated to higher FGF23 concentrations and a reduction in energy intake resulted in lower FGF23 levels. In addition, in vitro, energy availability also modulated FGF23 expression by bone cells, which decreased when the glucose concentration in the culture medium was reduced. Moreover, in vitro studies indicate that the mTOR signaling pathway is involved in the regulation of FGF23 by energy intake.
The present study confirms previous reports describing that high calorie intake results in increased FGF23 concentrations15,16. A problem when linking high caloric intake with FGF23 is that energy-dense diets have a high fat content and there are unavoidable collateral effects of high fat diets on the kidneys and on systemic inflammation that may result in indirect increases of FGF23. High fat diet is known to produce kidney damage18 and acute kidney injury is sufficient to increase FGF23 even in the absence of hyperphosphatemia23. High fat diets also promote inflammation17 which not only can contribute to kidney damage but may also have independent effects on FGF2324. Two recent studies have identified a link between elevations in TNFα secondary to feeding high fat and increases in FGF2316,25.
To further clarify the role of energy intake on FGF23 concentrations we studied energy deprived rats that were fed a diet with a very low caloric content. Energy deprived rats had reduced FGF23 concentrations when compared with energy repleted animals. To our knowledge, FGF23 has not been previously studied in animals subjected to energy deprivation. The reduction in FGF23 in calorie deprived rats reinforces the contention that energy intake directly regulates FGF23. Moreover, when data from all the animals used in the study were pooled, a highly significant correlation between energy intake and FGF23 was observed. Since elevated FGF23 concentrations are associated to cardiovascular morbidity and mortality3–5 reducing energy intake may have advantages on cardiovascular health that could be mediated by a decrease in FGF23.
The modulation of FGF23 concentrations by energy intake was independent of changes in intestinal P absorption and in plasma P concentrations. It is important to emphasize the quantification of absorbed P, instead of the P that was eaten because, even though efforts were made to avoid different P load, dietary modifications change feeding behaviour in rodents and thus it is difficult to adjust with precision the amount of ingested P. Moreover, it is important to evaluate absorbed P because the composition of the diet (e.g. fat content) may modify intestinal absorption of P26. The possibility that P intake may have influenced FGF23 by a mechanism independent of intestinal P absorption is unlikely. At any rate, if this were the case, the effect of caloric intake on FGF23 would had been underestimated since the rats that ate more P were in the LC group which also had the lower FGF23 concentrations. In conclusion, rats with equivalent P load, similar plasma P concentrations but with very different energy intake showed changes in FGF23 levels that correlated with energy intake.
In addition to P, FGF23 is hormonally regulated by calcitriol7. In the rats under study plasma calcitriol changed in opposite direction to plasma FGF23 and a strong inverse correlation between both parameters was identified. The regulation of calcitriol and FGF23 is bidirectional -calcitriol stimulates FGF23 production7 while FGF23 inhibits calcitriol synthesis2. Since the correlation was inverse, it seems that the changes in FGF23 were driving calcitriol production. Therefore, energy intake can modulate calcitriol production through changes in FGF23. Given the important repercussions of vitamin D on cardiovascular27 and bone28 health the indirect regulation of calcitriol, through changes in FGF23, associated to energy intake may be highly relevant.
In vitro studies support the effect of energy availability on FGF23 expression by bone cells. UMR 106 cells cultured in HG medium consistently expressed more mRNA FGF23 than UMR 106 cells cultured in LG medium. It is important to note that even though energy availability was limited in the LG medium, the cells cultured in LG grew almost at the same rate than the cells cultured in HG medium. In fact the time to reach confluence was not different for cells cultured in HG, 120.0 ± 0.5 hours, and in LG, 127.6 ± 4.6 hours. Thus, the cells cultured in LG were able to maintain their physiologic processes but reduced FGF23 expression. This contention was further supported by the study of osteogenic genes which were not affected by the glucose content of the culture medium.
Since HG medium has higher osmolality than LG medium, and data in the literature support the influence of osmolality on bone cell biology29, experiments were conducted adding mannitol to LG medium to reach the same osmolality of the HG medium. The cells cultured in LG + Man also expressed lower levels of mRNA FGF23 than the cells cultured in HG, thus ruling out any interfering effect related to changes in osmolality.
It is interesting to note that blood glucose was not altered in the in vivo studies, in fact plasma glucose levels were slightly lower in the rats fed HC diet. Thus, glucose, per se, is not the likely triggering factor in the response to nutrient availability. The contention that what drives the regulation of FGF23 seems to be sustained energy availability rather than glucose concentration is further supported by in vitro experiments in which short time changes in glucose concentration in the medium did not modify FGF23 expression.
As expected, UMR 106 cells incubated in HG increased mRNA FGF23 in response to elevated P concentrations. However, when the cells were incubated in LG they did not increase FGF23 expression even in the presence of very high P concentrations. These data are in line with previous studies that have reported that P restriction does not prevent the increase in FGF23 associated to high caloric intake16 and, in conjunction with the in vivo data reported in the present study, would argue for a preferential regulation of FGF23 by nutrient/energy availability rather than by P.
To provide a mechanistic explanation to the regulation of FGF23 by energy availability, the mTOR signaling pathway was explored, because inhibition of mTOR has been shown to mimic calorie restriction20. Two mTOR complexes, mTORC1 and mTORC2, are known, but only mTORC1 is rapamycin sensitive. mTORC1, which is suppressed by energy deprivation (low ATP-to-AMP ratio), is a downstream target of AMPK30. In an elegant study, Glosse et al. demonstrated that AMPK activation decreases FGF23 and that the effect of AMPK on FGF23 was mediated, at least in part, by downregulation of the calcium channel Orai1 involving store-operated calcium entry (SOCE)14. Both AMPK and rapamycin have an inhibitory effect on mTOR, but the fact that rapamycin by itself is able to decrease FGF23 production focus the signaling of energy-sensing that regulates FGF23 on mTOR. The involvement of the mTOR pathway was corroborated by the response to a different mTOR inhibitor, everolimus. It is interesting to note that a tendency to decreased FGF23 has also been reported in mice treated with rapamycin31 lending further support to the involvement of the mTOR pathway in FGF23 production.
Like AMPK, mTORC1 signaling has also been shown to enhance SOCE and mTORC1 inhibition by rapamycin has been reported to suppress STIM1, a protein necessary for SOCE activation32. Our data also confirm a decrease in STIM1 expression in UMR 106 cells incubated with rapamycin and everolimus. Thus, both AMPK, through orai1 inhibition, and mTORC1, through STIM1 downregulation, can lead to SOCE activation that results in a decrease in FGF23 production.
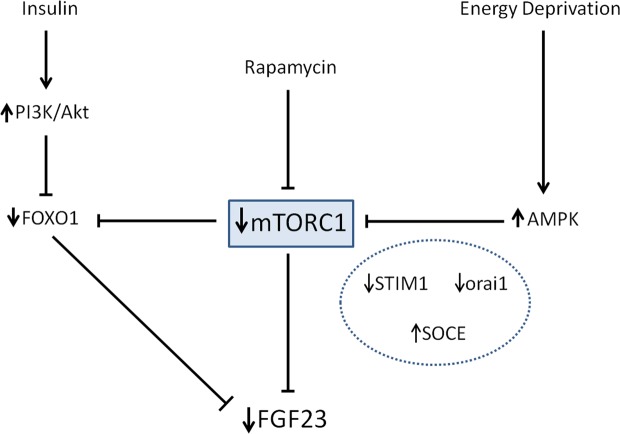
Bar et al. have reported that insulin suppresses the production of FGF23 by inhibition of FOXO1 transcription factor13, and these results have been reproduced in our laboratory (data not shown). Since insulin is known to inhibit AMPK activity33 the data from Bar et al. and Glosse et al. could be considered contradictory. However, our results showing involvement of the mTOR pathway may help to harmonize the information provided by these two studies. Both insulin signaling, through the phosphatidylinositol 3-kinase (PI3K/Akt) pathway, and mTOR inhibition by rapamycin (or by energy restriction) are able to inactivate FOXO113,34. Thus, as shown in Fig. 9, we propose that mTOR is a central molecule in the regulation of FGF23 by energy availability since it integrates two signaling pathways which are dependent on insulin and energy availability, respectively.
Figure 9.
Proposed model integrating the actions of energy deprivation, rapamycin and insulin on FGF23 production. Energy deprivation stimulates AMPK and, like rapamycin, inhibits mTORC1. The increase in AMPK and the decrease in mTORC1 reduce FGF23 through an increase in SOCE mediated by down regulation of STIM1 and orai1. Both inhibition of mTORC1 and insulin signaling through PI3K/Akt inhibit FOXO1 and this also decreases FGF23 production.
In conclusion, this study shows a direct regulation of FGF23 production, both in vivo and in vitro, by energy availability and demonstrates that the mTOR signaling pathway plays a central role in this regulatory system.
Material and Methods
Ethics
All experimental protocols were reviewed and approved by the Ethics Committee for Animal Research of the University of Cordoba and by Junta de Andalucia (Spain) (Ethical Code Number 30/10/2017/148, date 08/11/2017). All protocols were carried out in accordance with the approved guidelines. They followed the guiding principle laid down by the Higher Council of Scientific Research of Spain following the normal procedures directing animal welfare and adhered to the recommendations included in the Guide for Care and Use of Laboratory Animals (US Department of Health and Human Services, NIH) and European laws (Art. 41.1, Real Decreto 53/2013, 01/02 Dec 2012/707/UE) and regulations on protection of animals, under the advice of specialized personnel.
In vivo experiments
Animals and diets
Female Wistar rats, aged 2 months at the beginning of the studies, were used in the experiments. Rats were provided by the Animal Housing Facilities of the University of Cordoba (Cordoba, Spain) and were housed with a 12 h/12 h light/dark cycle. Appropriate measures were taken to ensure animal welfare and to address the basic behavioral and physiological needs of rats.
Three diets were used in the experiments: a) diet with normal caloric (NC) content, Metabolizable Energy = 3518 kcal/kg, (Altromin C 1090-10, AltrominSpezialfutter GmbH, Germany); b) diet with high caloric (HC) content, Metabolizable Energy = 5241 kcal/kg (Altromin C 1090-60, AltrominSpezialfutter GmbH, Germany); and c) diet with low caloric (LC) content, Metabolizable Energy = 1314 kcal/kg (Altromin C 1012, AltrominSpezialfutter GmbH, Germany). All diets contained normal amounts of calcium (Ca), P and vitamin D: 0.6% of Ca, 0.6% of P and 500 IU/g of vitamin D.
Experimental design
Rats were allotted to 3 groups (n = 9 per group) that received the study diets for 30 days. Rats in Group 1 (Control) were fed NC diet ad libitum. Rats in Group 2 received HC diet ad libitum. Rats in Group 3 were fed LC diet. To prevent overeating, the amount of food made available to the rats on the LC diet was adjusted to achieve a caloric intake that was reduced by 35% when compared with the NC group.
During the last week of the study the rats were housed in metabolic cages, allowing daily control of food and water intake and collection of feces. At the end of the experiments, rats were sacrificed by exsanguination under general anesthesia (inhaled isoflurane).
Blood chemistries
Blood was collected from the abdominal aorta at the time of sacrifice. Blood glucose was measured immediately after collection with a blood glucose meter (Bayer Consumer Care AG, Basel, Switzerland). Afterwards, plasma was separated by centrifugation and stored at −20 °C until assayed. Plasma concentrations of P were measured by spectrophotometry (BioSystems SA, Barcelona, Spain). ELISA tests were used to quantify intact plasma FGF23 (Kainos Laboratories, Tokyo, Japan). Radioimmunoassay (Immunodiagnostic Systems Ltd, Boldon, UK) was used in plasma samples to determine 1,25-dihydroxyvitamin D (calcitriol).
Fecal chemistries
Fecal samples were dried, ashed and demineralized with 0.6 mmol/l HNO3 solution. Fecal P was measured by inductively coupled plasma mass spectrophotometry (ICP-MS, Perkin Elmer Elan DRC-e, Walthan, Massachusetts, USA). Net intestinal absorption of P was calculated as follows:
In vitro experiments
Cell culture
Rat osteosarcoma cell line UMR 106 (ATCC, Manassas, VA, USA) was used for all in vitro experiments. UMR 106 cells were cultured in Dulbecco’s modified Eagle’s medium (DMEM) (Sigma-Aldrich, St. Louis, MO, USA) supplemented with 10% fetal bovine serum (FBS) (Biowest, Riverside, MO, USA), 100 mg/l streptomycin (Normon, Madrid, Spain), 100 IU/ml penicillin (ERN, Barcelona, Spain), 0.29 mg/l fungizone (Teva, Madrid, Spain), 2 mM ultra-glutamine (Lonza, Walkersville, MD, USA) and 1 mM sodium pyruvate (Lonza, Walkersville, MD, USA) at 5% CO2, 37 °C temperature and water saturated atmosphere. Cells were seeded in 6 wells plates with 10,000 cells/cm2 and maintained in DMEM up to 90% confluence. Once confluence was reached, as UMR 106 cells do not easily express FGF23, FGF23 production was stimulated by adding calcitriol (10−8 M) (Kern pharma, Barcelona, Spain) for twenty-four hours as previously reported13. Culture medium was changed every other day. Cells in passage six were used for all experiments. To study the effect of energy availability, cells were incubated until they reached confluence in either DMEM with high glucose (HG, 4.5 g/l), DMEM with intermediate glucose (2 g/l) or DMEM with low glucose (LG, 1 g/l). Further studies were carried out in which cells that had grown in HG medium were exposed to LG medium for shorter periods of time. Additional experiments were performed to assess the influence of osmolality. In these studies, mannitol (Man, 19.42 mOsmol/l) (Fresenius Kabi España, Barcelona, Spain) was added to the LG medium to achieve the same osmolality the HG medium. To evaluate the effect of P, both HG and LG groups were incubated for 6 days with standard DMEM (NP, 1 mM) or with DMEM with high P concentration (HP, 4 mM) in which PO4HNa2/PO4H2Na (Sigma-Aldrich, St. Louis, MO, USA) was added in a ratio 1/2. To explore the involvement of the mTOR signaling pathway 5 nM and 10 nM rapamycin (Rap) (Calbiochem, San Diego, CA, USA) was added to the HG medium and Rap was maintained in the medium during the 6 days that lasted the experiment. Since Rap needs to be dissolved in dimethyl sulfoxide (DMSO), an additional control group was included. In this group (HG + DMSO) the HG culture medium contained the same amount of DMSO, 0.009%, (Sigma-Aldrich, St. Louis, MO, USA) used to dissolve Rap. Further studies were carried out with cells grown in HG medium that were exposed to rapamycin for shorter periods of time. Additional experiments were performed adding 10 nM everolimus (Sigma-Aldrich, St. Louis, MO, USA) to cells cultured in HG medium.
RNA extraction and real time reverse transcription-polymerase chain reaction (RT-PCR)
Total RNA was isolated using TRIzol reagent protocol (Invitrogen) and a treatment with DNase I amplification Grade (Sigma-Aldrich, St. Louis, MO, USA) was done according to the manufacturer’s instruction. Quantification was performed by spectrophotometry (ND-1000, Nanodrop Technologies, Wilmington, DE, USA). The sequence of primers used for RT-PCR is shown in Table 1. Quantification was done using the QuantiTect SYBR Green RT-PCR kit (Qiagen GmbH, Hilden, Germany) for 50 µg of RNA and 1 µl of primer. The mRNA expression was analyzed in the Light Cycler thermal cycler system (Roche Diagnostics, Indianapolis, IN, USA) and the relative expression of the target genes was determined using the 2−ΔΔCt method.
Table 1.
Sequences of the primers used for real-time RT-PCR.
| Gene | Forward primer (5′-3′) | Reverse primer (5′-3′) |
|---|---|---|
| FGF23 | TGGCCATGTAGACGGAACAC | GGCCCCTATTATCACTACGGAG |
| RunX2 | CGGGAATGATGAGAACTACTC | GCGGTCAGAGAACAAACTAGGT |
| Osterix | GTACGGCAAGGCTTCGCATCTGA | TCAAGTGGTCGCTTCGGGTAAAG |
| STIM1 | CAGTACTACAACATCAAGAAGC | TTTTTATTTTCTCAGCCCCC |
| Tbp | ACTCCTGCCACACCAGCC | GGTCAAGTTTACAGCCAAGATTCA |
All primers were purchased from Eurofins Genomics Germany GmbH, Ebersberg, Germany except STIM 1 which was purchased from Sigma-Aldrich, St. Louis, MO, USA.
FGF23, fibroblast growth factor 23; RunX2, Runt-related transcription factor 2; STIM1, Stromal interaction molecule 1; Tbp, TATA sequence binding protein.
Statistics
Values are expressed as the mean ± standard error (SE). The difference between means for two different groups was determined by t-tests; the difference between means for three or more groups was assessed by ANOVA. Fisher LSD test was used as a post-hoc procedure. A correlation study was carried out using the Pearson test. A p < 0.05 was considered significant. Statistical analysis was performed using GraphPad Prism version 6.01 software.
Supplementary information
Acknowledgements
The work reported here was supported by a Spanish Government Grant from the Instituto de Salud Carlos III (PI17/00169) with co-financing from European Funds.
Author contributions
E.A.-T. conceived and designed the study; A.V., R.R., C.P., I.L. and A.I.R. performed experiments; A.V., R.R., J.R.M.-C., M.R. and A.I.R. analyzed data; A.V. and E.A.-T. drafted manuscript; A.V., R.R., C.P., I.L., J.R.M.-C., M.R., E.A.-T. and A.I.R. edited and revised manuscript; A.V., R.R., C.P., I.L., J.R.M.-C., M.R., E.A.-T. and A.I.R. approved final version of manuscript.
Data availability
The datasets generated during and/or analysed during the current study are available from the corresponding author on reasonable request.
Competing interests
The authors declare no competing interests.
Footnotes
Publisher’s note Springer Nature remains neutral with regard to jurisdictional claims in published maps and institutional affiliations.
These authors contributed equally: Escolastico Aguilera-Tejero and Ana I. Raya.
Supplementary information
is available for this paper at 10.1038/s41598-020-58663-7.
References
- 1.Vervloet M. Renal and extrarenal effects of fibroblast growth factor 23. Nat. Rev. Nephrol. 2019;15:109–120. doi: 10.1038/s41581-018-0087-2. [DOI] [PubMed] [Google Scholar]
- 2.Shimada T, et al. FGF-23 is a potent regulator of vitamin D metabolism and phosphate homeostasis. J. Bone. Miner. Res. 2004;19:429–435. doi: 10.1359/JBMR.0301264. [DOI] [PubMed] [Google Scholar]
- 3.Scialla JJ, et al. Fibroblast growth factor-23 and cardiovascular events in CKD. J. Am. Soc. Nephrol. 2014;25:349–360. doi: 10.1681/ASN.2013050465. [DOI] [PMC free article] [PubMed] [Google Scholar]
- 4.Kestenbaum B, et al. Fibroblast Growth Factor-23 and Cardiovascular Disease in the General Population: the Multi-Ethnic Study of Atherosclerosis. Circ. Hear. Fail. 2014;7:409–417. doi: 10.1161/CIRCHEARTFAILURE.113.000952. [DOI] [PMC free article] [PubMed] [Google Scholar]
- 5.Panwar B, et al. Fibroblast growth factor 23 and risk of incident stroke in community-living adults. Stroke. 2015;46:322–328. doi: 10.1161/STROKEAHA.114.007489. [DOI] [PMC free article] [PubMed] [Google Scholar]
- 6.Ferrari SL, Bonjour JP, Rizzoli R. Fibroblast growth factor-23 relationship to dietary phosphate and renal phosphate handling in healthy young men. J. Clin. Endocrinol. Metab. 2005;90:1519–1524. doi: 10.1210/jc.2004-1039. [DOI] [PubMed] [Google Scholar]
- 7.Masuyama R, et al. Vitamin D receptor in chondrocytes promotes osteoclastogenesis and regulates FGF23 production in osteoblasts. J. Clin. Invest. 2006;116:3150–3159. doi: 10.1172/JCI29463. [DOI] [PMC free article] [PubMed] [Google Scholar]
- 8.López I, et al. Direct and indirect effects of parathyroid hormone on circulating levels of fibroblast growth factor 23 in vivo. Kidney Int. 2011;80:475–482. doi: 10.1038/ki.2011.107. [DOI] [PubMed] [Google Scholar]
- 9.David V, et al. Inflammation and functional iron deficiency regulate fibroblast growth factor 23 production. Kidney Int. 2016;89:135–146. doi: 10.1038/ki.2015.290. [DOI] [PMC free article] [PubMed] [Google Scholar]
- 10.Bozentowicz-Wikarek M, et al. Plasma fibroblast growth factor 23 concentration and iron status. Does the relationship exist in the elderly population? Clin. Biochem. 2015;48:431–436. doi: 10.1016/j.clinbiochem.2014.12.027. [DOI] [PubMed] [Google Scholar]
- 11.Marsell R, et al. Relation between fibroblast growth factor-23, body weight and bone mineral density in elderly men. Osteoporos. Int. 2009;20:1167–1173. doi: 10.1007/s00198-008-0780-2. [DOI] [PubMed] [Google Scholar]
- 12.di Giuseppe R, et al. Potential predictors of plasma fibroblast growth factor 23 concentrations: Cross-sectional analysis in the epic-Germany study. PLoS One. 2015;10:e0133580. doi: 10.1371/journal.pone.0133580. [DOI] [PMC free article] [PubMed] [Google Scholar]
- 13.Bär L, et al. Insulin suppresses the production of fibroblast growth factor 23 (FGF23) Proc. Natl. Acad. Sci. USA. 2018;115:5804–5809. doi: 10.1073/pnas.1800160115. [DOI] [PMC free article] [PubMed] [Google Scholar]
- 14.Glosse P, et al. AMP-activated kinase is a regulator of fibroblast growth factor 23 production. Kidney Int. 2018;94:491–501. doi: 10.1016/j.kint.2018.03.006. [DOI] [PubMed] [Google Scholar]
- 15.Raya AI, et al. Energy-dense diets increase FGF23, lead to phosphorus retention and promote vascular calcifications in rats. Sci. Rep. 2016;6:36881. doi: 10.1038/srep36881. [DOI] [PMC free article] [PubMed] [Google Scholar]
- 16.Rios R, et al. Phosphorus restriction does not prevent the increase in fibroblast growth factor 23 elicited by high fat diet. PLoS One. 2018;13:e0198481. doi: 10.1371/journal.pone.0198481. [DOI] [PMC free article] [PubMed] [Google Scholar]
- 17.Poret JM, et al. High fat diet consumption differentially affects adipose tissue inflammation and adipocyte size in obesity-prone and obesity-resistant rats. Int. J. Obes. (London). 2018;42:535–541. doi: 10.1038/ijo.2017.280. [DOI] [PMC free article] [PubMed] [Google Scholar]
- 18.Wickman C, Kramer H. Obesity and Kidney Disease: Potential Mechanisms. Semin. Nephrol. 2013;33:14–22. doi: 10.1016/j.semnephrol.2012.12.006. [DOI] [PubMed] [Google Scholar]
- 19.Kanbay M, et al. Novel faces of fibroblast growth factor 23 (FGF23): iron deficiency, inflammation, insulin resistance, left ventricular hypertrophy, proteinuria and acute kidney injury. Calcif. Tissue. Int. 2017;100:217–228. doi: 10.1007/s00223-016-0206-7. [DOI] [PubMed] [Google Scholar]
- 20.de Cavanagh EMV, Inserra F, Ferder L. Angiotensin II blockade: how its molecular targets may signal to mitochondria and slow aging. Coincidences with calorie restriction and mTOR inhibition. Am. J. Physiol. Heart Circ. Physiol. 2015;309:H15–H44. doi: 10.1152/ajpheart.00459.2014. [DOI] [PubMed] [Google Scholar]
- 21.Laplante M, Sabatini DM. mTOR signaling in growth control and disease. Cell. 2012;149:274–293. doi: 10.1016/j.cell.2012.03.017. [DOI] [PMC free article] [PubMed] [Google Scholar]
- 22.Tokunaga C, Yoshino K, Yonezawa K. mTOR integrates amino acid- and energy-sensing pathways. Biochem. Biophys. Res. Commun. 2004;313:443–446. doi: 10.1016/j.bbrc.2003.07.019. [DOI] [PubMed] [Google Scholar]
- 23.Christov M, et al. Plasma FGF23 levels increase rapidly after acute kidney injury. Kidney Int. 2013;84:776–785. doi: 10.1038/ki.2013.150. [DOI] [PMC free article] [PubMed] [Google Scholar]
- 24.Hanks LJ, Casazza K, Judd SE, Jenny NS, Gutiérrez OM. Associations of fibroblast growth factor-23 with markers of inflammation, insulin resistance and obesity in adults. PLoS One. 2015;10:e0122885. doi: 10.1371/journal.pone.0122885. [DOI] [PMC free article] [PubMed] [Google Scholar]
- 25.Glosse P, et al. A high-fat diet stimulates fibroblast growth factor 23 formation in mice through TNFα upregulation. Nutr. Diabetes. 2018;8:36. doi: 10.1038/s41387-018-0037-x. [DOI] [PMC free article] [PubMed] [Google Scholar]
- 26.Frommelt L, et al. Effects of low-carbohydrate, high-fat diets on apparent digestibility of minerals and trace elements in rats. Nutrition. 2014;30:869–875. doi: 10.1016/j.nut.2013.11.017. [DOI] [PubMed] [Google Scholar]
- 27.Kaur Gurpreet, Singh Jatinder, Kumar Juhi. Vitamin D and cardiovascular disease in chronic kidney disease. Pediatric Nephrology. 2018;34(12):2509–2522. doi: 10.1007/s00467-018-4088-y. [DOI] [PMC free article] [PubMed] [Google Scholar]
- 28.van Schoor NM, et al. Vitamin D deficiency as a risk factor for osteoporotic fractures. Bone. 2008;42:260–266. doi: 10.1016/j.bone.2007.11.002. [DOI] [PubMed] [Google Scholar]
- 29.Botolin S, McCabe LR. Chronic hyperglycemia modulates osteoblast gene expression through osmotic and non-osmotic pathways. J. Cell Biochem. 2006;99:411–424. doi: 10.1002/jcb.20842. [DOI] [PubMed] [Google Scholar]
- 30.Xu J, Ji J, Yan XH. Cross-Talk between AMPK and mTOR in regulating energy balance. Crit. Rev. Food Sci. Nutr. 2012;52:373–381. doi: 10.1080/10408398.2010.500245. [DOI] [PubMed] [Google Scholar]
- 31.Kempe DS, et al. Rapamycin-induced phosphaturia. Nephrol. Dial. Transplant. 2010;25:2938–2944. doi: 10.1093/ndt/gfq172. [DOI] [PubMed] [Google Scholar]
- 32.Peng H, et al. mTORC1 enhancement of STIM1-mediated store-operated Ca(2+) entry constrains tuberous sclerosis complex-related tumor development. Oncogene. 2013;32:4702–4711. doi: 10.1038/onc.2012.481. [DOI] [PMC free article] [PubMed] [Google Scholar]
- 33.Valentine RJ, Coughlan KA, Ruderman NB, Saha AK. Insulin inhibits AMPK activity and phosphorylates AMPK Ser485/491 through Akt in hepatocytes, myotubes and incubated rat skeletal muscle. Arch. Biochem. Biophys. 2014;562:62–69. doi: 10.1016/j.abb.2014.08.013. [DOI] [PMC free article] [PubMed] [Google Scholar]
- 34.Abdelnour-Berchtold E, et al. Rapamycin-mediated FOXO1 inactivation reduces the anticancer efficacy of rapamycin. Anticancer Res. 2010;30:799–804. [PubMed] [Google Scholar]
Associated Data
This section collects any data citations, data availability statements, or supplementary materials included in this article.
Supplementary Materials
Data Availability Statement
The datasets generated during and/or analysed during the current study are available from the corresponding author on reasonable request.


