Abstract
The spectroscopic and photophysical properties of two donor–acceptor derivatives of 1,4-diphenylbuta-1,3-diene and 1,6-diphenylhexa-1,3,5-diene are described. Both compound posses a dimethylamino and a boronic acid groups as electron-donor and electron-withdrawing groups, respectively. Solvent polarity effects on the steady-state and fluorescence intensity decay are presented and show the formation of an excited-state charge-transfer (CT) state for both compounds. The formation of the anionic form of the boronic acid group at high pH induces a blue shift and an increase of the intensity in the emission spectra for both compounds. These spectral changes are interpreted as the lost of the electron-withdrawing property of the anionic form of the boronic acid group. The observed pKa of both compounds is around 8.8 and decrease to ~6 and ~7 in presence of fructose and glucose, respectively. Both compounds display a decrease of the mean lifetime at higher pH. Effects of the sugars on the fluorescence spectra and fluorescence lifetimes are also presented. For both compounds, a blue shift and an increase of the intensity are observed. These spectral changes lead to a wavelength-ratiometric method for the sugar recognition and analysis. Titration curves against fructose, galactose and glucose and dissociation constants are presented. Both compounds show a higher affinity for fructose. The affinity decreases for galactose and for glucose, respectively. Sugar effects on the fluorescence intensity decay are also presented. Both compounds display a decrease of the mean lifetime after addition of sugar.
Keywords: Fluorescence, Wavelength-ratiometric probes, Charge-transfer, Boronic acid, Dissociation constants, Saccharides, Glucose
1. Introduction
The development of an implantable glucose sensor has been a long-standing goal [1]. Up to now, a wide variety of methods for glucose analysis have been described in the literature, including electrochemical sensors [2–4], near-infrared spectroscopy [5–7], optical rotation [8,9] and fluorescence spectroscopy [10–14]. Despite some promising results, these methods show limitation in their applications and the majority of them have not been successfully developed into a functional and useful analytical device for glucose. At present, the most reliable method to measure blood glucose is by finger stick and subsequent glucose measurement, typically by glucose oxidase [15]. Non-invasive methods for glucose detection and analysis would be an important development for diabetic health care. Continuous control of blood glucose level could reduce the health effects of diabetic including heart diseases, blindness and cancer [16,17]. An easy and painless method for glucose analysis would facilitate and increase the quality of life of diabetes of all ages.
For several decades, fluorescence spectroscopy has been widely use for the detection and analysis of different analytes [18–20]. Wavelength-ratiometric [18,19], fluorescence lifetime-based sensing [21,22] and polarization assays [23] are some techniques available for the detection and analysis of analytes by fluorescence spectroscopy. Fluorescence techniques for glucose recognition have been used most of the time with enzymes and proteins [12–14,24]. Despite some promising results, enzymes and proteins show some stability problems against organic solvents and heat. In contrast, synthetic organic probes show high stability and flexibility due to the versatility of the organic synthesis. Modification of the probe structure could lead to a modification of the affinity for the analyte, of the wavelength of emission of the probes and of the immobilization of the probes on a support for the building of a sensor.
The boronic acid group has been known for 40 years for his ability to form complexes with polyols [25]. This ability led Yoon and Czarnik to build a fluorescence probe for sugar based on the boronic acid group [26]. Shinkai and coworkers have developed and studied some molecular structures and fluorescence probes involving the boronic acid group [27–32]. They have developed fluorescence probes involving different mechanisms to induce spectral changes. Molecular rigidification [33], photoinduced electron transfer (PET) [32] and excimer formation [34] are some examples. Despite these interesting studies, most of the fluorescence probes developed up to now show emission in the ultraviolet region and/or involved a mechanism limited to few fluorophores.
Recently, we reported a new mechanism involving the boronic acid group as the basis of fluorescence probes for sugar recognition [35]. We found that excited-state charge-transfer (CT) can be observed when the boronic acid group and an electron-donor group are present on the same fluorophore. In this case, the boronic acid group [–B(OH)2] acts as an electron-withdrawing group. Following the interaction with sugar, the pKa of the boronic acid decreases and between pH 7 and 8, the boronic acid group is present in its anionic form [–B(OH)(sugar)]− (Scheme 1). The anionic form of the boronic acid group is no longer an electron-withdrawing group and spectral changes are observed due to reduced charge-transfer. These spectral changes were used for wavelength-ratiometric method for the detection and analysis of sugars [35]. These results were obtained using substituted stilbenes in positions 4 and 4′ as molecular model. We argue in this study that this CT mechanism can be applicable to a wide variety of fluorophores and especially to long wavelength emission fluorophores. The aim of this study is to study the effect of the wavelength of absorption and emission of the fluorophore on the efficiency on the CT mechanism and on the spectral changes of fluorophores combining the boronic acid group and an electron-donor group.
Scheme 1.
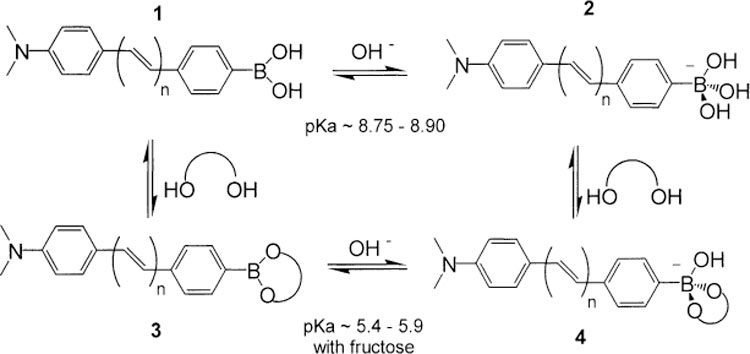
Equilibrium and conformation of the different forms of the boronic acid group with and without sugar.
We present in this study two new fluorescence probes based on the CT mechanism involving the boronic acid group. These probes are two derivatives of diphenylbutadiene and diphenylhexadiene substituted in position para of the phenyl groups with the dimethylamino group as electron-donor group and the boronic acid group as the electron-withdrawing group. Molecular structures of the two probes (1 and 2) are displayed in Fig. 1. Both compounds show longer wavelength of emission than the previous stilbenes studied (DSTBA in Fig. 1). Solvent polarity effect shows the presence of an CT for both compounds. In both cases, the formation of the anionic form of the boronic acid group, at high pH or induced by the complexation with sugar, induces a blue shift and an increase of the intensity in the emission spectra. Frequency-domain intensity decays of the emission are also presented. The results show that the spectral changes are also associated with modest changes in the fluorescence lifetimes.
Fig. 1.
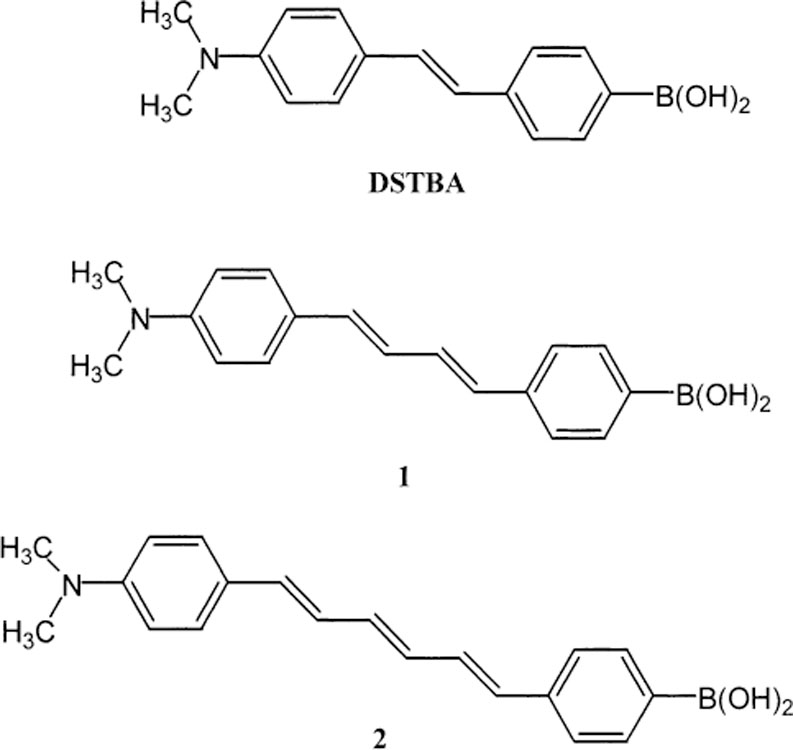
Molecular structure of the two diphenylpolyenes investigated 1 and 2 and the stilbene analogue (DSTBA).
2. Materials and methods
2.1. Materials
d-Glucose, d-galactose and d-fructose were purchased from Sigma and used as received. All solvents used were HPLC grade and purchased from Aldrich.
2.1.1. 2,2-Dimethylpropane-1,3-diyl(p-tolyl)boronate (3)
p-Tolyllboronic acid (9.0 g, 64.2 mmol) and 2,2-dimethyl-1,3-propanediol (8.0 g, 77.0 mmol) were refluxed in toluene (300 ml) with azeotropic removal of water (Dean-Stark) for 3 h. The solvent was removed by rota-vap and the solid was purified by silica gel chromatography using petroleum ether:dichloromethane 50:50 given 13.2 g (~100%) of 3 as a white powder: 1H NMR (CDCl3, 300 MHz) δ 1.02 (6H, s), 2.37 (3H, s), 3.77 (4H, s), 7.18 (2H, d), 7.69 (2H, d).
2.1.2. 2,2-Dimethylpropane-1,3-diyl[p-(bromomethyl)-phenyl]boronate (4)
Compound 3 (3.2 g, 15.7 mmol), recrystallized N-bromosuccinimide (3.1 g, 17.4 mmol) and 2,2′-azobis(2-methylpropionitrile) (50 mg, 0.3 mmol) in carbon tetrachloride (100 ml) were refluxed and irradiated with a 100 W lamp for 2 h. The succinimide was removed by filtration and the solvent removed by rota-vap. The white solid was then chromatographed on silica gel with dichloromethane as solvent to give 4.95 g (~100%) of 4 as a white solid: 1H NMR (CDCl3, 300 MHz) δ 1.02 (6H, s), 3.77 (4H, s), 4.50 (2H, s), 7.38 (2H, d), 7.78 (2H, d).
2.1.3. 2,2-Dimethylpropane-1,3-diyl(p-boronotolyl) triphenylphosphonium bromide (5)
Compound 4 (4 g, 14.1 mmol) and triphenylphospine (5.2 g, 19.8 mmol) in toluene (75 ml) were refluxed for 12 h in a 500 ml flask. The mixture was cooled on ice and the product was collected by filtration and dry to give 3.28 g (42.6%) of 5 as a white powder: 1H (CDCl3, 300 MHz) δ 0.88 (6H, s), 3.34 (4H, s), 5.05 (2H, s), 7.00 (2H, d), 7.7 (15H, m), 7.93 (2H, d).
2.1.4. 1-(p-Dimethylaminophenyl)-4-(p-boronophenyl)-buta-1,3-diene (1)
Compound 5 (250 mg, 0.46 mmol) and 4-(dimethylamino) cinnamaldehyde (88 mg, 0.50 mmol) in dichloromethane (2 ml) were vigorously stirred with a magnetic bar in a 100 ml flask. Then 2 ml of NaOH/water 50% was added and the vigorously stirring was continued for 15 min. About 10 ml of dichloromethane and 50 ml of water were added and the pH was reduced to 6–7 by addition of conc. HCl. The mixture was then extracted with CH2Cl2, the organic phase was dried over magnesium sulfate and the solvent removed by rota-vap. The crude product was chromatographed on silica gel using toluene:dichloromethane 75:25 (v/v) as solvent, the product comes out at the third band. Further purification by recrystallization from methanol was used to obtained a pure yellow solid: 1H NMR (CDCl3, 300 MHz) δ 0.82 (6H, s), 2.99 (6H, s), 3.78 (4H, s) 6.6–7.8 (12H, m). The protecting group can be removed by mixing the solid obtained in a mixture of THF–water for ~15 min and, after evaporation of the solvent, chromatographed on silica gel using methanol as solvent. Spectral characteristics of the protected and unprotected compound are the same for all measurement and then this step can be skipped.
2.1.5. 1-(p-Dimethylaminophenyl)-6-(p-boronophenyl)-hexa-1,3,5-triene (2)
As for 1 excepted that 5 and t,t-5-[4-(dimethylamino) phenyl]-2,4-pentadienal was used. The crude product was chromatographed on silica gel using dichloromethane: acetone 98:2 as solvent. The compound comes out at the second band. Further purification by recrystallization from methanol was use to obtained a pure yellow solid: 1H NMR (CDCl3, 300 MHz): δ 1.03 (6H, s), 2.98 (6H, s), 3.77 (4H, s) 6.3–7.9 (14H, m).
2.2. Instrumentation
Absorption spectra were recorded with a Cary 50 UV–VIS spectrophotometer from Varian. Emission spectra were recorded with a Varian Eclipse spectrofluorometer from Varian. In both case, the measurements were taken at room temperature in a 1-cm quartz cuvette. For all measurements, the absorbance of the solutions were around 0.1.
Titration curves against pH were measured in buffer solution: acetate buffer for pH 4.0–5.5, phosphate buffer for pH 6.0–9.0 and carbonate buffer for pH 10.0–11.0. Titration curves were fitted and pKa (pKa −log Ka) values were obtained using the equation
| (1) |
where Iacid and Ibase are the intensities limit in the acid and basic region, respectively. Titration curves against sugar were fitted and dissociation constant (KD) values were obtained using the equation
| (2) |
where Io and If are the initial (no sugar) and final (plateau) intensity of the titration curves and [C] is the sugar concentration. All solutions in water and buffer also contained 66.6% (1:2 v/v) methanol to avoid any problems due to aggregation.
Frequency-domain (FD) measurements were performed using instrumentation described previously [36]. Excitation was provided by a pulsed frequency-doubled pyridine-2 dye laser at ~370 nm. Emission was observed through a combination of a cut-off filter (420 nm for CH and 460 nm for WM measurements) and a glass blue filter (Corning no. 5091 for CH and Corning no. 9788 for WM measurements) to remove scattered and Raman scattered light and was observed under the magic angle polarization. The measurements were taken in a 1-cm cuvette. The frequency intensity profiles were analyzed by nonlinear least squares in terms of the multiexponential model
| (3) |
where αi are the preexponential factors associated with the decay time τi, with . The mean lifetime is given by
| (4) |
where fi are the fractional steady-state intensities of each lifetime component
| (5) |
3. Results and discussion
3.1. Spectroscopic and photophysical properties
Absorption and emission spectra for 1 and 2 in cyclohexane and in a mixture of water–methanol are displayed in Fig. 2. Spectral parameters are listed in Table 1. In cyclohexane, both compounds show vibronic structure and small Stokes’ shift in their absorption and emission spectra. In water–methanol, absorption spectra remain similar but the emission spectra show large red shifts and lost of the vibronic resolution for both compounds. These spectral changes follow the increase of the polarity of the solvent and are characteristic of the formation of an CT state in polar solvent. As discussed previously for the 4′-dimethylaminostilbene-4-boronic acid (DSTBA) [35], the CT occurs between the electron-donor dimethylamino group and the electron-withdrawing boronic acid group. The dimethylamino/boronic acid pair gives similar spectral characteristics and polarity effects as other donor–acceptor pairs. The absorption and emission maxima of 1 (λabs = 368 nm, λF = 551 nm and ∆ = 9025 cm−1) are similar to the corresponding parameters of the p-dimethylamino-p′-cyanodiphenylbuta-1,3-diene in methanol (λabs = 399 nm, λF = 576 nm and ∆ = 7701 cm−1) [37]. Similarly, the absorption and emission maxima of 2 (λabs = 390 nm, λF = 580 nm and ∆ = 8400 cm−1) are comparable to the corresponding parameters of the p-dimethylamino-p′-nitrodiphenylhexa-1,3,5-triene in acetonitrile (λabs = 452 nm, λF = 625 nm and ∆ = 6156 cm−1) [38]. For comparison, absorption and emission spectra of diphenylbuta-1,3-diene (DPB) and diphenylhexa-1,3,5-triene (DPH) are independent of the polarity of solvent and show maxima of: λabs = 330 nm, λF = 380 nm and ∆ = 4000 cm−1 for DPB [39] and λabs = 352 nm, λF = 452 nm and ∆ = 6290 cm−1 for DPH [40] both in acetonitrile.
Fig. 2.
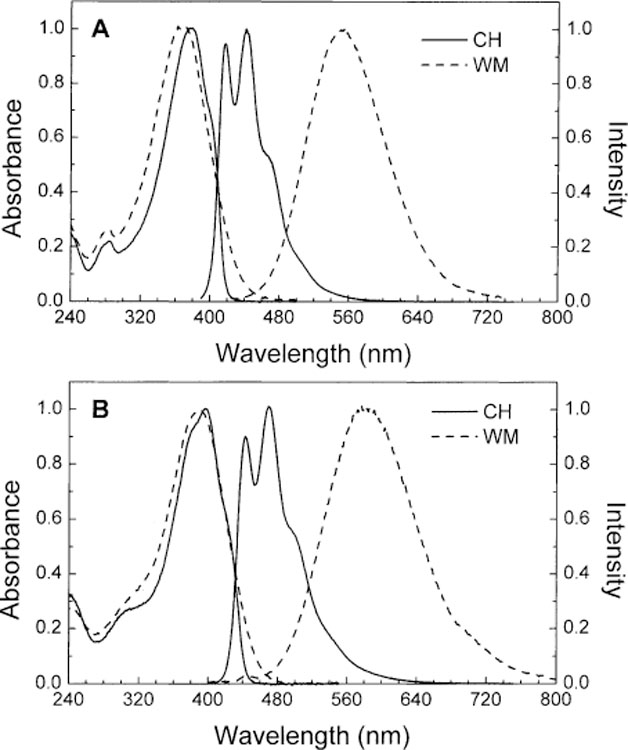
Absorption and emission spectra of 1 (A) and 2 (B) in cyclohexane (CH) and water:methanol (1:2 v/v) (WM) at room temperature.
Table 1.
Spectroscopic and photophysics properties of investigated compounds 1 and 2 a
| Compound | Solvent | λabs (nm) | λF (nm) | ∆ (cm−1) |
|---|---|---|---|---|
| 1 | CH | 377 | 441 | 3850 |
| WM | 368 | 551 | 9025 | |
| 2 | CH | 396 | 470 | 3975 |
| WM | 390 | 580 | 8400 |
CH: cyclohexane; WM: water:methanol (1:2); ∆: Stokes’ shift.
Despite the longer wavelength of absorption and emission of 1 and 2 in comparison with DSTBA (λabs = 346 nm and λF = 485 nm), the Stokes’ shifts remain similar for the three compounds: ∆ = 8300 cm−1 for DSTBA in comparison with 9025 and 8400 cm−1 for 1 and 2, respectively. This observation seems to demonstrate that the CT remains efficient with the increase of the length of the molecule and the decrease of the energy of excitation and emission. This observation also shows that the CT mechanism is applicable to a wide range of fluorophores and remains efficiency for long-wavelength probes.
Fig. 3 shows the frequency-domain decay profile of 1 and 2 in cyclohexane and water–methanol. Intensity decay parameters are listed in Table 2. For both compounds, a decrease of the mean lifetime is observed when the polarity of the solvent increases as seen by the higher frequency response of the phase angle and modulation in Fig. 3. Intensity decays are mono exponential in cyclohexane for 1 and 2 but become double exponential in water–methanol for 2 while remain single exponential for 1. This decrease of the mean lifetimes following the formation of the CT could be explained by a twisted induced charge-transfer (TICT) state which increases the non-radiative decay rate as observe for some DPH derivatives [41]. The fluorescence lifetime of this family of compounds is also known to show large dependence on the viscosity of the solvent [42]. For example, DBP show a mean lifetime of 60 ps in ethanol and 351 ps in cyclohexanol [42].
Fig. 3.
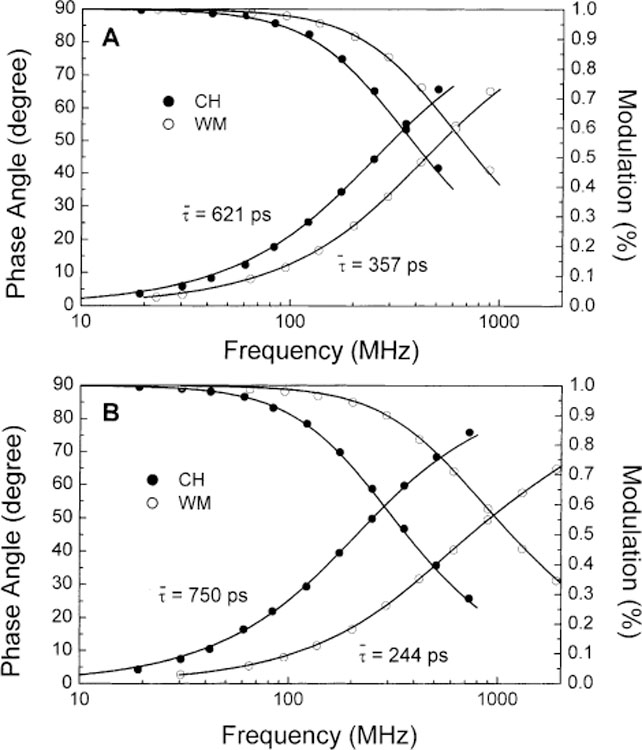
Frequency decay profiles of 1 (A) and 2 (B) in cyclohexane (CH) and water:methanol (1:2 v/v) (WM) at room temperature.
Table 2.
Intensity decay parameters of 1 and 2 in different environmentsa
| Compound | Environment | τ 1 (ps) | τ 2 (ps) | α1 | α2 | f1 | f2 | ||
|---|---|---|---|---|---|---|---|---|---|
| 1 | CH | 621 | – | 1.0 | – | 1.0 | – | 621 | 2.65 |
| WM | 357 | – | 1.0 | – | 1.0 | – | 357 | 1.12 | |
| pH 4.0 | 356 | – | 1.0 | – | 1.0 | – | 356 | 1.57 | |
| pH 11.0 | 201 | – | 1.0 | – | 1.0 | – | 201 | 1.92 | |
| No fructose | 290 | – | 1.0 | – | 1.0 | – | 290 | 1.95 | |
| Fructose | 209 | – | 1.0 | – | 1.0 | – | 209 | 1.62 | |
| 2 | CH | 750 | – | 1.0 | – | 1.0 | – | 750 | 1.73 |
| WH | 97 | 280 | 0.41 | 0.59 | 0.2 | 0.8 | 244 | 0.33 | |
| pH 4.0 | 60 | 265 | 0.4 | 0.6 | 0.13 | 0.87 | 239 | 0.35 | |
| pH 11.0 | 105 | 370 | 0.98 | 0.02 | 0.92 | 0.08 | 126 | 0.28 | |
| No fructose | 134 | 607 | 0.98 | 0.02 | 0.93 | 0.07 | 167 | 1.33 | |
| Fructose | 83 | 171 | 0.63 | 0.37 | 0.45 | 0.55 | 131 | 1.51 |
CH: cyclohexane; WM: water:methanol (1:2); pH 4.0 and 11.0: buffer with 66.6% methanol; with and without fructose: phosphate buffer pH 8.0 with 66.6% methanol. The values of were calculated using uncertainties in the phase and modulation of δp = 0.01 and δm = 0.5, respectively.
3.2. pH effects on the spectroscopic and photophysical properties
Figs. 4A and 5A display the pH dependence of the emission spectra of 1 and 2, respectively. As the pH increase, we observed an increased of the intensity and a blue shift of the emission profile for both compounds. The isobestic point observed in both cases indicates equilibrium between two species as the pH increases. These species are the neutral and the anionic forms of the boronic acid group. As previously described for stilbene derivatives [35], the spectral changes are attributed to the lost of the electron-withdrawing properties of the boronic acid group following the formation of the anionic form. This lost of the electron-withdrawing properties prevent the formation of the CT state and induce the blue shift and the increase of the intensity. The shift induce by the pH observed in the emission spectra of 1 (3360 cm−1) is larger than the one observe for 2 (1975 cm−1). For comparison, the shift observed for the stilbene analogue (DSTBA) was 9769 cm−1 [35]. Also, we observe a smaller increase of the intensity as the molecular length increases. These observations seem to show that as the molecular length increases and/or the emission energy decreases, the lost of the electron-withdrawing property of the boronic acid group lead to smaller spectral changes. This could also lead to the conclusion that the charge-transfer is less important as the molecular length increases.
Fig. 4.
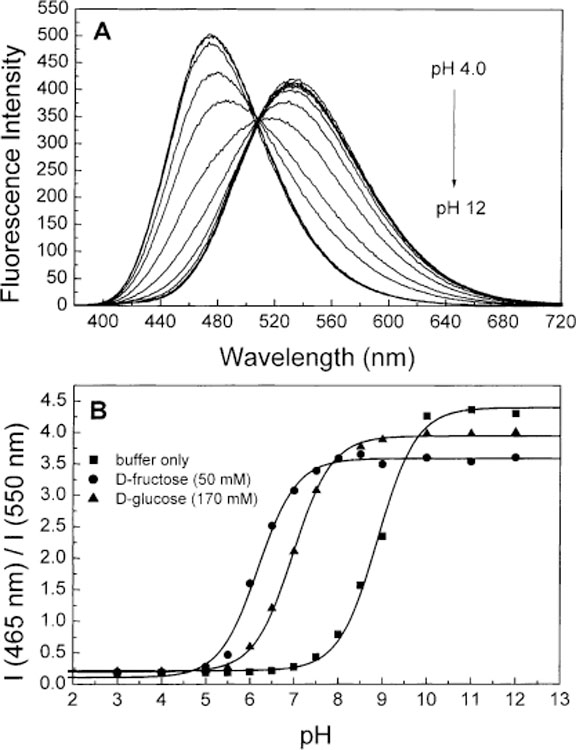
(A) pH dependence on the emission spectra of 1 without sugar at room temperature, λex = 370 nm. (B) Titration curves of 1 with and without sugar. All buffer solution contained 66.6% (v/v) of methanol.
Fig. 5.
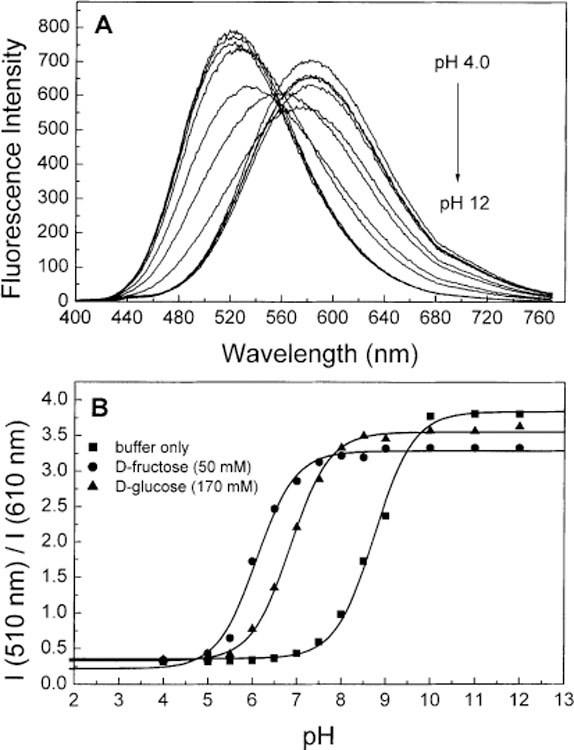
(A) pH dependence on the emission spectra of 2 without sugar at room temperature, λex = 390 nm. (B) Titration curves of 2 with and without sugar. All buffer solution contained 66.6% (v/v) of methanol.
Figs. 4B and 5B show the titration curves, in absence and presence of sugar, against the pH for 1 and 2, respectively. The pKa values are listed in Table 3. The pKa values with and without sugar are similar than the pKa observe for other phenylboronic acid derivatives [25,26,28–35]. As a general trend, the pKa of the boronic acid:sugar complex is smaller then the uncomplexed boronic acid group. We also observed a decrease of the pKa of the boronic acid group (with and without sugar) as the molecular length increase. The pKa values observed for the stilbene derivative (DSTBA) was 9.14 in comparison of 8.90 and 8.75 for 1 and 2, respectively. We attribute this decrease of the pKa to a decreased involvement of the boron atom in electron delocalization and/or to a more electrophilic boron atom as the molecular length increase. In other word, as the molecule length increase, the partial charge-transfer in the ground-state between the dimethylamino group and the boronic acid group become smaller and the boron atom is more “available” for a hydroxyl anion. This is in agreement with the fact that the emission shifts between the neutral and anionic forms become smaller as the molecular length increases as discuss previously.
Table 3.
pKa and dissociation constants (KD) for 1 and 2 in presence of different saccharides
| pKa |
KD (mM) |
||||||
|---|---|---|---|---|---|---|---|
| No fructose | Fructose (50 mM) | Glucose (170 mM) | Fructose | Galactose | Glucose | ||
| DSTBAa | 9.14 | 6.61 | 8.34b | 2.5 | 49 | 98 | |
| 1 | 8.90 ± 0.04 | 6.19 ± 0.04 | 6.97 ± 0.02 | 1.12 ± 0.05 | 5.9 ± 0.6 | 17 ± 2 | |
| 2 | 8.75 ± 0.04 | 6.10 ± 0.05 | 6.86 ± 0.02 | 0.84 ± 0.03 | 5.4 ± 0.4 | 15 ± 1 | |
From [35].
In presence of 50 mM of glucose.
Fig. 6 displays the frequency-domain decay profile of 1 (A) and 2 (B) at pH 4.0 and 11.0. Decay parameters are listed in Table 2. Both compound show a decrease of the mean lifetime at higher pH. Formation of the excited-state charge-transfer state induces a decrease of the mean lifetime (Section 3.1). Since an increase of the pH prevents formation of the CT state, we expected an increase of the mean lifetime at higher pH. At this point, we do not have a clear interpretation of these results and deeper study would be required to understand this effect. We just would like to point out that the change of the electron-withdrawing property of the boronic group following the formation of the anionic form leads to both spectral changes and change in the fluorescence lifetime of the probes. The implication of this observation for sugar sensing will be discuss in the next section.
Fig. 6.
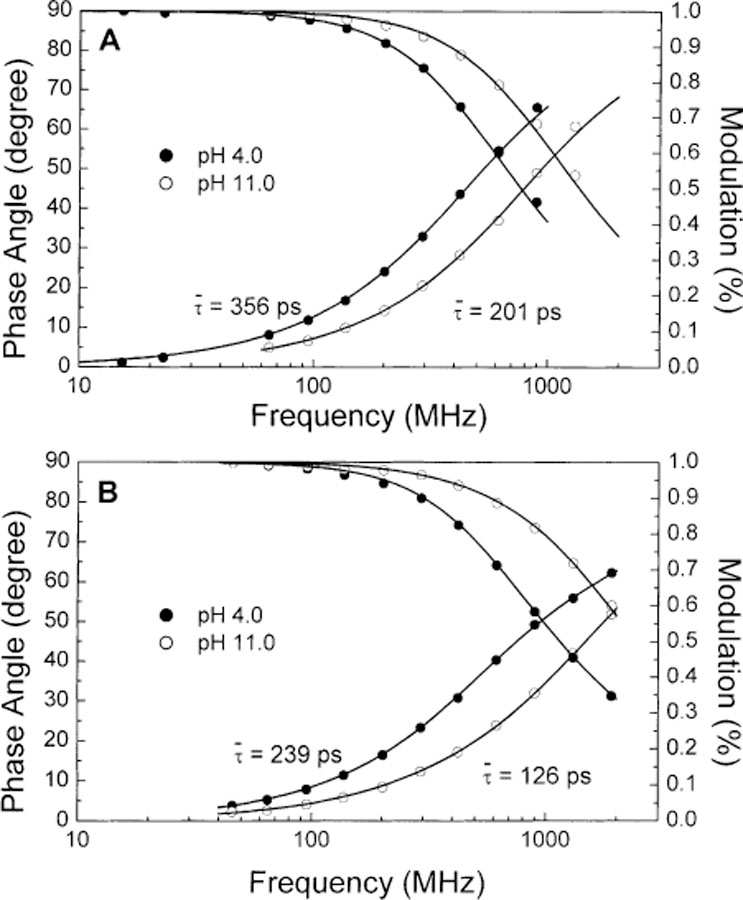
Dependence of pH on the frequency decay profiles of 1 (A) and 2 (B) at room temperature. All buffer solution contain 66.6% (v/v) of methanol.
3.3. Sugar effects on the spectroscopic and photophysical properties
The maximal spectral change appears at pH 7.5 for fructose and 8.0 for glucose for both compounds (Figs. 4B and 5B). We measured the effect of sugar at pH 8.0 to have the same pH for all compound and sugars and for comparison with previous results on stilbene derivatives [35]. For comparison, the spectral change for 1 for fructose at pH 8.0 is only about 6% smaller than at pH 7.5. Figs. 7 and 8 show the spectral changes following the addition of fructose and the titration curves of fructose, galactose and glucose for 1 and 2, respectively. In both cases, a blue shift of the emission spectra and an increase of the intensities were observed. These spectral changes are interpreted as the lost of the electron-withdrawing property of the boronic acid group following the complexation with sugar. At pH 8.0, the majority of the boronic acid groups are presented under their neutral forms. The anionic forms are created upon the addition of sugar since the pKa of the complex with sugars is smaller. Spectral changes observed for 1 are quite similar to the changes observed for the stilbene analogue (DSTBA) [35] showing that the CT mechanism could be apply to longer wavelength probes than the UV probes. On the other hand, spectral changes observed for 2 are smaller than the two other one. This could show that the CT effect decreases in importance with the increase of the length of this family of compounds and other fluorophores must be use to obtain longer wavelength probes for sugars.
Fig. 7.
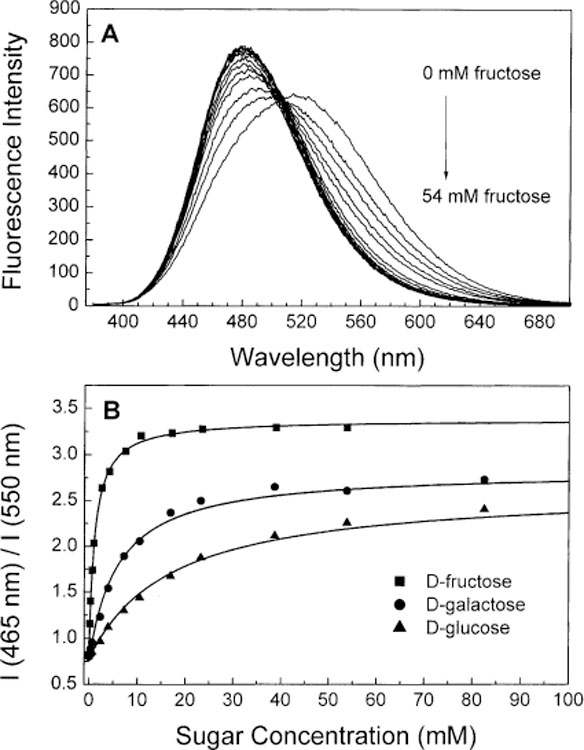
(A) Change in the emission spectra of 1 after addition of d-fructose in phosphate buffer pH 8.0/methanol 1:2 (v/v) at room temperature, λex = 370 nm. (B) Titration curves of 1 with different sugars.
Fig. 8.
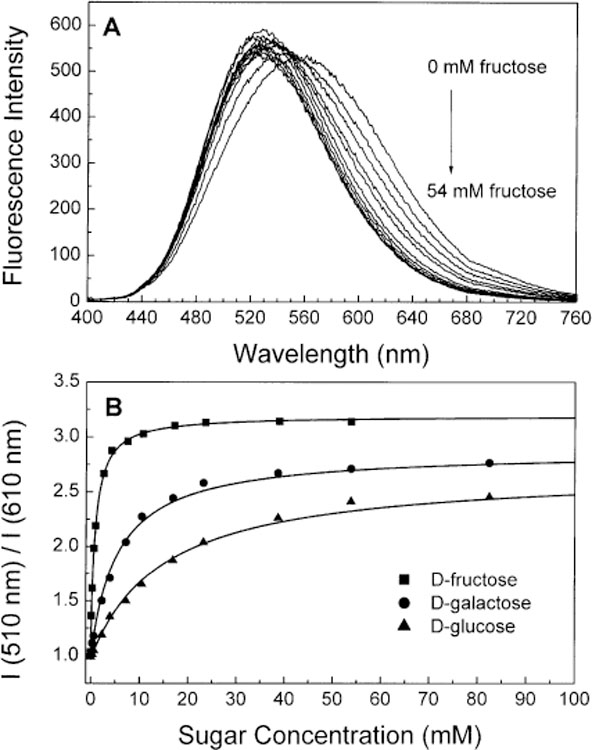
(A) Change in the emission spectra of 2 after addition of d-fructose in phosphate buffer pH 8.0/methanol 1:2 (v/v) at room temperature, λex = 390 nm. (B) Titration curves of 2 with different sugars.
Dissociation constants (KD) for the different sugar investigated are listed in Table 3 for 1 and 2. The trend of the KD for the different sugars is the same than for the other monophenylboronic acid probes presented in [25,26,28–35]. On the other hand, the KD values show large changes from DSTBA, 1 and 2. The dissociation constants decrease with the increase of the molecular length. This decrease is drastic for the KD values of galactose and glucose. The decrease is around three-fold for fructose, near 10-fold for galactose and around six-fold for glucose dissociation constants from DSTBA to 2. Since the KD values of 1 and 2 are similar than other monophenylboronic acid probes [25,26,28–35], we think that for the stilbene derivative the boron atom is much more involved in the electron delocalization and/or the partial charge-transfer in the ground-state is so large that the nucleophilicity of the boronic acid group is low. This results in the increase of the pKa of the compound and a decrease of the apparent affinity constants for sugars. As the molecular length increases, the contribution of the boronic acid group to the delocalization decreases and pKa and affinity constants become more similar than the other monophenylboronic acid derivatives.
Fig. 9 displays the frequency-domain decay profiles with and without fructose for 1 and 2. Decay parameters are listed in Table 2. For both compounds, we observe a decrease of the mean lifetime after addition of fructose. As discuss previously in Section 3.2, we do not have a clear idea on the origin of this decrease. At this point, we would like just to mention that the use of the CT mechanism involving the boronic acid group leads not only to spectral changes but also to lifetime changes. For the compounds investigated in this paper, these lifetime changes are small. We think that this is due principally to the presence of a large non-radiative deactivation rate constant present for these polyenes [37,40,42], which minimize the sugar effect. We expect that the CT mechanism applied to longer lifetime fluorophores could lead to new probes for glucose displaying useful lifetime changes and useful for fluorescence lifetime-based sensing.
Fig. 9.
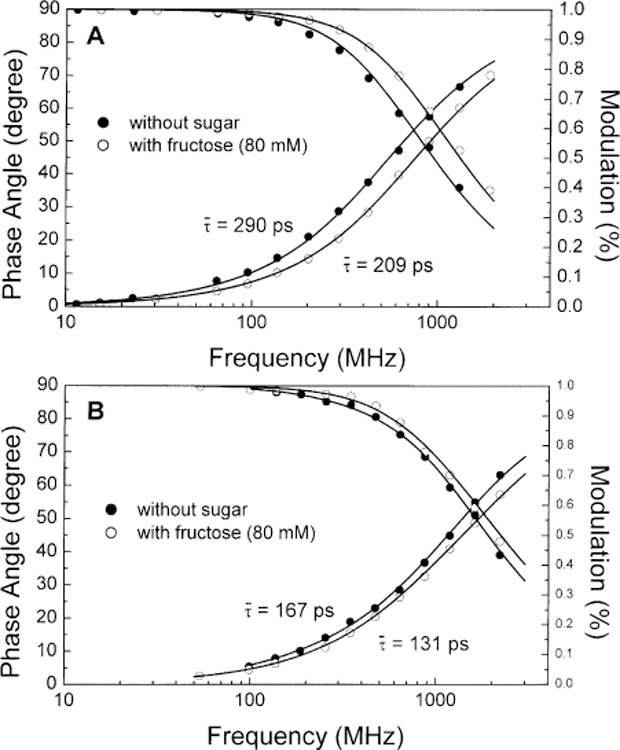
Sugar effect on the frequency decay profiles of 1 (A) and 2 (B) at room temperature in phosphate buffer pH 8.0/methanol 1:2 (v/v).
4. Conclusion
Long wavelength and ratiometric probes for sugars have been synthesized. The probes are based on donor–acceptor diphenylbutadiene and diphenylhexatriene derivatives involving the boronic acid group display useful shifts and intensity changes in their emission spectra. These changes are induced by the changes of the electron-withdrawing property between the boronic acid group and its anionic form. Compared to the analogous stilbene probe, which also displays the charge-transfer mechanism, the charge-transfer mechanism can be apply for longer wavelength probes. We expected that this mechanism could be extended to the development of red and/or near infrared probes using appropriate fluorophores. In addition, the charge-transfer mechanism induces a change in the fluorophore lifetime of the probes opening the door to the development of new probes for fluorescence lifetime-based sensing for sugars.
Acknowledgements
N. Di Cesare is grateful to the National Science and Engineering Research Council of Canada (NSERC) for a post-doctoral fellowship. This work was supporting by the Juvenile Diabetes Foundation International, 1-2000-546, with partial support from the NIH National Center for Research Resources, RR-08119.
Abbreviations:
- CH
cyclohexane
- WM
water:methanol (1:2)
- CT
excited-state charge-transfer
- DSTBA
4′-(dimethylamino)stilbene-4-boronic acid
References
- [1].Gough DA, Armour JC, Diabetes 44 (1995) 1005. [DOI] [PubMed] [Google Scholar]
- [2].Claremont DJ, Sambrook IE, Penton C, Pickup JC, Diabetologia 29 (1986) 817. [DOI] [PubMed] [Google Scholar]
- [3].Yokowama K, Sode K, Tamiya E, Karube I, Anal. Chim. Acta 218 (1989) 137. [Google Scholar]
- [4].Heller A, Annu. Rev. Biomed. Eng 1 (1999) 153. [DOI] [PubMed] [Google Scholar]
- [5].Robinson MR, Eaton RP, Haaland DM, Koepp GW, Thomas EV, Stallard BR, Robinson PL, Clin. Chem 38 (1992) 1618. [PubMed] [Google Scholar]
- [6].Heise HM, Marbach R, Koschinsky T, Gries FA, Artif. Organs 18 (1994) 439. [DOI] [PubMed] [Google Scholar]
- [7].Burmeister JJ, Chung H, Arnold MA, Photochem. Photobiol 67 (1998) 50. [PubMed] [Google Scholar]
- [8].Rabinovitch R, March WF, Adams RL, Diabetes Care 5 (1982) 254. [DOI] [PubMed] [Google Scholar]
- [9].March WF, Rabinovitch B, Adams R, Wise JR, Melton M, Trans. Am. Soc. Artif. Organ 28 (1992) 232. [PubMed] [Google Scholar]
- [10].Tretnak W, Wolfbeis OS, Anal. Chim. Acta 221 (1989) 195. [Google Scholar]
- [11].Meadows D, Schultz JS, Talanta 35 (1988) 150. [DOI] [PubMed] [Google Scholar]
- [12].Tolosa L, Malak H, Rao G, Lakowicz JR, Sens. Actuators B 45 (1997) 93. [DOI] [PMC free article] [PubMed] [Google Scholar]
- [13].Tolosa L, Gryczynski I, Eichorn LR, Datterbaum JD, Castellano FN, Rao G, Lakowicz JR, Anal. Biochem 267 (1999) 114. [DOI] [PMC free article] [PubMed] [Google Scholar]
- [14].D’Auria S, Di Cesare N, Gryczynski Z, Gryczynski I, Rossi M, Lakowicz JR, Biochem. Biophys. Res. Commun 274 (2000) 727. [DOI] [PubMed] [Google Scholar]
- [15].Kenneth ER, Ernest KJ, Diabetes Technol. Ther 1 (1999) 3.11475302 [Google Scholar]
- [16].The diabetes control and complication trial research group, Diabetes 46 (1997) 271. [PubMed] [Google Scholar]
- [17].The diabetes control and complication trial research group, N. Engl. J. Med 329 (1993) 977. [DOI] [PubMed] [Google Scholar]
- [18].Valeur B, in: Lakowicz JR (Ed.), Topics in Fluorescence Spectroscopy, Plenum Press, New York, 1994, pp. 21–48. [Google Scholar]
- [19].Poenie M, Chen C-S, in: Herman B, Lemasters JJ (Eds.), New Fluorescence Probes for Cell Biology, Academic Press, New York, 1993, pp. 1–25. [Google Scholar]
- [20].Haugland RP, Handbook of Fluorescence Probes and Research Chemicals, Molecular Probes Inc
- [21].Smacinski H, Lakowicz JR, in: Lakowicz JR (Ed.), Topics in Fluorescence Spectroscopy, Plenum Press, New York, 1994, pp. 295–334. [Google Scholar]
- [22].Smacinski H, Lakowicz JR, Sens. Actuators B 29 (1995) 15. [DOI] [PMC free article] [PubMed] [Google Scholar]
- [23].Lakowicz JR, Gryczynski I, Gryczynski Z, Dattelbaum JD, Anal. Biochem 267 (1999) 397. [DOI] [PMC free article] [PubMed] [Google Scholar]
- [24].D’Auria S, Herman P, Rossi M, Lakowicz JR, Biochem. Biophys. Res. Commun 263 (1999) 550. [DOI] [PMC free article] [PubMed] [Google Scholar]
- [25].Lorand JP, Edwards JO, J. Org. Chem 24 (1959) 769. [Google Scholar]
- [26].Yoon J, Czarnik AW, J. Am. Chem. Soc 114 (1992) 5874. [Google Scholar]
- [27].Hartley JH, James TD, Wrad CJ, J. Chem. Soc., Perkin Trans 1 (2000) 3155. [Google Scholar]
- [28].James TD, Samankumara Sandanayake KRA, Shinkai S, Angew. Chem. Int. Ed. Engl 35 (1996) 1910. [Google Scholar]
- [29].Takeuchi M, Yoda S, Imada T, Shinkai S, Tetrahedron 53 (1997) 8335. [Google Scholar]
- [30].Samankumara Sandanayake KRA, James TD, Shinkai S, Pure Appl. Chem 68 (1996) 1207. [Google Scholar]
- [31].James TD, Samankumara Sandanayake KRA, Shinkai S, Nature 374 (1995) 345. [Google Scholar]
- [32].James TD, Samankumara Sandanayake KRA, Iguchi R, Shinkai S, J. Am. Chem. Soc 117 (1995) 8982. [Google Scholar]
- [33].Takeuchi M, Mizuno T, Shinmori H, Nakashima M, Shinkai S, Tetrahedron 52 (1996) 1195. [Google Scholar]
- [34].Samankumara Sandanayake KRA, James TD, Shinkai S, Chem. Lett (1995) 503.
- [35].Di Cesare N, Lakowicz JR, J. Phys. Chem, in press, 2001.
- [36].Lakowicz JR, Gryczynski I, in: Lakowicz JR (Ed.), Topic in Fluorescence Spectroscopy, Plenum Press, New York, 1991, pp. 293–335. [Google Scholar]
- [37].Singh AK, Mahalaxmi GR, Photochem. Photobiol 71 (2000) 387. [DOI] [PubMed] [Google Scholar]
- [38].Myung D, Whitten DG, J. Phys. Chem 92 (1988) 2945. [Google Scholar]
- [39].Singh AK, Darshi M, Kanvah S, J. Phys. Chem 104 (2000) 464. [Google Scholar]
- [40].Sonoda Y, Morrii H, Sakuragi M, Suzuki Y, Chem. Lett (1998) 349.
- [41].Lin CT, Guan HW, McCoy RK, Spangler CW, J. Phys. Chem 93 (1989) 39. [Google Scholar]
- [42].Keery KM, Fleming GR, Chem. Phys. Lett 93 (1982) 322. [Google Scholar]


