Abstract
Diabetic nephropathy (DN) is the leading cause of end‐stage kidney disease. TGF‐β1/Smad3 signalling plays a major pathological role in DN; however, the contribution of Smad4 has not been examined. Smad4 depletion in the kidney using anti‐Smad4 locked nucleic acid halted progressive podocyte damage and glomerulosclerosis in mouse type 2 DN, suggesting a pathogenic role of Smad4 in podocytes. Smad4 is upregulated in human and mouse podocytes during DN. Conditional Smad4 deletion in podocytes protects mice from type 2 DN, independent of obesity. Mechanistically, hyperglycaemia induces Smad4 localization to mitochondria in podocytes, resulting in reduced glycolysis and oxidative phosphorylation and increased production of reactive oxygen species. This operates, in part, via direct binding of Smad4 to the glycolytic enzyme PKM2 and reducing the active tetrameric form of PKM2. In addition, Smad4 interacts with ATPIF1, causing a reduction in ATPIF1 degradation. In conclusion, we have discovered a mitochondrial mechanism by which Smad4 causes diabetic podocyte injury.
Keywords: ATPIF1, PKM2, podocyte, Smad4, type 2 diabetic nephropathy
Subject Categories: Metabolism, Molecular Biology of Disease
This study reveals a mitochondrial role of Smad4 in the pathogenesis of diabetic nephropathy.

Introduction
Type 2 diabetes is the most common cause of end‐stage renal disease (ESRD) in developed countries. Current therapies rely upon treatment of hyperglycaemia and control of hypertension, focusing on inhibition of the renin–angiotensin–aldosterone system (RAAS) 1. Despite attempts at optimal blood glucose and blood pressure control, diabetic nephropathy (DN) develops in many patients 2, 3, indicating that additional approaches are needed to halt the development and progression of DN.
TGF‐β1 regulates a diverse range of cellular responses 4, including proliferation, wound healing, differentiation, fibrosis, apoptosis and metabolism. Studies in human and experimental DN have identified a key role for TGF‐β1 in the development and progression of DN 5. However, systemic targeting of TGF‐β1 carries significant risks as demonstrated by the severe organ inflammation and early lethality seen in mice lacking Tgfb1 6, Tgfbr1 7, or lacking Tgfbr2 in T cells 8. Therefore, approaches are needed to target factors downstream of TGF‐β1 and its receptor to suppress disease development.
TGF‐β1 exerts its major biological effects through its cell surface receptors: TGF‐βRI and TGF‐βRII 4. Upon TGF‐β1 binding, the TGF‐βRI phosphorylates Smad2 and Smad3 which then oligomerize with Smad4 to form a complex that translocates into the nucleus. Smad3 and/or Smad4 can directly bind to DNA sequences or cofactors to regulate transcription of their target genes 4. Global deletion of Smad2 or Smad4 is lethal, whereas Smad3‐deficient mice are viable 9, leading to a major focus on TGF‐β1/Smad3 signalling. Mice lacking Smad3 are resistant in many models of tissue fibrosis 10. In particular, Smad3‐deficient mice are protected from albuminuria and renal fibrosis in type 1 DN 11 and are resistance to high fat diet (HFD)‐induced obesity, insulin resistance and diabetes 12, 13. In addition, Smad3 deficiency protects mice from HFD‐induced kidney disease 14. By contrast, little is known about Smad4 in diabetes or DN. Blockade of Smad4 in pancreatic beta cells attenuated HFD‐induced glucose intolerance, but not insulin resistance 15, while Smad4 protein levels in skeletal muscle are upregulated in the obese subjects compared to the lean subjects 16. Of note, activation of AMP‐activated protein kinase (AMPK) inhibits nuclear translocation of Smad4 and reduces mesangial matrix accumulation and early DN 17. In addition, studies in colon cancer cells show that Smad4 deficiency increases aerobic glycolysis and enhances cell migration 18. Taken together, these lines of evidence suggest that Smad4 may play a distinct role in metabolism which could be relevant to obesity and type 2 diabetes. Therefore, the aim of the current study was to determine whether Smad4 plays a pathologic role in type 2 DN.
We investigated Smad4 function in kidney disease in a well‐validated mouse model of accelerated type 2 diabetes which employs HFD and a single low‐dose streptozotocin (STZ) injection 19, 20, 21, 22, 23, 24, 25, 26, 27, 28. The HFD/STZ model was performed in hypertensive eNOS‐deficient mice which have increased susceptibility to diabetic kidney disease 29, 30, 31. Knockdown of Smad4 expression in the kidney halted the progression of DN. Furthermore, conditional Smad4 deletion in podocytes was sufficient to protect against DN, without affecting obesity. Under diabetic conditions, Smad4 was present in podocyte mitochondria in association with reduced glycolysis and oxidative phosphorylation (OXPHOS), and increased production of reactive oxygen species. We show that Smad4 interacts directly with the rate‐limiting glycolytic enzyme PKM2 and with ATPase inhibitory factor 1 (ATPIF1) to regulate glycolysis and OXPHOS in podocytes, respectively. In summary, our study uncovers both a pathologic role and a novel mechanism of action by which Smad4 in podocytes promotes kidney disease in type 2 diabetes.
Results
Knockdown of Smad4 in the kidney improves renal function and halts progression of type 2 DN
To investigate the role of Smad4 in the progression of type 2 DN, we used systemic administration of a locked nucleic acid (LNA) to knockdown Smad4 mRNA and protein expression in the kidney. LNA is nucleic acid analogues in which the ribose ring is “locked” by a methylene bridge 32, 33, resulting in increased target specificity and resistance to both exonucleases and endonucleases, giving excellent stability in vivo 34, 35, 36. In particular, LNA anti‐sense oligonucleotides exhibit preferential uptake by the kidney 37, 38.
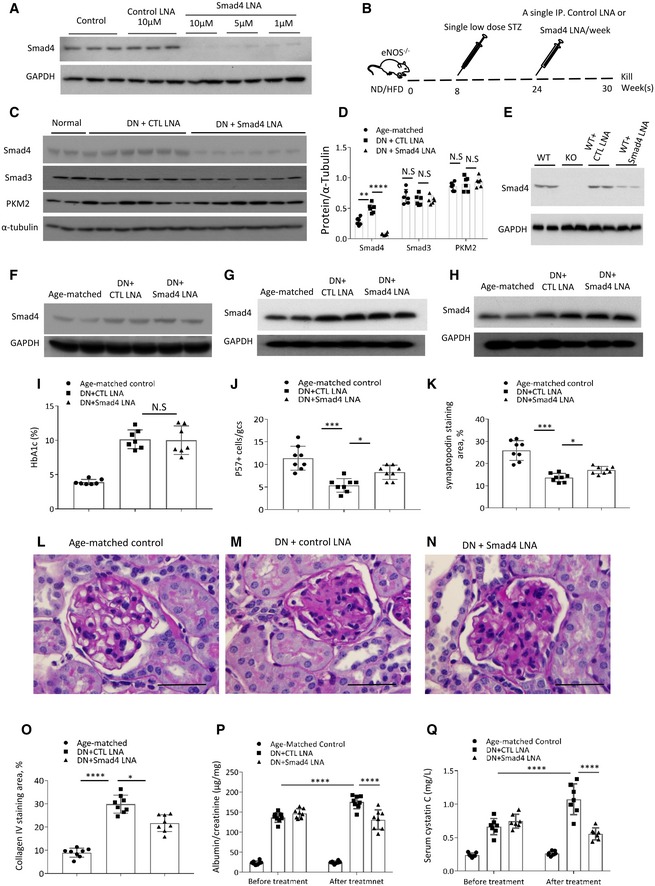
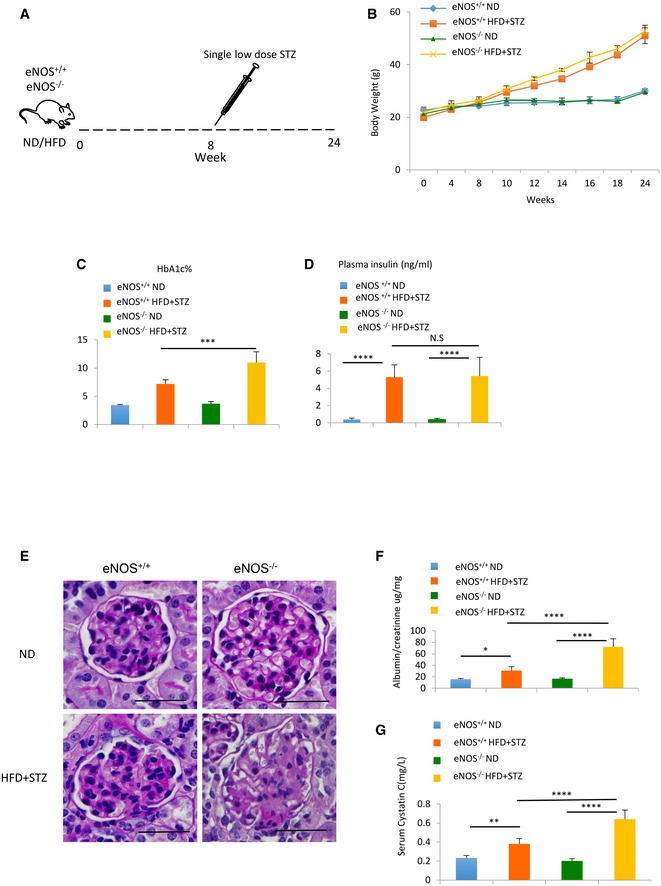
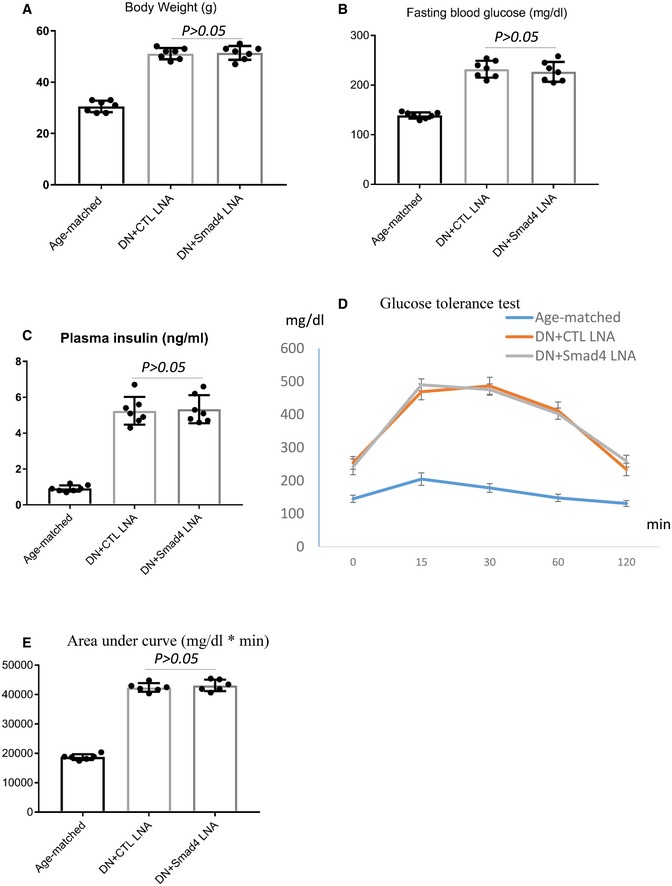
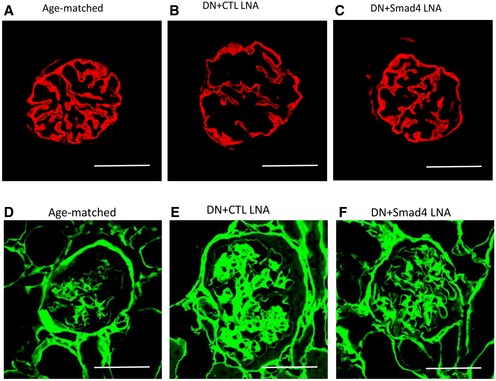
First, we validated efficient Smad4 knockdown in cultured podocytes 4 days after the addition of Smad4 LNA, while control‐LNA did not affect Smad4 expression (Fig 1A). Next, we sought to knockdown Smad4 in type 2 diabetes with established kidney disease. In this model, hypertensive eNOS −/− mice on the C57BL/6J background are placed on a high fat diet (HFD) for 30 weeks with a single STZ injection on week 8 to further increase blood glucose levels to diabetic state while remaining hyperinsulinaemia, a characteristic of type 2 diabetes 19, 20, 21, 22, 23, 24, 25, 26, 27, 28, 29, 30, 31. This regimen results in hyperglycaemia, hyperinsulinaemia, albuminuria, glomerulosclerosis and reduced kidney function (Fig EV1). Groups of 8 mice were treated with 10 mg/kg Smad4 LNA or control‐LNA (CTL LNA) by once‐weekly intraperitoneal injection from week 24 until being killed at week 30 (Fig 1B). Smad4 LNA efficiently downregulated Smad4 protein levels in the kidney, without affecting protein levels of Smad3 or the glycolysis enzyme, PKM2 (Fig 1C and D). In addition, we demonstrated efficient knockdown of Smad4 in podocytes isolated from these mice (Fig 1E). By contrast, Smad4 expression in liver, lung and spleen was unaffected by Smad4 LNA treatment (Fig 1F–H). Body weight, glucose intolerance and hyperglycaemia were equivalent in the LNA‐treated groups as shown by HbA1c levels (Figs 1I and EV2). CTL LNA‐treated mice exhibited substantial podocyte damage at week 30 as shown by a reduction in the number of podocytes (defined by p57 immunostaining) and by a reduction in the area of staining for the podocyte marker, synaptopodin (Figs 1J and K, and EV3A–C). Smad4 LNA treatment also significantly reduced the severity of glomerulosclerosis compared to CTL LNA treatment as illustrated by PAS staining and quantified using collagen IV deposition (Figs 1L–O and EV3D–F). In addition, Smad4 LNA treatment significantly reduced albuminuria (urine albumin‐to‐creatinine ratio) and improved renal function (serum cystatin C levels) in established DN compared to CTL LNA (Fig 1P and Q). Taken together, these data demonstrate that administration of Smad4 LNA can selectively target Smad4 expression in the kidney and halt the progression of established DN, independent of the diabetic state.
Figure 1. Smad4 LNA decreases Smad4 expression and halts the progression of type 2 diabetic nephropathy.
-
AWestern blotting demonstrated Smad4 expression levels in mouse podocytes 4 days after Smad4 LNA or CTL LNA treatment.
-
BSchema illustrating administration of Smad4 LNA or CTL LNA in model of type 2 diabetic nephropathy (DN) in eNOS‐deficient mice.
-
CWestern blotting demonstrated expression levels of Smad4, Smad3, PKM2 and α‐tubulin after 6‐week Smad4 LNA or CTL LNA treatment in age‐matched kidney or type 2 DN.
-
DQuantification of expression levels of Smad4, Smad3, PKM2 and α‐tubulin after 6‐week Smad4 LNA or CTL LNA treatment in age‐matched kidney or type 2 DN.
-
EWestern blotting demonstrated expression levels of Smad4 in WT, Smad4 KO (KO), control‐LNA‐treated WT and Smad4 LNA‐treated WT podocytes.
-
F–HWestern blotting demonstrated expression levels of Smad4 and GAPDH in lung (F), spleen (G) and liver (H) in age‐matched mice, 6‐week Smad4 LNA‐treated or CTL LNA‐treated mice.
-
IHbA1C after Smad4 LNA or CTL LNA treatment.
-
JQuantification of p57+ cells per glomerular cross section (GCS) in age‐matched, 6‐week Smad4 LNA‐treated or CTL LNA‐treated mouse kidneys.
-
KQuantification of staining area of synaptopodin in glomeruli in age‐matched, 6‐week Smad4 LNA‐treated or CTL LNA‐treated mouse kidneys.
-
L–NPAS staining demonstrating age‐matched kidney, CTL LNA‐treated DN and Smad4 LNA‐treated DN. Scale bars: 50 μm.
-
O–QQuantification of collagen IV staining (O), urinary albumin/creatinine ratio (P) and serum Cystatin C levels (Q) in age‐matched mice, CTL LNA‐treated or Smad4 LNA‐treated mice with type 2 DN.
Figure EV1. Characteristics of a mouse model of type 2 diabetic nephropathy.
-
ASchema illustrating mouse model of type 2 diabetic nephropathy (DN) using high fat diet (HFD) and a single‐dose streptozotocin (50 mg/kg) intraperitoneal injection.
-
BIncrement change of body weight in eNOS+/+ ND, eNOS+/+ HFD+STZ, eNOS−/− ND and eNOS−/− HFD+STZ.
-
C, DHbA1c% (C) and plasma insulin level (D) change in eNOS+/+ ND, eNOS+/+ HFD+STZ, eNOS−/− ND and eNOS−/− HFD+STZ after 24 weeks of treatment.
-
EPeriodic acid–Schiff (PAS) staining of sections from eNOS+/+ ND, eNOS+/+ HFD+STZ, eNOS−/− ND and eNOS−/− HFD+STZ mouse kidneys. Scale bars: 50 µm.
-
FUrinary albumin/creatinine ratio changes from eNOS+/+ ND, eNOS+/+ HFD+STZ, eNOS−/−ND and eNOS−/− HFD+STZ mouse.
-
GSerum cystatin C changes from eNOS+/+ ND, eNOS+/+ HFD+STZ, eNOS−/− ND and eNOS−/− HFD+STZ mouse.
Figure EV2. Smad4 LNA administration retards the progression of mouse type 2 diabetic nephropathy.
-
A–CChanges in body weight, fasting blood glucose levels and plasma insulin in age‐matched, control‐LNA (CTL LNA)‐treated or Smad4 LNA‐treated type 2 diabetic eNOS−/− mice.
-
D, EGlucose tolerance test (E) and quantification of glucose tolerance test (D) in age‐matched, control‐LNA (CTL LNA)‐treated or Smad4 LNA‐treated type 2 diabetic eNOS−/− mice.
Figure EV3. Smad4 LNA treatment decreases podocyte injury and glomerulosclerosis in type 2 diabetic nephropathy.
-
A–FConfocal microscopy demonstrated synaptopodin (red, A–C) and collagen IV expression (green, D–F) in age‐matched kidney, CTL LNA‐treated diabetic nephropathy and Smad4 LNA‐treated diabetic nephropathy. Scale bars: 50 µm.
Upregulation of Smad4 in podocytes in type 2 DN
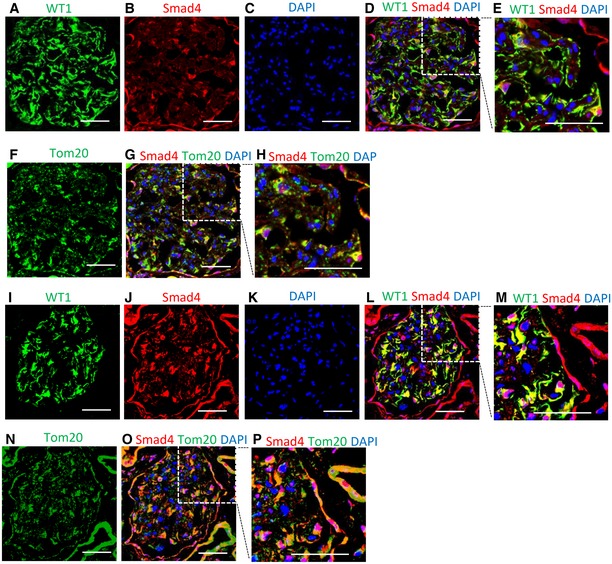
The protective effects of Smad4 LNA in type 2 DN could be accounted for, at least in part, by protecting podocytes from injury. Therefore, we examined podocyte Smad4 expression in human and mouse DN. Confocal microscopy showed Smad4 staining in glomerular cells, including WT1+ podocytes, in normal human kidney, with relatively little co‐localization of Smad4 with the mitochondrial marker Tom20 (Fig 2A–H). Note that the WT1 antibody used recognizes an isoform of WT1 present in the cytoplasm, not in the nucleus, of podocytes 39, 40. A marked increase in Smad4 expression was evident in glomerular podocytes in diabetic nephropathy, with co‐localization of Smad4 and Tom20 evident in some cells (Fig 2I–P).
Figure 2. Smad4 expression is increased in human diabetic nephropathy.
-
A–HConfocal microscopy demonstrated WT1 (A, green), Smad4 (B, red), DAPI (C, blue), merged image (D, WT1+Smad4+DAPI), digital enlargement of part of D (E), Tom20 (F, green), merged image (G, Smad4+Tom20+DAPI) and digital enlargement of part of G (H) in normal human kidney. Scale bars: 50 µm.
-
I–PConfocal microscopy demonstrated WT1 (I, green), Smad4 (J, red), DAPI (K, blue), merged image (L, WT1+Smad4+DAPI), digital enlargement of part of L (M), Tom20 (N, green), merged image (O, Smad4+Tom20+DAPI) and digital enlargement of part of O (P) in renal biopsy with diabetic nephropathy. Scale bars: 50 µm. Of note, localization of WT1 and Smad4, and Smad4 and Tom20. Scale bars: 50 µm.
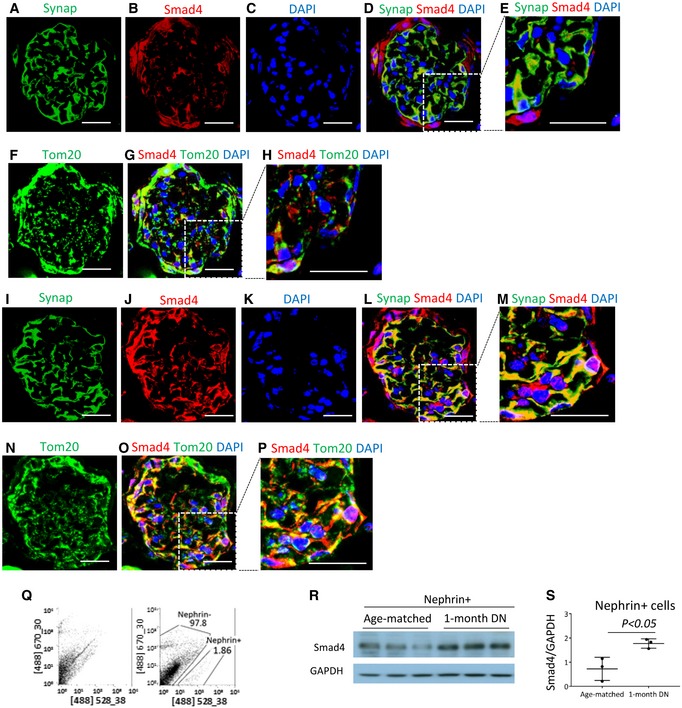
Smad4 staining is also evident in some podocytes in normal mouse kidney, with little co‐localization of Smad4 with Tom20 (Fig 3A–H). However, diabetic kidneys exhibited upregulation of Smad4 in glomeruli, with some Smad4 protein clearly co‐localizing with Tom20 in some glomerular cells, including podocyte‐like cells (Fig 3I–P). Upregulation of Smad4 in podocytes is a relatively early event in mouse DN, with Western blotting of isolated podocytes showing increased Smad4 protein levels after 4 weeks of diabetes (Fig 3Q–S). These findings suggest a potential role for Smad4 in podocyte metabolism.
Figure 3. Smad4 expression is increased in mouse diabetic nephropathy (DN).
-
A–HConfocal microscopy demonstrated synaptopodin (A, Synap, green), Smad4 (B, red), DAPI (C, blue), merged image (D, Synap+Smad4+DAPI), digital enlargement of part of D (E), Tom20 (F, green), merged image (G, Smad4+Tom20+DAPI) and digital enlargement of part of G (H) in normal mouse kidney. Scale bars: 30 µm.
-
I–PConfocal microscopy demonstrated synaptopodin (I, Synap, green), Smad4 (J, red), DAPI (K, blue), merged image (L, Synap+Smad4+DAPI), digital enlargement of part of L (M), Tom20 (N, green), merged image (O, Smad4+Tom20+DAPI) and digital enlargement of part of O (P) in mouse DN (I–P). Scale bars: 30 µm. Of note, localization of Synap and Smad4, and Smad4 and Tom20.
-
QNephrin (+) cells were isolated by FACS from mouse kidneys.
-
R, SWestern blotting demonstrated Smad4 expression in isolated nephrin (+) cells.
Smad4 deficiency in podocytes preserves renal function and protects mice from glomerulosclerosis in type 2 DN
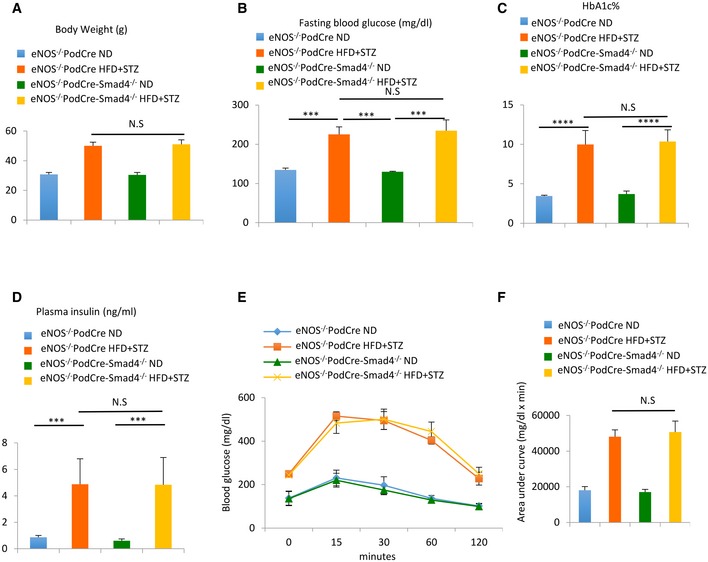
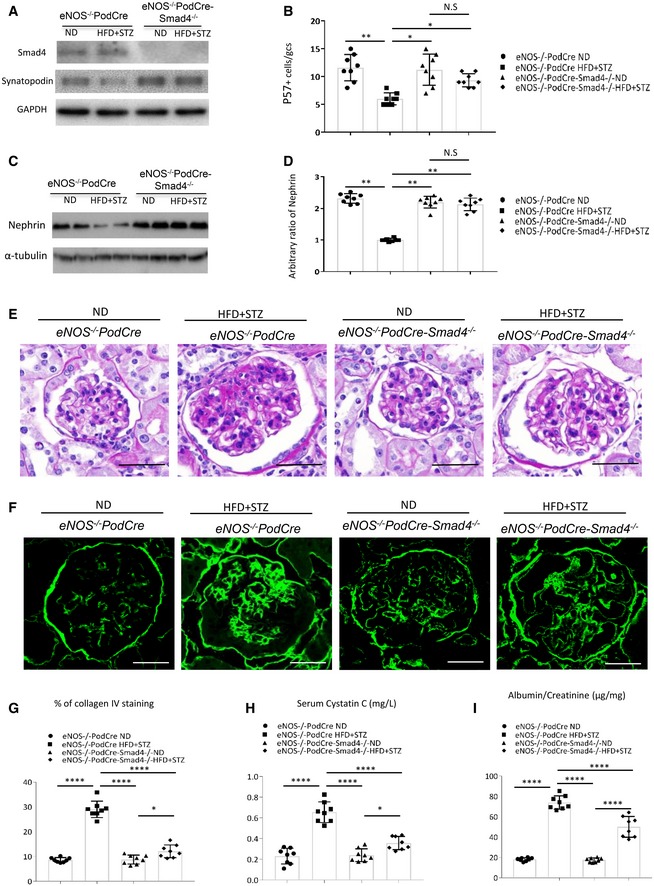
To specifically address the question of whether Smad4 affects podocyte function in type 2 DN, we generated eNOS −/− mice with Smad4 deletion in podocytes (eNOS −/−;PodCre‐Smad4 flox/flox mice) on the C57BL/6J background. Mice lacking Smad4 in podocytes have a normal phenotype. We then induced type 2 DN using the 30‐week HFD/STZ model in eNOS −/− ;PodCre‐Smad4 −/− and eNOS −/− ;PodCre littermate controls. Both mouse genotypes developed equivalent obesity, elevated blood glucose and HbA1c levels, hyperinsulinaemia and glucose intolerance (Fig EV4A–F). To validate conditional Smad4 deletion, podocytes were isolated from diabetic and non‐diabetic control kidneys by flow cytometry. Western blot analysis confirmed efficient Smad4 deletion in podocytes from eNOS −/− ;PodCre‐Smad4 −/− mice (Fig 4A). Compared to control diabetic mice, diabetic eNOS −/− ;PodCre‐Smad4 −/− mice were substantially protection against podocyte damage in terms of loss of p57+ podocytes and downregulation of the podocyte‐specific protein, nephrin (Fig 4B–D). Control diabetic mice exhibited glomerular hypertrophy, mesangial matrix expansion (PAS staining), glomerulosclerosis (increased glomerular collagen IV deposition), reduced renal function (increased serum cystatin C) and albuminuria (increased urine albumin/creatinine ratio) (Fig 4E–I). By comparison, diabetic eNOS −/− ;PodCre‐Smad4 −/− mice showed marked protection against mesangial matrix expansion and glomerulosclerosis, although glomerular hypertrophy was still evident (Fig 4E–G). In addition, diabetic eNOS −/− ;PodCre‐Smad4 −/− mice showed improved renal function and reduced albuminuria (Fig 4H and I). Thus, Smad4 deficiency in podocytes preserved renal function and protected mice from kidney injury despite unaltered diabetes and obesity (Fig EV4).
Figure EV4. Smad4 deficiency in podocytes protects mice from type 2 diabetic nephropathy.
-
A–DChanges in body weight, fasting blood glucose levels, HbA1c and plasma insulin in ND‐treated or HFD+STZ‐treated eNOS−/− PodCre mice or eNOS−/− PodCre‐Smad4−/− mice.
-
E, FGlucose tolerance test (E) and quantification of glucose tolerance test (F) in ND‐treated or HFD+STZ‐treated eNOS−/− PodCre mice or eNOS−/− PodCre‐Smad4−/− mice.
Figure 4. Smad4 deficiency in podocytes reduces kidney injury in type 2 diabetic nephropathy (DN).
-
AWestern blotting demonstrating expression levels of Smad4, synaptopodin and GAPDH in nephrin (+) cells isolated from eNOS−/− PodCre ND, eNOS−/− PodCre HFD+STZ, eNOS−/− PodCre‐Smad4−/−ND and eNOS−/− PodCre‐Smad4−/− HFD+STZ‐treated mouse kidneys.
-
BQuantification of p57+ cells per glomerular cross section (GCS) in eNOS−/− PodCre ND, eNOS−/− PodCre HFD+STZ, eNOS−/− PodCre‐Smad4−/− ND and eNOS−/− PodCre‐Smad4−/− HFD+STZ‐treated mouse kidneys.
-
CWestern blotting demonstrating expression levels of nephrin and α‐tubulin in eNOS−/− PodCre ND, eNOS−/− PodCre HFD+STZ, eNOS−/− PodCre‐Smad4−/− ND and eNOS−/− PodCre‐Smad4−/− HFD+STZ‐treated mouse kidneys.
-
DQuantification of ratios of nephrin/α‐tubulin in Western blotting.
-
EPeriodic acid–Schiff (PAS) staining of sections from ND‐treated or HFD+STZ‐treated eNOS−/− PodCre or eNOS−/− PodCre‐Smad4−/− mouse kidneys.
-
FConfocal microscopy demonstrated collagen IV expression in ND‐treated or HFD+STZ‐treated eNOS−/− PodCre or eNOS−/− PodCre‐Smad4−/− mouse kidneys.
-
G–IQuantitation of collagen IV staining area/glomerular cross section (G), serum cystatin C levels (H) and urinary albumin/creatinine ratio (I) in ND‐treated or HFD+STZ‐treated eNOS−/−PodCre mouse or eNOS−/−PodCre‐Smad4−/− mouse kidneys.
Smad4 deficiency in podocytes promotes glycolysis and OXPHOS activity under high glucose conditions
Ozawa et al 41 demonstrated that glycolysis is a major contributor to intracellular ATP production in podocytes and that phosphofructokinase, a rate‐limiting enzyme for glycolysis, is expressed in podocyte foot processes. This suggests an important role for glycolysis in normal podocyte function, leading us to investigate whether the protective effects of Smad4 deletion in podocytes are related to glycolysis.
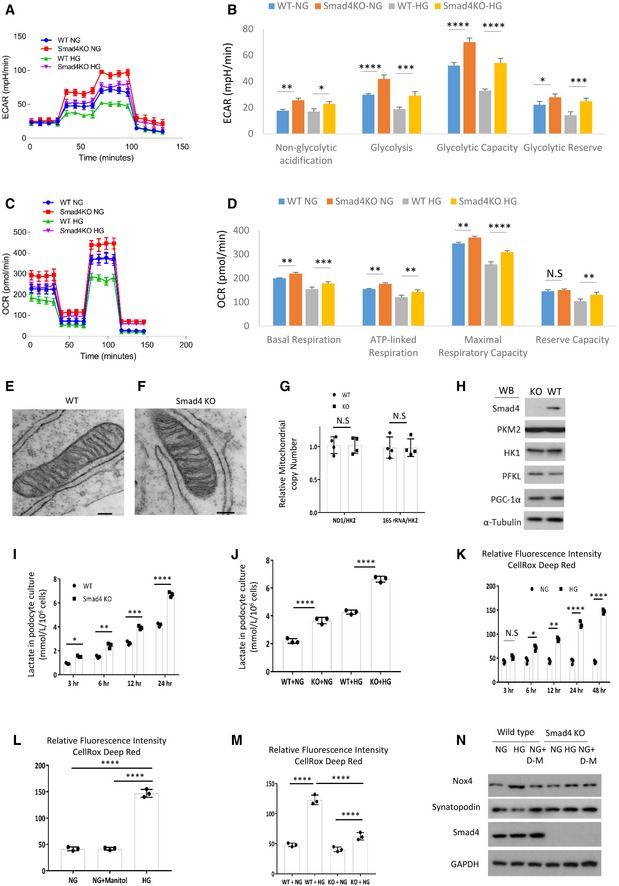
The Seahorse Glycolysis Stress Test demonstrated that glycolysis, glycolytic capacity, glycolytic reserve and non‐glycolytic acidification were increased in Smad4 −/− compared to wild‐type podocytes under both normal (NG, 1 g/l d‐glucose) and high glucose (HG, 4.5 g/l d‐glucose) conditions (Fig 5A and B). The Seahorse Cell Mito Stress Test demonstrated that Smad4 deficiency increased basal, maximal and ATP‐linked respiration, but not proton leak, in podocytes under both normal and high glucose conditions (Fig 5C and D), indicating that Smad4 deficiency increases OXPHOS activity. Electron microscopy showed that Smad4 deficiency did not alter mitochondrial morphology (Fig 5E and F). Smad4 deficiency in cultured podocytes did not alter mitochondrial copy number (Fig 5G), or change protein levels of three rate‐limiting glycolytic enzymes or PGC‐1α, the mitochondrial biogenesis marker (Fig 5H). Compared to wild‐type podocytes, Smad4‐deficient podocytes have a greater capacity for lactate production (Fig 5I and J) and have reduced reactive oxygen species (ROS) production under both normal and high glucose conditions (Fig 5K–M). In addition, Smad4 deficiency prevented high glucose‐induced upregulation of NOX4 expression and downregulation of synaptopodin (Fig 5N). NOX4 is the main source of ROS in the kidney and Nox4 is increased in DN and in podocytes in response to high glucose 42, 43, 44. Podocyte‐specific Nox4 deletion protects mice from diabetic nephropathy and this protection is associated with reduced renal ROS production 44. Our studies demonstrated that Smad4 deletion promotes glycolysis, modulates OXPHOS activity, reduces NOX4 expression and ROS production and prevents high glucose‐induced injury in podocytes.
Figure 5. Smad4 deficiency increases glycolysis and lactate production, decreases reactive oxygen species and protects podocytes from high glucose‐induced injury.
-
AWild‐type (WT) and Smad4 KO mouse podocytes were treated with normal glucose (NG, 1 g/l d‐glucose) or high glucose (HG, 4.5 g/l d‐glucose) for 24 h then Seahorse was performed. Seahorse demonstrated real‐time changes of ECAR in WT and Smad4 KO podocytes after treatment with glucose, oligomycin and 2‐deoxy‐D‐glucose (2‐DG).
-
BQuantification of non‐glycolytic acidification, glycolysis, glycolytic capacity and glycolytic reserve.
-
CWT and Smad4 KO mouse podocytes were treated with NG or HG for 24 h then Seahorse was performed. Seahorse demonstrated real‐time changes of oxygen consumption rate (OCR) after treatment with oligomycin, FCCP and rotenone in WT and Smad4 KO podocytes.
-
DQuantification of basal, maximal, ATP‐linked respiration and reserve capacity.
-
E, FElectron microscopy demonstrated mitochondria morphology in WT (E) and Smad4 KO (F) podocytes. Scale bars: 1 µm.
-
GPCR demonstrated relative mitochondrial copy number in WT and Smad4 KO podocytes.
-
HWestern blotting demonstrated expression of Smad4, HK1, PKM2, PFKL, PGC‐1α and α‐tubulin in WT and Smad4 KO podocytes.
-
I, JLactate production in WT or Smad4 KO podocytes under high glucose (HG) and normal glucose (NG) conditions.
-
KRelative fluorescence intensities of reactive oxygen species (ROS) under normal glucose (NG) or high glucose (HG) condition in podocytes.
-
LRelative fluorescence intensities of ROS after 24‐h NG, HG or NG+ D‐manitol treatment in podocytes.
-
MRelative fluorescence intensities of ROS after 24‐h NG or HG treatment in WT or Smad4 KO podocytes.
-
NWestern blotting demonstrated NOX4 and synaptopodin expression after 24‐h NG or HG treatment in WT or Smad4 KO podocytes.
Smad4 modulates glycolysis in podocytes through interaction with PKM2
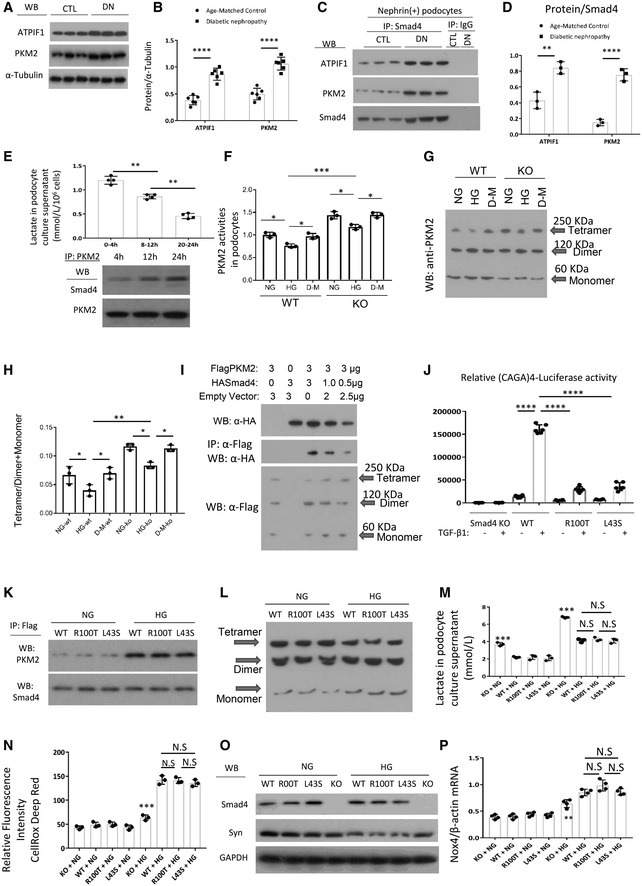
Next, we investigated the mechanism by which Smad4 regulates glycolysis in podocytes. Protein levels of the glycolytic enzyme, PKM2, were increased in the kidney of mouse type 2 DN compared to age‐matched, non‐diabetic controls (Fig 6A and B). In isolated podocytes, immunoprecipitation studies identified binding between Smad4 and PKM2 in non‐diabetic cells, and this interaction was increased in podocytes from diabetic mice (Fig 6C and D). A time‐course study showed that lactate production falls as the interaction between Smad4 and PKM2 increases during the culture of podocytes under high glucose conditions (Fig 6E). Podocytes isolated from age‐matched PodCre‐Smad4 −/− mice did not show a difference in PKM2 expression (Fig 5G). However, compared to wild‐type podocytes, cultured Smad4 −/− podocytes showed increased PKM2 activity under both normal and high glucose conditions (Fig 6F), suggesting that Smad4 may modulate PKM2 activity. The active form of PKM2 has a tetramer structure, whereas dimer and monomer forms are inactive 45. Cross‐linking studies showed that high glucose stimulation of podocytes caused a reduction in the active form of PKM2 (tetrameter), while Smad4‐deficient podocytes exhibited significantly greater levels of the PKM2 tetramer under both normal and high glucose conditions (Fig 6G and H). This led us to hypothesize that Smad4 may interact with PKM2 to inhibit the formation of PKM2 tetramer.
Figure 6. Smad4 interacts with rate‐limiting glycolytic enzyme PKM2 to modulate PKM2 tetramer formation and regulate lactate production in podocytes.
-
AWB demonstrated expression levels of ATPIF1 and PKM2 in age‐matched kidneys and 16‐week type 2 diabetic nephropathy.
-
BQuantitation of arbitrary ratios of ATPIF1 and PKM2 to α‐tubulin.
-
CImmunoprecipitation (IP)/WB demonstrated the interactions between Smad4 and ATPIF1 and PKM2 in nephrin+ podocytes isolated from age‐matched kidneys and 16‐week type 2 diabetic nephropathy.
-
DQuantitation of arbitrary ratios of ATPIF1 and PKM2 to Smad4.
-
ELactate production in different periods under high glucose treatment in podocytes (upper panel), IP/WB demonstrated interaction between Smad4 and PKM2 after 4‐, 12‐ and 24‐h HG treatment in podocytes (lower panel).
-
FPKM2 activities in wild‐type (WT), Smad4 KO (KO) mouse podocytes under normal glucose (NG), high glucose (HG) or D‐manitol (D‐M) treatment for 24 h.
-
GWestern blotting demonstrated PKM2 tetramer, dimer and monomer after normal glucose (NG), high glucose (HG) or D‐manitol (D‐M) treatment for 24 h in wild‐type (WT) or Smad4 KO (KO) mouse podocytes after cross‐linking treatment.
-
HQuantification of ratios of Tetramer/Dimer+Monomer.
-
I293T cells were transduced with FlagPKM2, HASmad4 and empty vector with various dosages. After 48 h, cells were collected for Western blotting (upper panel), immunoprecipitation/Western blotting (middle panel) and cross‐linking/Western blotting (lower panel). Western blotting demonstrated expression levels of HA‐Smad4 (upper panel), interactions of FlagPKM2 with HASmad4 (middle panel) and FlagPKM2 tetramer, dimer and monomer (lower panel).
-
JSmad4 KO podocytes were transduced with an empty retroviral vector, or retroviral vectors over‐expressing Smad4 WT, Smad4 R100T or Smad4 L43S. SBE4‐Luciferase assay demonstrated transcription activities in Smad4 KO, Smad4 WT, Smad4 R100T and Smad4 L43S podocytes with or without TGF‐β1 treatment.
-
KIP/WB demonstrated interaction between Smad4 and PKM2 after 24‐h NG or HG treatment in WT, R100T and L43S podocytes.
-
LCross‐linking/Western blotting demonstrated PKM2 tetramer, dimer and monomer after 24‐h NG or HG treatment in WT, R100T and L43S podocytes.
-
MLactate production in WT, R100T, L43S and Smad4 KO podocytes after 24‐h NG or HG treatment.
-
NCellRox Deep Red test demonstrated relative fluorescence intensity in WT, R100T, L43S and Smad4 KO podocytes treated with NG or HG for 24 h.
-
OWB demonstrated expression levels of synaptopodin, Smad4 and GAPDH in WT, R100T, L43S and Smad4 KO podocytes treated with NG or HG for 24 h.
-
PRT–qPCR demonstrated ratios of Nox4/β‐actin in WT, R100T, L43S and Smad4 KO podocytes treated with NG or HG for 24 h.
To further investigate the Smad4/PKM2 interaction, 293T cells were co‐transfected with Flag‐tagged PKM2 and HA‐tagged Smad4 expression plasmids and cross‐linking studies performed. Decreasing HA‐Smad4 expression (upper panel) resulted in a decrease in the interaction between HA‐Smad4 and Flag‐PKM2 (middle panel) and the increase in the tetramer form of PKM2 and the ratio of the tetramer to dimer + monomer forms (lower panel) (Fig 6I). These findings provide direct evidence that Smad4 interacts with PKM2 to inhibit PKM2 tetramer formation.
Canonical TGF‐β1/Smad4 signalling involves Smad4 translocation to the nucleus to regulate gene transcription 4. Indeed, mutations of the key amino acids (R100T and L43S) that facilitate Smad4 nuclear translocation prevent transcription of the Smad‐binding element (SBE) 46. If Smad4 modulation of podocyte metabolism operates via a non‐canonical pathway, then it should be unaffected by blocking Smad4 nuclear localization. To address this question, Smad4 −/− podocytes were transduced with retroviral vectors expressing wild type (Smad4WT) or the mutants, Smad4R100T or Smad4L43S, which prevent Smad4 entry into the nucleus 46. First, we confirmed that Smad4R100T and Smad4L43S expressing cells had a greatly diminished response to TGF‐β1 stimulation in the SBE4‐luciferase assay compared to Smad4WT cells (Fig 6J), a response that depends upon Smad4 nuclear localization 46. Next, we used immunoprecipitation to show that Smad4R100T/PKM2 and Smad4L43S/PKM2 interactions are comparable to that of Smad4WT/PKM2 (Fig 6K). In addition, cells transduced with Smad4R100T or Smad4L43S were comparable to Smad4WT transduced cells in terms of PKM2 tetramer formation (Fig 6L), lactate and ROS production (Fig 6M and N), synaptopodin expression (Fig 6O) and NOX4 expression (Fig 6P). These data show that Smad4 regulation of glycolysis is independent of a Smad4 nuclear function.
Quantitative proteomic analysis identifies downregulation of ATPIF1 in Smad4 deficient podocytes
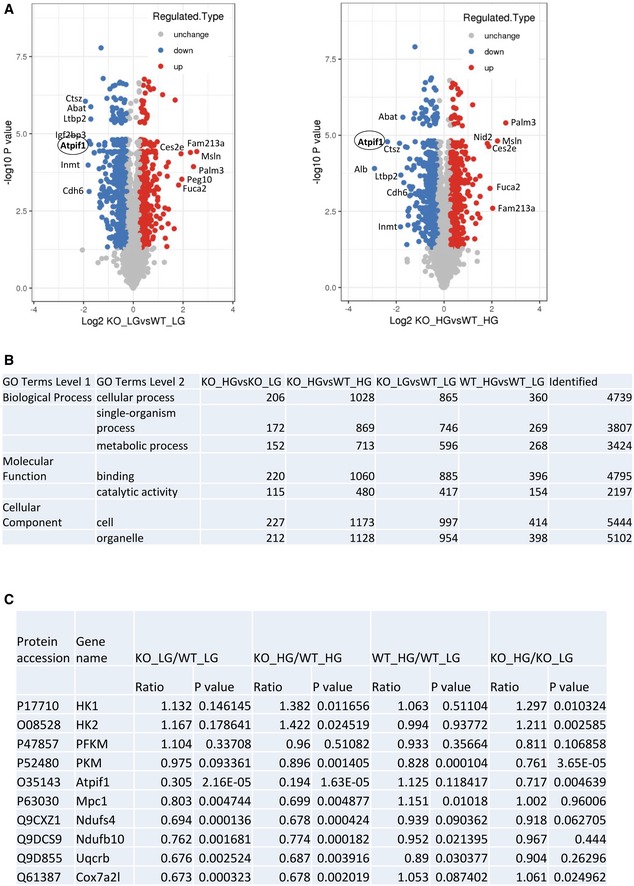
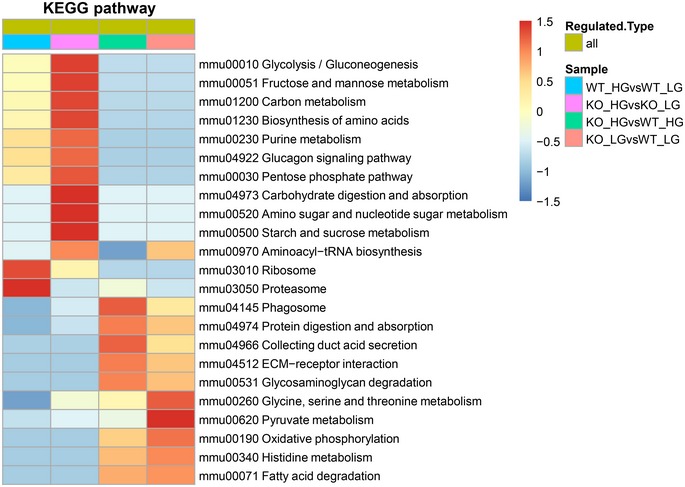
Smad4 deficiency increased OXPHOS activity in podocytes, but did not alter mitochondrial morphology (Fig 5E and F). To investigate molecular mechanism(s) by which Smad4 regulates mitochondrial OXPHOS activity, we performed mass spectrometry (MS)‐based quantitative proteomic analysis in mouse podocytes. First, we treated Smad4‐deficient and WT mouse podocytes with normal or high glucose. Then, the protein was digested, labelled with TMT reagents and analysed by MS for proteome quantification. We identified 5,228 protein groups in the four experimental groups with three biological replicates. We defined significantly different (P < 0.05 by two‐tailed t‐test) proteins and used a criterion of 1.3‐fold change or greater between two groups as differential protein candidates. Subsequently, the numbers of downregulated and upregulated proteins in the four groups were identified (Fig 7A). Bioinformatics enrichment analysis with gene ontology (GO) and Kyoto Encyclopedia of Genes and Genomes (KEGG) databases by the ClueGO tool 47 revealed that metabolic process, binding and catalytic activity are the most highly enriched pathways involving Smad4 (Figs 7B and EV5). MS revealed that Smad4 deficiency markedly reduces protein levels of ATPase Inhibitory Factor 1 (ATPIF1), the inhibitor of ATP synthase and the regulator of the activity of OXPHOS in mammalian tissues 48, 49, compared to WT podocytes under both normal and high glucose conditions (Fig 7C). MS also identified downregulation of mitochondrial pyruvate carrier 1 (MPC1), which controls the influx of pyruvate into mitochondria for OXPHOS, and proteins involved in the mitochondrial respiratory chain, such as Ndufs4, Ndufb10, Uqcrb, Cox7a21 and Cox5a (Fig 7C). The increase in ATP synthase activity caused by severe inhibition of ATPIF1 and the limitation of pyruvate influx into mitochondria attributable to downregulation of MPC1, prompted us to investigate whether Smad4 deficiency may increase mitochondrial OXPHOS efficiency and therefore decrease mitochondrial ROS production and ultimately contribute to the protection of Smad4‐deficient podocytes from high glucose‐induced injury.
Figure 7. Quantitative proteomic profiling for wild‐type (WT) and Smad4 knockout (KO) mouse podocytes under normal glucose (NG) or high glucose (HG) treatment.
-
AVolcano plot of the protein abundance changes in response to NG or HG in WT or Smad4 KO podocytes. Average protein expression ratio of three replicates (log 2 transformed) between KO+NG versus WT+NG and KO+HG versus WT+HG. Different treatment groups were plotted against P‐value by t‐test (−log 10 transformed). Cut‐off of P = 0.05 and 1.3‐fold change were marked by blue and red dots, respectively.
-
BFunctional annotation of altered proteome in four experimental groups. A GO analysis of the significantly changed proteins identified in proteomic analysis for biological process, molecular function and KEGG pathway.
-
CThe figure shows protein accession number, gene name, ratio and P value in four experiment groups in quantitative mass spectrometry.
Source data are available online for this figure.
Figure EV5. Encyclopedia of Genes and Genomes (KEGG) database annotates protein pathways in wild‐type or Smad4‐deficient podocytes treated with normal glucose (NG) or high glucose (HG).
Smad4 binds to ATPIF1 and reduces ATPIF1 degradation
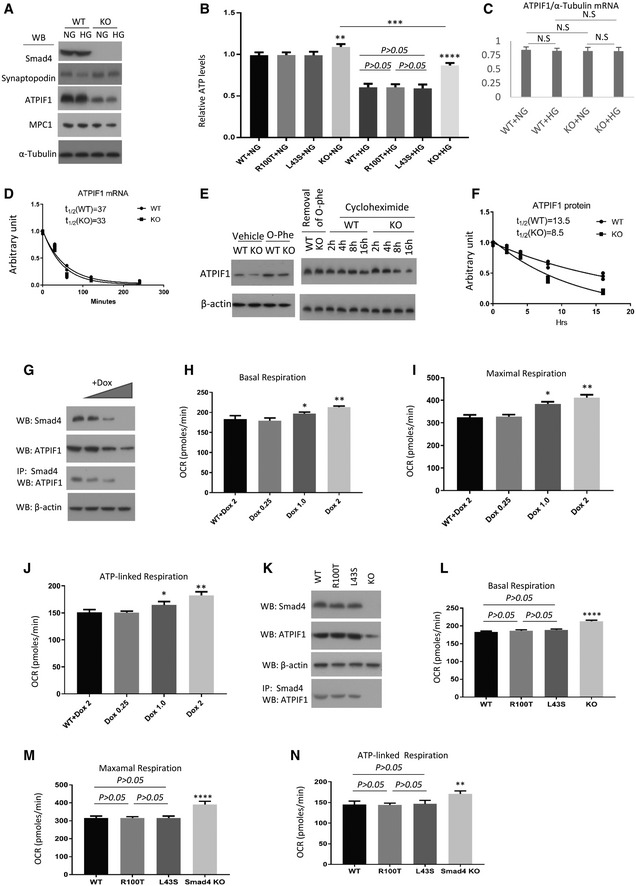
We investigated the mechanism by which Smad4 deficiency in podocytes caused downregulation of ATPIF1. Western blotting confirmed a significant reduction of ATPIF1 and MPC1 protein levels in Smad4‐deficient podocytes under both normal and high glucose conditions (Fig 8A). Smad4 deficiency significantly protected podocytes from high glucose‐induced loss of ATP production (Fig 8B), suggesting that Smad4 deficiency increases the activity of ATP synthase through downregulation of ATPIF1.
Figure 8. Smad4 interacts with ATPIF1 to regulate the activity of mitochondrial oxidative phosphorylation in mouse podocytes.
-
AWestern blotting (WB) demonstrated the expression levels of Smad4, synaptopodin, ATPIF1, MPC1 and α‐tubulin in Smad4‐deficient and wild‐type mouse podocytes under normal glucose (1 g/l d‐glucose, NG) or high glucose (4.5 g/l d‐glucose, HG) condition.
-
BRelative ATP levels in Smad4 WT, Smad4 R100T, Smad4 L43S or Smad4 KO podocytes treated with NG or HG for 24 h.
-
CRT–qPCR demonstrated relative mRNA levels of ATPIF1 in WT or Smad4 KO mouse podocytes treated with NG or HG for 24 h.
-
DDecay curves demonstrated ATPIF1 mRNA half‐life 30, 60, 120 and 240 min after wild‐type (WT) or Smad4 knockout (KO) mouse podocyte were treated with 5 µg/ml actinomycin‐D.
-
EWestern blotting demonstrated ATPIF1 expression levels in wild‐type or Smad4 KO mouse podocytes after treatment with 0.5 mM o‐phe for 1 h, or treatment with o‐phe then removal of o‐phe and treatment with 20 µg/ml cycloheximide for different periods of time as indicated.
-
FDecay curves demonstrated ATPIF1 protein half‐life after wild‐type (WT) or Smad4 knockout (KO) mouse podocyte were treated with 0.5 mM o‐phenanthroline (o‐phe) for 1 h then o‐phe was replaced with 20 µg/ml cycloheximide for different periods of time.
-
GDoxycycline (Dox) inducible sgRNA cassette/cas9 system to delete Smad4 gene was employed in mouse podocytes. WB and IP/WB demonstrated that expression of Smad4 and ATPIF1 and the interaction between Smad4 and ATPIF1 decrease following Dox treatment.
-
H–JSeahorse demonstrated oxygen consumption rate (OCR) in basal (H), maximal (I) and ATP‐linked respiration (J) in WT or Dox‐inducible sgRNA cassette/cas9 system in podocytes treated with different dosages of Dox.
-
K–NSmad4 KO podocytes were transduced with an empty retroviral vector, or retroviral vectors over‐expressing Smad4 WT, Smad4 R100T or Smad4 L43S. Western blotting demonstrated expression levels of Smad4, ATPIF1 and β‐actin (K). IP/WB demonstrated interaction between Smad4 and ATPIF1 in Smad4 WT, Smad4 R100T and Smad4 L43S podocytes (K). Seahorse demonstrated OCR in basal (L), maximal (M) and ATP‐linked respiration (N) in Smad4 WT, Smad4 R100T, Smad4 L43S or Smad4 KO podocytes.
To investigate how Smad4 deletion alters ATPIF1 expression, we examined both mRNA and protein stability. Smad4 deficiency did not change ATPIF1 mRNA levels in mouse podocytes (Fig 8C). Next, we analysed whether Smad4 affects ATPIF1 mRNA half‐life using actinomycin‐D to shut‐off transcription. Similar decay curves were seen for ATPIF1 mRNA in both Smad4‐deficient and wild‐type cells (Fig 8D), suggesting that Smad4 regulates ATPIF1 at the posttranscriptional level. We examined ATPIF1 protein stability in mouse podocytes finding a very rapid accumulation of ATPIF1 protein in response to o‐phenanthroline (O‐Phe), an inhibitor of mitochondrial proteases (Fig 8E) 49. After removal of O‐phe and addition of cycloheximide to stop de novo protein synthesis, cells were followed for varying periods of time. Western blot decay curves demonstrated that Smad4 deficiency decreased the half‐life of ATPIF1 protein (Fig 8E and F). Immunoprecipitation showed an interaction between Smad4 and ATPIF1 which was increased in podocytes isolated from type 2 DN compared to age‐matched mouse kidneys (Fig 6C and D).
To investigate whether Smad4 is required for ATPIF1 protein stability, we employed titratable, doxycycline (dox)‐inducible sgRNA cassette/cas9 system to delete the Smad4 gene in a mouse podocyte cell line. Immunoprecipitation studies showed a dose‐dependent knockdown of Smad4 with increasing dox concentration. This caused a reduction in ATPIF1 protein levels in association with a reduction in Smad4 binding to ATPIF1 (Fig 8G), suggesting that the interaction of Smad4 with ATPIF1 may protect ATPIF1 from degradation. Seahorse analysis demonstrated a dose‐dependent increase in basal respiration, maximal respiration and ATP‐linked respiration with downregulation of Smad4 and ATPIF1 (Fig 8H–J), suggesting that Smad4 regulates mitochondrial OXPHOS activity through ATPIF1. To demonstrate that this effect was independent of Smad4 nuclear localization, we used retroviral‐mediated Smad4WT, Smad4R100T and Smad4L43S expression in Smad4‐deficient podocytes as previously above. Immunoprecipitation studies showed that the Smad4R100T/ATPIF1 and Smad4L43S/ATPIF1 interactions are comparable to the Smad4WT/ATPIF1 interaction (Fig 8K). There is no significant difference in basal, maximal and ATP‐linked respiration, proton leak, or ATP levels between podocytes expressing Smad4WT, Smad4R100T or Smad4L43S (Fig 8L–N). Taken together, our data suggest that Smad4 may interact with ATPIF1 to modulate OXPHOS activity. The decreased expression level of MPC1 (Fig 8A) further suggests that Smad4 deficiency may increase OXPHOS efficiency through limitation of pyruvate influx into mitochondria and augmentation of OXPHOS activity in mouse podocytes.
Discussion
The present study demonstrates that Smad4 deficiency protects podocytes from high glucose‐induced injury through enhanced glycolysis and maintenance of mitochondrial OXPHOS, which consequently decreases NOX4 expression and ROS production. This is attributed to a non‐canonical action of Smad4 in regulating glycolysis and OXPHOS via direct interactions with the rate‐limiting glycolytic enzyme, PKM2, and with ATPIF1. Conditional Smad4 deletion in podocytes protects against the development of DN, while Smad4 LNA halted the progression of established DN, identifying Smad4 as a therapeutic target in DN.
Podocyte foot processes form slit diaphragms which are part of the glomerular filtration barrier that limits albumin filtration into the urinary space. Movement of foot processes in response to environmental changes requires the redistribution of actin filaments which is dependent upon phosphorylation‐mediated signalling. This requires high levels of ATP to maintain normal podocyte structure and function 41, 50. Mitochondria and glycolysis maintain energy homeostasis in podocytes 41, 51, with glycolysis responsible for the intracellular ATP distribution in the cortical area of podocytes 41. Mitochondrial dysfunction with insufficient ATP production may contribute to the development of DN 52, 53, 54. We identified direct interactions between Smad4 and PKM2 and ATPIF1: key enzymes in glycolysis and OXPHOS. These interactions were associated with reduced glycolysis and lactate production in podocytes under high glucose conditions, indicating that podocyte glycolysis is diminished in DN. The enhancement of glycolysis in Smad4‐deficient podocytes may compensate for the loss of ATP due to mitochondrial injury, thus preventing podocyte damage and podocyte loss in the diabetic milieu.
The mitochondrial H+‐ATP synthase is the master of OXPHOS that catalyses the synthesis of ATP using the proton gradient generated by the respiratory chain 55. ATPIF1 is the biological inhibitor of the H+‐ATP synthase 56, 57. Overexpression of ATPIF1 leads to the inhibition of the ATP synthesis and the switch to an increased aerobic glycolysis in cancer cells 58. By contrast, inhibition of ATPIF1 can ameliorate severe electron transport chain dysfunction due to reversal of the F1‐F0 ATP synthase, thus maintaining mitochondrial membrane potential 59. In our study, Smad4 deficiency increased pyruvate production through enhancement of glycolysis, but the reduction of MPC1 decreases the pyruvate influx into mitochondria for OXPHOS, thus reducing the ROS production. On the other hand, the reduced levels of ATPIF1 seen with Smad4 deletion increased activity of the H+‐ATP synthase, resulting in the augmentation of OXPHOS efficiency and an increase in ATP production. Thus, Smad4 deficiency protects podocytes from high glucose‐induced injury through this fine tuning of mitochondrial activity by positive and negative regulators.
Hyperglycaemia plays an essential role in the pathogenesis of DN. Increased intracellular glucose results in accumulation of toxic glucose metabolites which exacerbates the development of DN 60, 61. Podocyte injury and loss are early pathological changes in the pathogenesis of DN 62, 63. Qi et al 64 found that enzymes in the glycolytic and mitochondrial pathways are increased in individuals with long duration of diabetes but are protected from DN. They further demonstrated that TEPP‐46, a PKM2 activator, protected mice against DN by increasing glucose metabolic flux, inhibiting the production of toxic glucose metabolites and inducing mitochondrial biogenesis to restore mitochondrial function. We showed that Smad4 deficiency in podocytes enhances glycolysis and lactate production, decreases NOX4 expression and ROS production and protects against high glucose‐induced injury in vitro. Importantly, mice with Smad4 deletion in podocytes exhibited significant protection against podocyte damage and the development of glomerulosclerosis, albuminuria and impaired renal function despite unaltered obesity and diabetes. These in vivo findings further support the hypothesis that an increase in glycolysis and lactic acid production may decrease intracellular free glucose and toxic glucose metabolites, thus reducing high glucose‐induced injury and providing salutary effects in DN.
In canonical TGF‐β/Smad signalling, Smad4 enters the nucleus as part of a complex with phosphorylated Smad2 and Smad3 which binds to promoter regions of target genes to regulate transcription 4. However, recent studies demonstrate that Smad4 may directly translocate to mitochondria and interact with the mitochondrial protein cytochrome c oxidase II to promote apoptosis 65. CHCHD2, a mitochondrial protein, interacts with Smad4 to repress TGF‐β signalling in human‐induced pluripotent stem cells 66. Our study demonstrated that Smad4 expression is increased in the podocyte cytoplasm in both human and mouse DN. The interactions between Smad4 and the rate‐limiting glycolytic enzyme PKM2, and between Smad4 and ATPIF1, were increased in mice with DN. The interaction between Smad4 and PKM2 reduced the tetramer form of PKM2 and PKM2 activity, thus reducing glycolysis and lactate production under high glucose conditions in podocytes. The Smad4/ATPIF1 interaction protects ATPIF1 from degradation. Notably, using Smad4 R100T and L43S mutations, we identified that nuclear localization was not required for Smad4 interactions with PKM2 and ATPIF1 in mitochondria, or for Smad4 modulation of glycolysis and ATP production. Thus, cytoplasmic Smad4 regulates glycolysis and OXPHOS via a novel, non‐canonical pathway.
LNA technology is currently being used in clinical trials 67. The substantial renal accumulation of LNA at pharmacologically active levels makes it a feasible strategy for the treatment of kidney disease 37, 38. Delivery of the Smad4 LNA reagent significantly decreased Smad4 expression in kidneys, but not in the liver, spleen or lung. This selective effect upon the kidney in experimental DN was supported by the lack of effect of Smad4 LNA on body weight, hyperglycaemia, hyperinsulinaemia and impaired glucose tolerance. While the findings of Smad4 LNA treatment are consistent with the protective effects of Smad4 deletion in podocytes, clearly the beneficial effects of this treatment could also involve actions on other cell types.
There are a number of limitations in these studies. The overall effects of Smad4 deletion in podocytes reported here may not be solely attributed to the changes observed in glycolysis and mitochondrial OXPHOS. It is feasible that other mechanisms such as fatty acid oxidation may have influenced the overall phenotype in Smad4‐deficient podocytes. In addition, Smad4 shuttles to the nucleus as a transcription factor to regulate gene transcription which could also have contributed to the effects seen with Smad4 deletion 46. How signalling pathway(s) induce interactions between Smad4 and rate‐limiting glycolytic enzymes PKM2 and ATPIF1 were not investigated. Finally, mitochondrial measures such as citrate synthase activity were outside of the scope of this manuscript but certainly warrant further investigation.
In conclusion, these results provide new insights into the role of Smad4 in the pathogenesis of diabetic nephropathy. Specifically, we describe a previously unrecognized action of cytoplasmic Smad4 in the regulation of glycolysis and OXPHOS. These observations suggest that pharmacological approaches to inhibit Smad4 activity in the kidney could represent a therapeutic strategy for the treatment of type 2 DN.
Materials and Methods
Experimental animals and diets
Breeding pairs of eNOS −/− mice, Smad4fl/fl mice, tamoxifen‐inducible Tg(CAG‐cre/Esr1)5Amc/J mice (ER‐Cre) and 2.5P‐Cre; Tg(NPHS2‐cre)1Lbh mice were purchased from Jackson Laboratories (Bar Harbor, ME) and maintained at Monash Animal Services. Mice were fed a ND or a HFD (Specialty Feeds, Glen Forrest, WA, Australia) for 8 weeks first, followed by a single low dose of STZ injection (Sigma, St Louis, MO) and continued with HFD treatment for another 16 weeks. ND provided 1.68 MJ/kg of energy from lipid (20% protein and 4.8% total fat). HFD provided 8.17 MJ/kg of energy from lipid (22.6% protein and 23.5% total fat). In all experimental procedures, mice were housed in a controlled environment and food and water were available ad libitum. Body weights were measured weekly. To delete Smad4 gene, tamoxifen (20 mg/kg) was given to eNOS −/− :ErCre‐Smad4 fl/fl mice through intraperitoneal injection for 5 days consecutively. All experiments were approved by the Monash University Animal Ethics Committee and adhered to the Australian Code of Practice for the Care and Use of Animals for Scientific Purposes.
Human renal biopsy specimens
Studies using human tissue were approved by the Human Ethics Committee of Monash Medical Centre, and written informed consent was obtained from the patients. Paraffin sections of renal biopsies, excess to that required for diagnosis, were examined in four cases of diabetic nephropathy. Normal kidney tissue was obtained from the noninvolved pole of nephrectomies performed as the result of renal carcinoma.
LNA intervention study
Smad4 LNA and CTL LNA were designed by and purchased from Exiqon, Denmark. Smad4 LNA: 5′‐TTGATGCGCGATTACT‐3′; negative control‐LNA (CTL LNA): 5′‐AACACGTCTATACGC‐3′. Smad4 LNA potency was confirmed in cultured differentiated podocytes and 8‐week‐old normal adult C57BL/6 J mice. Smad4 LNA and CTL LNA were dissolved in 1X PBS and directly added to cultured podocytes at final concentration of 1, 5 and 10 μM, respectively. Cultured medium were changed, and Smad4 LNA or CTL LNA was added every day. Cells were harvested for protein analysis 4 days after the initial treatment. A preliminary experiment was performed to determine the effective dose range of Smad4 LNA in type 2 DN. A dose curve of Smad4 LNA or CTL LNA ranging from 5 to 20 mg/kg was administered to normal 8‐week‐old C57BL/6J mice (seven groups/n = 2 mice each). Mice were killed after Smad4 LNA or CTL LNA administration; kidney tissues were collected to detect expression levels of Smad4 by Western blotting. Based on the results from this study, 10 mg/kg Smad4 LNA or CTL LNA dissolved in 1× PBS was intraperitoneally injected into eNOS‐deficient type 2 DN mice once a week for 6 weeks. Mice were killed. Blood, urine, organs/tissues were collected for further analysis. No obvious side effects were observed during the experiments and in the organs/tissues examined.
Lactate levels in cell culture supernatant
The concentration of lactate in podocytes, the end product of glycolysis, was determined using the lactate colorimetric assay kit (Abcam, Cambridge, United Kingdom). The OD was measured at 450 nm and the standard curve plot (nmol/well versus OD 450 nm) was then generated. Finally, the lactate concentrations were determined as follows: C = La/106 cells in a period time (M/106 cells).
Microalbuminuria, serum cystatin C and HbA1c
Twenty‐four‐hour urine samples were collected each week after the beginning of HFD treatment. Microalbumin and urinary creatinine levels were measured with Albumin Mouse ELISA Kit (Abcam, Cambridge, MA) and Creatinine Assay Kit (Cayman Chemical, Ann Abor, MI), according to instructions supplied. Results are expressed as the urine microalbumin‐to‐creatinine ratio (μg/mg). The concentration of cystatin C in serum was determined using the mouse DuoSet ELISA kit (R&D Systems) according to the manufacturer's instructions. The percentage of serum HbA1c level was determined by A1CNow® (BHR Pharmaceuticals, UK) according to the manufacturer's instructions.
Glucose tolerance test
For glucose tolerance test, after 6‐h fasting, blood glucose was measured using a glucometer (Accu‐chek; Roche Diagnostic Corporation, Indianapolis, IN) at 0, 15, 30, 60 and 120 min after an intraperitoneal injection of glucose (1 mg/g).
Histological assessment and confocal microscopy
A coronal slice of kidney tissue was fixed in 4% paraformaldehyde and embedded in paraffin. Tissue was cut at 4 μm and stained with haematoxylin, PAS and Masson's trichrome. The degree of glomerulosclerosis and interstitial fibrosis were measured using ImageJ software (http://rsb.info.nih.gov/ij/). The percentage of glomerulosclerosis was calculated by dividing the total area of PAS‐positive staining in the glomerulus by the total area of the glomerulus. The following antibodies were used: rabbit anti‐Tom20 conjugated with Alexa Fluor 647 (Abcam, UK, Cat. No.ab209606), guinea pig anti‐synaptopodin antibody (Synaptic Systems, GmbH, Goettingen, Germany, Cat. No.163004), followed by goat anti‐guinea pig Alexa Fluor 488 (Invitrogen, Mount Waverley, VIC, Australia, Cat. No. A18777) and goat anti‐collagen IV (Southern Biotech, Birmingham, AL, Cat. No. 1340‐01) or rabbit anti‐fibronectin (Abcam, Cat. No. ab23751), followed by donkey anti‐goat Alexa Fluor 488 (Invitrogen, Cat. No.A11055) or goat anti‐rabbit Alexa Fluor 488 (Invitrogen, Cat. No. A11008). Sections were counterstained with DAPI (4, 6‐diamidino‐2‐phenylindole; Sigma‐Aldrich, St Louis, MO) to visualize nuclei. Sections were analysed with an Olympus Fluoview 1000 confocal microscope (Olympus, Tokyo, Japan), FV10‐ASW software (version 1.3c; Olympus) and oil UPLFL × 60 objective (NA 1.25; Olympus). ImageJ (http://rsb.info.nih.gov/ij/) measured the area of staining within the glomerulus tuft. All scoring was performed on blinded slides.
Immunoprecipitation and Western blotting
Kidney tissues, cell culture samples and isolated cells from FACS were sonicated and lysed in 0.4 ml RIPA lysis buffer. The tissue and cell extracts were centrifuged at 875 g at 4°C for 30 min to remove cell debris. The protein concentrations were measured by modified Lowry protein assay using BSA as a protein standard (DC protein assay kit, Bio‐Rad). Cell lysates (1 mg) were added rabbit anti‐Smad4 (Cell Signal Technology, Cat. No. 46535), mouse (Cell Signal Technology, Cat. No. 5415) or rabbit control IgG (Cell Signaling Technology, Cat. No. 3900) with gentle rocking overnight at 4°C then immune complex was immunoprecipitated using protein A/G agarose beads (Santa Cruz Biotechnology). In Western blotting, proteins were electrophoresed through a 10% SDS–PAGE before transferring to A PVDF membrane. After blocking for 30 min at 4°C in blocking buffer (5% skim milk powder in PBS with 0.1% Tween‐20), the membrane was incubated overnight with rabbit anti‐synaptopodin (Synaptic Systems, Cat. No. 163002), anti‐nephrin (Abcam, Cat. No. ab58968), anti‐PKM2 (Cell Signal Technology, Cat. No. 4053), anti‐ATPIF1 (Abcam, Cat. No. ab110277), MPC‐1 (Cell Signal Technology, Cat. No.14462) or anti‐Smad4 (Cell Signal Technology, Cat. No. 46535). The membrane was washed and incubated for 30 min at room temperature with a goat anti‐rabbit (Sigma‐Aldrich, Cat. No. 12348) or anti‐mouse antibody conjugated with HRP (Sigma‐Aldrich, Cat. No. 12349). After further washing, the membrane was detected with ECL kit (Amersham Pharmacia Biotech, Arlington, IL, USA). α‐Tubulin and GAPDH were used as internal controls and detected by mouse anti‐α‐tubulin antibody conjugated with HRP (Cell Signal Technology, Cat. No. 9099) and mouse anti‐GAPDH antibody conjugated with HRP (Cell Signal Technology, Cat. No. 51332).
Isolation of podocytes from mouse kidneys
Kidney tissue from WT or Smad4 −/− mouse kidneys was digested with collagenase (Sigma). Single‐cell suspensions were sequentially labelled with rabbit anti‐nephrin conjugated with Alexa Fluor 488 fluorophore (Bioss‐USA, Woburn, MA, Cat. No. bs‐10233R‐A488). Renal nephrin+ cells were sorted using BD influx (BD Biosciences) 14. A total of 8 × 10⁵ to 1.5 × 10⁶ cells/each type were harvested per kidney and analysis with qPCR, Western blotting and Seahorse assay.
Lentiviral CRISPR/Cas9 constructs
For the inducible Smad4 sgRNA constructs, the previously described FgH1tUTG plasmid (A gift from Dr Marco Herold, Walter and Eliza Hall Institute of Medical Research, Australia) was modified to contain the Smad4 sgRNA (Smad4 exon 4 5′ AAACAGGTCAGCCGGCCAGTATTC3′ and 5′ TCCCGAATACTGGCCGGCTGACCT3′) cassette, which was inserted into bidirectional Bsmb1 sites linked to the GFP fluorescent protein 68. The constitutive Cas9 expression vectors were derived from the pFUGW, Cas9 protein linked via the T2A peptide to the mCherry fluorescent reporter protein 69.
Smad4 expression retroviral vector constructs
The plasmids encoding Flag‐Smad4WT, Flag‐Smad4L43S and Flag‐Smad4R100T were obtained from the Addgene plasmid repository (Addgene Plasmid #80888. #80889 and #80891 were gifts from Aristidis Moustakas) 44. Retroviral vector plasmid encoding Flag‐Smad4WT, Flag‐Smad4L43S and Flag‐Smad4R100T were subcloned into pMSCV‐IRES‐Puro vector.
Virus Production and Transduction of Podocytes
Viral particles were produced by transient transfection of 293T cells grown in 75‐cm culture flask with 10 μg of vector DNA along with the packaging constructs pLP1 (5 μg), pLP2 (2.5 μg) and pLP/VSVG (3 μg) (Thermo Fisher) for lentivirus, or Platinum‐E packaging cells with 10 μg of vector DNA for retrovirus, using standard calcium phosphate precipitation method. Virus‐containing supernatants were collected at 48 h after transfection and passed through a 0.45‐μm filter. Virus was concentrated by precipitation using PEG‐6000 70. For transduction of podocytes, cells were plated with virus and polybrene (4 μg/ml) and incubated overnight at 33°C. Lentivirus‐transduced cells were sorted using BD FACSAria™ III by sorting double‐positive (GFP+/mCherry+) cells. To induce Smad4 sgRNA expression, doxycycline hyclate (Sigma) was dissolved in sterile water at a stock concentration of 10 mg/ml and added to cell culture medium for a final concentration of 1 μg/ml for 24 h. Retrovirus‐transduced cells were selected with 0.6 μg/ml of puromycin in culture media.
Seahorse assay
A Seahorse Bioscience XFe24 Extracellular Flux Analyzer (Seahorse Bioscience, Billerica, MA) was used to measure oxygen consumption rates in real time from podocytes cultured in XFe24 FluxPak Mini cell culture microplates (Seahorse Bioscience) coated with rat tail collagen I (Sigma).
Isolated mouse podocytes or mouse podocyte cell line (A gift from Professor Jeffrey B. Kopp, NIH, Bethesda, MD) were seeded in XFe24 FluxPak Mini cell culture microplates at a density of 5 × 10⁵ in 300 μl of growth media and differentiated for 7 days. After incubation for a total of 7 days, growth medium was removed and replaced with 500 μl of FAO assay medium prewarmed to 37°C, supplemented with or without Etomoxir (1 μM), cultured at 37°C anaerobic incubator. Measurements of oxygen consumption rates were performed after equilibration in assay medium for 0.5 to 1 h. XF Cell Mito Stress Test Kit (Seahorse Bioscience) was used to measure oxygen consumption rates according to the instructions supplied.
Conventional EM sample preparation
Cultured cells were fixed according to standard procedures in 2% glutaraldehyde in sodium cacodylate buffer. Post‐fixed with 1% OsO4, 1.5% K3Fe(III)(CN)6. Cells were scraped, pelleted and embedded in 4% ULMP‐agarose. Dehydration was done with ethanol, and cells were embedded in Epon 812. Ultrathin sections of 70 nm were cut on a Leica Ultracut UCT7 and stained with uranyl acetate and lead citrate. EM imaging was done on a Hitachi 7500 TEM.
Measurement of intracellular ROS accumulation
CellROX Deep Red Reagent was from Invitrogen (Carlsbad, CA). Podocytes were treated with normal glucose (1 g/l d‐glucose) or high glucose (4.5 g/l d‐glucose) the indicated time intervals, and CellROX Deep Red Reagent was added at a final concentration of 5 μM to the cells and then incubated for 30 min at 37°C. Subsequently, medium was removed, and the cells were washed three times with PBS. The resulting fluorescence was measured using a fluorescence microscope (Axiovert 200M; Zeiss).
SBE4‐luciferase reporter assay
One day after SBE4‐luciferase plasmid was transfected into Smad4 −/− podocytes expressing Flag‐tagged Smad4 wild type, Smad4 R100T or Smad4 L43S mutant by Lipofectamine 2000, cells were treated with or without 2 ng/ml TGF‐β1 for 8 h. Then, cells were harvested and luciferase assay was performed according to the instruction in luciferase assay kit (Promega).
RNA Extraction and Real‐time RT–qPCR
Total RNA from cultured podocyte samples were isolated and one‐step real‐time RT–PCR and real‐time qPCR performed using SYBR Green PCR Reagents (Sigma), the Thermoscript RT–PCR system (Invitrogen) and the Opticon DNA Engine (MJ Research Inc., South San Francisco, CA), according to manufacturer's instructions. In each reaction, 0.5 μg of total RNA was reverse‐transcribed before the following PCR conditions: 94°C for 2 min followed by 40 cycles at 94°C for 15 s, 58°C for 30 s, 72°C for 30 s, with final extension at 72°C for 10 min. Primers used in this study were as follows: mouse NOX4, fwd 5′‐cctcctggctgcattagtct‐3′, rev 5′‐ctccgcacaataaaggcaca‐3′; collagen IV, fwd 5′‐TGACCCTGGTGATGTTCTCA‐3′, rev 5′‐GCCACACCTTGTATGCCTTT; and β‐actin, fwd 5′‐agacttcgagcaggagatgg ‐3′, rev 5′‐caatgcctgggtacatggtg‐3′. Amplicon sizes were 225 bp (NOX4) and 266 bp (β‐actin). The relative amount of mRNA was calculated using the comparative Ct (ΔCt) method compared with β‐actin and expressed as the mean ± SD.
Cross‐linking to determine tetramers, dimers and monomers of PKM2
Isolated cells by FACS or cultured cells were treated with 500‐μM DSS (disuccinimidyl suberate; Thermo Scientific #PI21658), as per the manufacturer's instructions, to cross‐link at room temperature 64. Cell number was counted. Equal numbers of cells were lysed in 4× Bolt LDS Sample Buffer (Invitrogen), boiled for 5 min then Western blotting was performed.
Effect of Smad4 deficiency on ATPIF1 mRNA stability
Wild‐type or Smad4‐deficient mouse podocytes were cultured 24 h to normalize PKM2 mRNA expression. Thereafter, 1,640 medium was changed and cells were treated with actinomycin‐D (5 μg/ml) for 1 h and subsequently incubated with 1,640 medium for further 30, 60, 120 and 240 min. Cells were collected, and RT–qPCR was performed to quantify ATPIF1 mRNA levels. The following forward (F) and reverse (R) primers were used to amplify mouse ATPIF1 cDNA and β‐actin cDNA, respectively. ATPIF1_F: 5′ggttcggtgtctggggtatg, mouse ATPIF1_R: 5′ tcatggtgtttcctcagggc, amplicon = 193 bp; mouse β‐actin_F: 5′ ccaccatgtacccaggcatt, mouse β‐actin_R: 5′ actcctgcttgctgatccac, amplicon = 177 bp.
Quantitative proteomic analysis
The quantitative proteomic analysis was performed according to following procedures: (i) protein extraction; (ii) trypsin digestion; (iii) TMT/iTRAQ labelling; (iv) HPLC fractionation; (v) LC‐MS/MS analysis; (vi) database search; and (vii) bioinformatics methods: Gene Ontology (GO) annotation proteome was derived from the UniProt‐GOA database (www. http://www.ebi.ac.uk/GOA/). Encyclopedia of Genes and Genomes (KEGG) database was used to annotate protein pathway.
Statistical analysis
Data are mean ± SD with statistical analyses performed using unpaired t‐test, nonlinear regression, one‐phase exponential decay, one‐way or two‐way ANOVA from GraphPad Prism 7.0 (GraphPad Software, San Diego, CA) and post hoc Tukey analysis when appropriate. P < 0.05 was considered statistically significant.
Author contributions
Conceived and designed the experiments: JL. Performed the experiments: JL, YBYS, WYC, JF, SL, XQ and SC. Analysed the data: JL, YS, WYC, JF, SL, XQ, QC, RC, DZ, JZ, ZW, HC, SC, VO, VGP, PGK, YR, SKN, MC, HT, WC, JFB, DJN‐P and XY. Contributed reagents/materials/analysis tools: JL. Wrote the paper: JL, YBYS, WYC, JFB, DNP and XY.
Conflict of interest
The authors declare that they have no conflict of interest.
Supporting information
Expanded View Figures PDF
Review Process File
Source Data for Figure 7
Acknowledgements
This study was supported by the National Health and Medical Research Council of Australia (APP1057581), the National Natural Science Foundation of China (81670667), and Guangdong Medical University of Provincial and Municipal Construction of Colleges and Universities Project (NO. 4SG18001Ga) to J.L; the Major Basic Research Project of Guangdong Province, China (NO. 2017KZDXM041), Guangdong Provincial University Key Platform Featured Innovation Project (Natural Sciences) (NO. 2015KTSCX052), Guangdong Medical University of Provincial and Municipal Construction of Colleges and Universities Project (NO. 4SG18102G and 4SG18056G) and Provincial Preponderant Key Subjects of Public Health and Preventive Medicine Project (NO. 4SG18004G and 4SG17043) to H.T.
EMBO Reports (2020) 21: e48781
Contributor Information
Jinhua Li, Email: jinhua.li@monash.edu.
Xueqing Yu, Email: yuxq@mail.sysu.edu.cn.
References
- 1. National Kidney Foundation (2012) KDOQI clinical practice guideline for diabetes and CKD: 2012 update. Am J Kidney Dis 60: 850–886 [DOI] [PubMed] [Google Scholar]
- 2. Action to Control Cardiovascular Risk in Diabetes Study Group , Gerstein HC, Miller ME, Byington RP, Goff DC Jr, Bigger JT, Buse JB, Cushman WC, Genuth S, Ismail‐Beigi F et al (2008) Effects of intensive glucose lowering in type 2 diabetes. N Engl J Med 358: 2545–2559. [DOI] [PMC free article] [PubMed] [Google Scholar]
- 3. Parving HH, Brenner BM, McMurray JJ, de Zeeuw D, Haffner SM, Solomon SD, Chaturvedi N, Persson F, Desai AS, Nicolaides M et al (2012) Cardiorenal end points in a trial of aliskiren for type 2 diabetes. N Engl J Med 367: 2204–2213 [DOI] [PubMed] [Google Scholar]
- 4. Kretzschmar M, Massagué J (1998) SMADs: mediators and regulators of TGF‐beta signaling. Curr Opin Genet Dev 8: 103–111 [DOI] [PubMed] [Google Scholar]
- 5. Yamamoto T, Nakamura T, Noble NA, Ruoslahti E, Border WA (1993) Expression of transforming growth factor beta is elevated in human and experimental diabetic nephropathy. Proc Natl Acad Sci USA 90: 1814–1818 [DOI] [PMC free article] [PubMed] [Google Scholar]
- 6. Shull MM, Ormsby I, Kier AB, Pawlowski S, Diebold RJ, Yin M, Allen R, Sidman C, Proetzel G, Calvin D et al (1992) Targeted disruption of the mouse transforming growth factor‐beta 1 gene results in multifocal inflammatory disease. Nature 359: 693–699 [DOI] [PMC free article] [PubMed] [Google Scholar]
- 7. Liu Y, Zhang P, Li J, Kulkarni AB, Perruche S, Chen W (2008) A critical function for TGF‐beta signaling in the development of natural CD4+CD25+Foxp3+ regulatory T cells. Nat Immunol 9: 632–640 [DOI] [PubMed] [Google Scholar]
- 8. Gorelik L, Flavell RA (2000) Abrogation of TGFbeta signaling in T cells leads to spontaneous T cell differentiation and autoimmune disease. Immunity 12: 171–181 [DOI] [PubMed] [Google Scholar]
- 9. Zhu Y, Richardson JA, Parada LF, Graff JM (1998) Smad3 mutant mice develop metastatic colorectal cancer. Cell 94: 703–714 [DOI] [PubMed] [Google Scholar]
- 10. Flanders KC (2004) Smad3 as a mediator of the fibrotic response. Int J Exp Pathol 85: 47–64 [DOI] [PMC free article] [PubMed] [Google Scholar]
- 11. Fujimoto M, Maezawa Y, Yokote K, Joh K, Kobayashi K, Kawamura H, Nishimura M, Roberts AB, Saito Y, Mori S (2003) Mice lacking Smad3 are protected against streptozotocin‐induced diabetic glomerulopathy. Biochem Biophys Res Commun 305: 1002–1007 [DOI] [PubMed] [Google Scholar]
- 12. Yadav H, Quijano C, Kamaraju AK, Gavrilova O, Malek R, Chen W, Zerfas P, Zhigang D, Wright EC, Stuelten C et al (2011) Protection from obesity and diabetes by blockade of TGF‐β/Smad3 signaling. Cell Metab 14: 67–79 [DOI] [PMC free article] [PubMed] [Google Scholar]
- 13. Tan CK, Leuenberger N, Tan MJ, Yan YW, Chen Y, Kambadur R, Wahli W, Tan NS et al (2011) Smad3 deficiency in mice protects against insulin resistance and obesity induced by a high‐fat diet. Diabetes 60: 464–476 [DOI] [PMC free article] [PubMed] [Google Scholar]
- 14. Sun YB, Qu X, Howard V, Dai L, Jiang X, Ren Y, Fu P, Puelles VG, Nikolic‐Paterson DJ, Caruana G et al (2015) Smad3 deficiency protects mice from obesity‐induced podocyte injury that precedes insulin resistance. Kidney Int 88: 286–298 [DOI] [PubMed] [Google Scholar]
- 15. Li HY, Oh YS, Lee YJ, Lee EK, Jung HS, Jun HS (2015) Amelioration of high fat diet‐induced glucose intolerance by blockade of Smad4 in pancreatic beta‐cells. Exp Clin Endocrinol Diabetes 123: 221–226 [DOI] [PubMed] [Google Scholar]
- 16. Schiffer M, Bitzer M, Roberts IS, Kopp JB, ten Dijke P, Mundel P, Böttinger EP (2001) Apoptosis in podocytes induced by TGF‐beta and Smad7. J Clin Invest 108: 807–816 [DOI] [PMC free article] [PubMed] [Google Scholar]
- 17. Zhao J, Miyamoto S, You YH, Sharma K (2015) AMP‐activated protein kinase (AMPK) activation inhibits nuclear translocation of Smad4 in mesangial cells and diabetic kidneys. AJP Renal Physiol 308: F1167–F1177 [DOI] [PMC free article] [PubMed] [Google Scholar]
- 18. Papageorgis P, Cheng K, Ozturk S, Gong Y, Lambert AW, Abdolmaleky HM, Zhou JR, Thiagalingam S (2011) Smad4 inactivation promotes malignancy and drug resistance of colon cancer. Cancer Res 71: 998–1008 [DOI] [PMC free article] [PubMed] [Google Scholar]
- 19. Sauvé M, Hui SK, Dinh DD, Foltz WD, Momen A, Nedospasov SA, Offermanns S, Husain M, Kroetsch JT, Lidington D et al (2016) Tumor necrosis factor/sphingosine‐1‐phosphate signaling augments resistance artery myogenic tone in diabetes. Diabetes 65: 1916–1928 [DOI] [PubMed] [Google Scholar]
- 20. Gu J, Cheng Y, Wu H, Kong L, Wang S, Xu Z, Zhang Z, Tan Y, Keller BB, Zhou H et al (2017) Metallothionein is downstream of Nrf2 and partially mediates sulforaphane prevention of diabetic cardiomyopathy. Diabetes 66: 529–542 [DOI] [PMC free article] [PubMed] [Google Scholar]
- 21. Cheng Y, Yu X, Zhang J, Chang Y, Xue M, Li X, Lu Y, Li T, Meng Z, Su L et al (2019) Pancreatic kallikrein protects against diabetic retinopathy in KK Cg‐Ay/J and high‐fat diet/streptozotocin‐induced mouse models of type 2 diabetes. Diabetologia 62: 1074–1086 [DOI] [PMC free article] [PubMed] [Google Scholar]
- 22. Chen X, Han Y, Gao P, Yang M, Xiao L, Xiong X, Zhao H, Tang C, Chen G, Zhu X et al (2019) Disulfide‐bond A oxidoreductase‐like protein protects against ectopic fat deposition and lipid‐related kidney damage in diabetic nephropathy. Kidney Int 95: 880–895 [DOI] [PubMed] [Google Scholar]
- 23. Wu L, Wang K, Wang W, Wen Z, Wang P, Liu L, Wang DW (2018) Glucagon‐like peptide‐1 ameliorates cardiac lipotoxicity in diabetic cardiomyopathy via the PPARα pathway. Aging Cell 17: e12763 [DOI] [PMC free article] [PubMed] [Google Scholar]
- 24. Spallotta F, Cencioni C, Atlante S, Garella D, Cocco M, Mori M, Mastrocola R, Kuenne C, Guenther S, Nanni S et al (2018) Stable oxidative cytosine modifications accumulate in cardiac mesenchymal cells from type 2 diabetes patients: rescue by α‐Ketoglutarate and TET‐TDG functional reactivation. Circ Res 122: 31–46 [DOI] [PubMed] [Google Scholar]
- 25. Yu T, Sungelo MJ, Goldberg IJ, Wang H, Eckel RH (2017) Streptozotocin‐treated high fat fed mice: a new type 2 diabetes model used to study canagliflozin‐induced alterations in lipids and lipoproteins. Horm Metab Res 49: 400–406 [DOI] [PubMed] [Google Scholar]
- 26. Lee JY, Jeong EA, Kim KE, Yi CO, Jin Z1, Lee JE, Lee DH, Kim HJ, Kang SS, Cho GJ et al (2017) TonEBP/NFAT5 haploinsufficiency attenuates hippocampal inflammation in high‐fat diet/streptozotocin‐induced diabetic mice. Sci Rep 7: 7837 [DOI] [PMC free article] [PubMed] [Google Scholar]
- 27. Tatarkiewicz K, Hargrove DM, Jodka CM, Gedulin BR, Smith PA, Hoyt JA, Lwin A, Collins L, Mamedova L, Levy OE et al (2014) A novel long‐acting glucose‐dependent insulinotropic peptide analogue: enhanced efficacy in normal and diabetic rodents. Diabetes Obes Metab 16: 75–85 [DOI] [PMC free article] [PubMed] [Google Scholar]
- 28. Neumann UH, Ho JSS, Chen S, Tam YYC, Cullis PR, Kieffer TJ (2017) Lipid nanoparticle delivery of glucagon receptor siRNA improves glucose homeostasis in mouse models of diabetes. Mol Metab 6: 1161–1172 [DOI] [PMC free article] [PubMed] [Google Scholar]
- 29. Zhao HJ, Wang S, Cheng H, Zhang MZ, Takahashi T, Fogo AB, Breyer MD, Harris RC (2006) Endothelial nitric oxide synthase deficiency produces accelerated nephropathy in diabetic mice. J Am Soc Nephrol 17: 2664–2669 [DOI] [PMC free article] [PubMed] [Google Scholar]
- 30. Yuen DA, Stead BE, Zhang Y, White KE, Kabir MG, Thai K, Advani SL, Connelly KA, Takano T, Zhu L et al (2012) eNOS deficiency predisposes podocytes to injury in diabetes. J Am Soc Nephrol 23: 1810–1823 [DOI] [PMC free article] [PubMed] [Google Scholar]
- 31. Kanetsuna Y, Takahashi K, Nagata M, Gannon MA, Breyer MD, Harris RC, Takahashi T (2007) Deficiency of endothelial nitric‐oxide synthase confers susceptibility to diabetic nephropathy in nephropathy‐resistant inbred mice. Am J Pathol 170: 1473–1484 [DOI] [PMC free article] [PubMed] [Google Scholar]
- 32. Braasch DA, Corey DR (2001) Locked nucleic acid (LNA): fine‐tuning the recognition of DNA and RNA. Chem Biol 8: 1–7 [DOI] [PubMed] [Google Scholar]
- 33. Petersen M, Wengel J (2003) LNA: a versatile tool for therapeutics and genomics. Trends Biotechnol 21: 74–81 [DOI] [PubMed] [Google Scholar]
- 34. Grünweller A, Hartmann RK (2007) Locked nucleic acid oligonucleotides: the next generation of antisense agents? BioDrugs 21: 235–243 [DOI] [PubMed] [Google Scholar]
- 35. Mook OR, Baas F, de Wissel MB, Fluiter K (2007) Evaluation of locked nucleic acid‐modified small interfering RNA in vitro and in vivo . Mol Cancer Ther 6: 833–843 [DOI] [PubMed] [Google Scholar]
- 36. Schmidt KS, Borkowski S, Kurreck J, Stephens AW, Bald R, Hecht M, Friebe M, Dinkelborg L, Erdmann VA (2004) Application of locked nucleic acids to improve aptamer in vivo stability and targeting function. Nucleic Acids Res 32: 5757–5765 [DOI] [PMC free article] [PubMed] [Google Scholar]
- 37. Broos K, Van der Jeught K, Puttemans J, Goyvaerts C, Heirman C, Dewitte H, Verbeke R, Lentacker I, Thielemans K, Breckpot K (2016) Pharmacokinetics and pharmacodynamics of a 13‐mer LNA‐inhibitor‐miR‐221 in mice and non‐human primates. Mol Ther Nucleic Acids 5: e326 [DOI] [PMC free article] [PubMed] [Google Scholar]
- 38. Moschos SA, Frick M, Taylor B, Turnpenny P, Graves H, Spink KG, Brady K, Lamb D, Collins D, Rockel TD et al (2011) Uptake, efficacy, and systemic distribution of naked, inhaled short interfering RNA (siRNA) and locked nucleic acid (LNA) antisense. Mol Ther 19: 2163–2168 [DOI] [PMC free article] [PubMed] [Google Scholar]
- 39. Ryan D, Sutherland MR, Flores TJ, Kent AL, Dahlstrom JE, Puelles VG, Bertram JF, McMahon AP, Little MH, Moore L et al (2018) Development of the human fetal kidney from mid to late gestation in male and female infants. EBioMedicine 27: 275–283 [DOI] [PMC free article] [PubMed] [Google Scholar]
- 40. Puelles VG, Cullen‐McEwen LA, Taylor GE, Li J, Hughson MD, Kerr PG, Hoy WE, Bertram JF (2016) Human podocyte depletion in association with older age and hypertension. Am J Physiol Renal Physiol 310: F656–F668 [DOI] [PubMed] [Google Scholar]
- 41. Ozawa S, Ueda S, Imamura H, Mori K, Asanuma K, Yanagita M, Nakagawa T (2015) Glycolysis, but not mitochondria, responsible for intracellular ATP distribution in cortical area of podocytes. Sci Rep 5: 18575 [DOI] [PMC free article] [PubMed] [Google Scholar]
- 42. Khazim K, Gorin Y, Cavaglieri RC, Abboud HE, Fanti P (2013) The antioxidant silybin prevents high glucose‐induced oxidative stress and podocyte injury in vitro and in vivo . Am J Physiol Renal Physiol 305: F691–F700 [DOI] [PMC free article] [PubMed] [Google Scholar]
- 43. Gorin Y, Cavaglieri RC, Khazim K, Lee DY, Bruno F, Thakur S, Fanti P, Szyndralewiez C, Barnes JL, Block K et al (2015) Targeting NADPH oxidase with a novel dual Nox1/Nox4 inhibitor attenuates renal pathology in type 1 diabetes. Am J Physiol Renal Physiol 308: F1276–F1287 [DOI] [PMC free article] [PubMed] [Google Scholar]
- 44. Jha JC, Thallas‐Bonke V, Banal C, Gray SP, Chow BS, Ramm G, Quaggin SE, Cooper ME, Schmidt HH, Jandeleit‐Dahm KA (2016) Podocyte‐specific Nox4 deletion affords renoprotection in a mouse model of diabetic nephropathy. Diabetologia 59: 379–389 [DOI] [PMC free article] [PubMed] [Google Scholar]
- 45. Dombrauckas JD, Santarsiero BD, Mesecar AD (2005) Structural basis for tumor pyruvate kinase M2 allosteric regulation and catalysis. Biochemistry 44: 9417–9429 [DOI] [PubMed] [Google Scholar]
- 46. Morén A, Itoh S, Moustakas A, Dijke P, Heldin CH (2000) Functional consequences of tumorigenic missense mutations in the amino‐terminal domain of Smad4. Oncogene 19: 4396–4404 [DOI] [PubMed] [Google Scholar]
- 47. Bindea G, Mlecnik B, Hackl H, Charoentong P, Tosolini M, Kirilovsky A, Fridman WH, Pagès F, Trajanoski Z, Galon J (2009) ClueGO: a cytoscape plug‐in to decipher functionally grouped gene ontology and pathway annotation networks. Bioinformatics 25: 1091–1093 [DOI] [PMC free article] [PubMed] [Google Scholar]
- 48. García‐Aguilar A, Cuezva JM (2018) A review of the inhibition of the mitochondrial ATP synthase by IF1 in vivo: reprogramming energy metabolism and inducing mitohormesis. Front Physiol 9: 1322 [DOI] [PMC free article] [PubMed] [Google Scholar]
- 49. Shen L, Zhi L, Hu W, Wu MX (2009) IEX‐1 targets mitochondrial F1Fo‐ATPase inhibitor for degradation. Cell Death Differ 16: 603–612 [DOI] [PMC free article] [PubMed] [Google Scholar]
- 50. Abe Y, Sakairi T, Kajiyama H, Shrivastav S, Beeson C, Kopp JB (2010) Bioenergetic characterization of mouse podocytes. Am J Physiol Cell Physiol 299: C464–C476 [DOI] [PMC free article] [PubMed] [Google Scholar]
- 51. Bhargava P, Schnellmann RG (2017) Mitochondrial energetics in the kidney. Nat Rev Nephrol 13: 629–646 [DOI] [PMC free article] [PubMed] [Google Scholar]
- 52. Galvan DL, Green NH, Danesh FR (2017) The hallmarks of mitochondrial dysfunction in chronic kidney disease. Kidney Int 92: 1051–1057 [DOI] [PMC free article] [PubMed] [Google Scholar]
- 53. Wang XX, Edelstein MH, Gafter U, Qiu L, Luo Y, Dobrinskikh E, Lucia S, Adorini L, D'Agati VD, Levi J et al (2016) G protein‐coupled bile acid receptor TGR5 activation inhibits kidney disease in obesity and diabetes. J Am Soc Nephrol 27: 136–1378 [DOI] [PMC free article] [PubMed] [Google Scholar]
- 54. Shirata N, Ihara KI, Yamamoto‐Nonaka K, Sek T, Makino SI, Oliva TJ, Miyake T1, Yamada H, Campbell KN, Nakagawa T et al (2017) Glomerulosclerosis induced by deficiency of membrane‐associated guanylate kinase inverted 2 in kidney podocytes. J Am Soc Nephrol 28: 2654–2669. [DOI] [PMC free article] [PubMed] [Google Scholar]
- 55. Williamson JR, Steinman R, Coll K, Rich TL (1981) Energetics of citrulline synthesis by rat liver mitochondria. J Biol Chem 256: 7287–7297 [PubMed] [Google Scholar]
- 56. Pullman ME, Monroy GC (1963) A naturally occurring inhibitor of mitochondrial adenosine triphosphatase. J Biol Chem 238: 3762–3769 [PubMed] [Google Scholar]
- 57. García‐Bermúdez J, Sánchez‐Aragó M, Soldevilla B, Del Arco A, Nuevo‐Tapioles C, Cuezva JM (2015) PKA phosphorylates the ATPase inhibitory factor 1 and inactivates its capacity to bind and inhibit the mitochondrial H(+)‐ATP synthase. Cell Rep 12(12): 2143–2155 [DOI] [PubMed] [Google Scholar]
- 58. Sánchez‐Cenizo L, Formentini L, Aldea M, Ortega AD, García‐Huerta P, Sánchez‐Aragó M, Cuezva JM (2010) Up‐regulation of the ATPase inhibitory factor 1 (IF1) of the mitochondrial H+‐ATP synthase in human tumors mediates the metabolic shift of cancer cells to a Warburg phenotype. J Biol Chem 285: 25308–25313 [DOI] [PMC free article] [PubMed] [Google Scholar]
- 59. Chen WW, Birsoy K, Mihaylova MM, Snitkin H, Stasinski I, Yucel B, Bayraktar EC, Carette JE, Clish CB, Brummelkamp TR et al (2014) Inhibition of ATPIF1 ameliorates severe mitochondrial respiratory chain dysfunction in mammalian cells. Cell Rep 7: 27–34 [DOI] [PMC free article] [PubMed] [Google Scholar]
- 60. Dunlop M (2000) Aldose reductase and the role of the polyol pathway in diabetic nephropathy. Kidney Int Suppl 77: S3–S12 [DOI] [PubMed] [Google Scholar]
- 61. Giacco F, Du X, D'Agati VD, Milne R, Sui G, Geoffrion M, Brownlee M (2014) Knockdown of glyoxalase 1 mimics diabetic nephropathy in nondiabetic mice. Diabetes 63: 291–299 [DOI] [PMC free article] [PubMed] [Google Scholar]
- 62. Fogo AB (2011) The targeted podocyte. J Clin Invest 121: 2142–2145 [DOI] [PMC free article] [PubMed] [Google Scholar]
- 63. Reidy K, Kang HM, Hostetter T, Susztak K (2014) Molecular mechanisms of diabetic kidney disease. J Clin Invest 124: 2333–2340 [DOI] [PMC free article] [PubMed] [Google Scholar]
- 64. Qi W, Keenan HA, Li Q, Ishikado A, Kannt A, Sadowski T, Yorek MA, Wu IH, Lockhart S, Coppey LJ et al (2017) Pyruvate kinase M2 activation may protect against the progression of diabetic glomerular pathology and mitochondrial dysfunction. Nat Med 23: 753–762 [DOI] [PMC free article] [PubMed] [Google Scholar]
- 65. Pang L, Qiu T, Cao X, Wan M (2011) Apoptotic role of TGF‐β mediated by Smad4 mitochondria translocation and cytochrome c oxidase subunit II interaction. Exp Cell Res 317: 1608–1620 [DOI] [PubMed] [Google Scholar]
- 66. Zhu L, Gomez‐Duran A, Saretzki G, Jin S, Tilgner K, Melguizo‐Sanchis D, Anyfantis G, Al‐Aama J, Vallier L, Chinnery P (2016) The mitochondrial protein CHCHD2 primes the differentiation potential of human induced pluripotent stem cells to neuroectodermal lineages. J Cell Biol 215: 187–202 [DOI] [PMC free article] [PubMed] [Google Scholar]
- 67. Janssen HL, Reesink HW, Lawitz EJ, Zeuzem S, Rodriguez‐Torres M, Patel K, van der Meer AJ, Patick AK, Chen A et al (2013) Treatment of HCV infection by targeting microRNA. N Engl J Med 368: 1685–1694 [DOI] [PubMed] [Google Scholar]
- 68. Aubrey BJ, Kelly GL, Kueh AJ, Brennan MS, O'Connor L, Milla L, Wilcox S, Tai L, Strasser A, Herold MJ (2015) An inducible lentiviral guide RNA platform enables the identification of tumor‐essential genes and tumor‐promoting mutations in vivo . Cell Rep 10: 1422–1432 [DOI] [PubMed] [Google Scholar]
- 69. Lois C, Hong EJ, Pease S, Brown EJ, Baltimore D (2002) Germline transmission and tissue‐specific expression of transgenes delivered by lentiviral vectors. Science 295: 868–872 [DOI] [PubMed] [Google Scholar]
- 70. Kutner RH, Zhang XZ, Reiser J (2009) Production, concentration and titration of pseudotyped HIV‐1‐based lentiviral vectors. Nat Protoc 4: 495–505 [DOI] [PubMed] [Google Scholar]
Associated Data
This section collects any data citations, data availability statements, or supplementary materials included in this article.
Supplementary Materials
Expanded View Figures PDF
Review Process File
Source Data for Figure 7


