

Abstract
Mesenchymal stem cells (MSCs) have fueled ample translation for the treatment of immune‐mediated diseases. They exert immunoregulatory and tissue‐restoring effects. MSC‐mediated transfer of mitochondria (MitoT) has been demonstrated to rescue target organs from tissue damage, yet the mechanism remains to be fully resolved. Therefore, we explored the effect of MitoT on lymphoid cells. Here, we describe dose‐dependent MitoT from mitochondria‐labeled MSCs mainly to CD4+ T cells, rather than CD8+ T cells or CD19+ B cells. Artificial transfer of isolated MSC‐derived mitochondria increases the expression of mRNA transcripts involved in T‐cell activation and T regulatory cell differentiation including FOXP3, IL2RA, CTLA4, and TGFβ1, leading to an increase in a highly suppressive CD25+FoxP3+ population. In a GVHD mouse model, transplantation of MitoT‐induced human T cells leads to significant improvement in survival and reduction in tissue damage and organ T CD4+, CD8+, and IFN‐γ+ expressing cell infiltration. These findings point to a unique CD4+ T‐cell reprogramming mechanism with pre‐clinical proof‐of‐concept data that pave the way for the exploration of organelle‐based therapies in immune diseases.
Keywords: graft‐versus‐host disease, immunosuppression, mesenchymal stem cells, mitochondrial transfer, T regulatory cells
Subject Categories: Immunology, Molecular Biology of Disease, Regenerative Medicine
This study reveals that MitoT directly shapes the immune response by inducing Tregs, which could be potentially used as a therapy for autoimmune diseases such as GVHD.

Introduction
Mitochondria (MT) are the key players of energy balance and cell metabolism, and several lines of evidence indicate that the functional state of immunocompetent cells runs parallel to their metabolic condition 1. Indeed, mitochondrial degradation, biogenesis, and network formation are fundamental processes related to the metabolic control of T‐cell function in vivo 2. A recently studied phenomenon that contributes to mitochondrial dynamics is the intercellular transfer of MT between different cell types. Such cell‐to‐cell mitochondria mitochondria (MitoT) was first demonstrated for human mesenchymal stem cells (MSCs). These were able to rescue the growth of MT‐deficient cancer cells by the transfer of their own healthy MT, reinstating the target cell mitochondrial network 3. MSCs are known to exert tissue‐restoring and immunosuppressive effects that have been clinically tested for the treatment of inflammatory or immune‐mediated diseases including graft‐versus‐host disease (GVHD) 4. The significance of MitoT in vivo has been established in airway disease models in which the intra‐tracheal administration of MSCs was associated with the transfer of MT to alveolar epithelium, triggering an increase in metabolic activity while improving lung damage and disease outcome in the treated animals 5. Jackson et al 6 observed that MT transferred from MSCs were able to increase the phagocytic capabilities of macrophages, also in a murine model of respiratory disease; however, the MitoT to other immunocompetent cells has not been addressed. In this regard, a recent technique named “Mitoception” by Caicedo et al describes an artificial procedure to transfer MT from a donor into recipient cells. They demonstrated that freshly isolated MT from MSCs could be transferred into a cancer cell line based on centrifugation and endocytosis. The “mitocepted” cells were able to increase their ATP production while shifting toward a glycolytic pathway 7. Thus, the process of Mitoception allows a distinct analysis of the functional role of MT, independently from the paracrine and cell‐mediated effects that MSCs are known to exert on their target cells.
We hypothesized that MitoT can target immunocompetent cells and play a role in the regulation of T‐cell function, contributing to the dampening of inflammation that is associated with MSC therapy. Herein, we provide evidence of MitoT to human T‐cell subpopulations, assessing functional, transcriptomic, and metabolic effects on cell function in vitro and in an animal model of GVHD in vivo. These findings unravel a unique mechanism involved in the control of immune‐mediated diseases by cell and organelle therapies, through physiological and artificial MitoT from MSCs to lymphocytes.
Results
Rapid and dose‐dependent transfer of MT from MSCs to PBMC in vitro
To explore the MitoT from MSCs to human immune cells, donor cells were labeled with MT‐specific fluorescent probe (MitoTracker Green) and then co‐cultured with human PBMCs (Fig 1A). Immunofluorescent imaging revealed MSC‐MT in PBMCs (Fig 1B). MitoT to specific populations of immunocompetent cells was then assessed by flow cytometry (FACS), finding that ~ 40% of CD45+ cells acquired MitoTracker stain, even from different donors and varying sources of labeled MSC‐derived MT (Fig 1C and Table EV1), confirming that this property was extensive to all tested MSCs. Similarly, using subpopulation‐specific antibodies, we were able to evidence MitoT to CD3+ T, CD19+ B, and CD56+ natural killer (NK) cells (Figs 1D and EV1A and B), mainly directed to T‐helper CD4+ (57%) rather than T cytotoxic CD8+ lymphocytes (19%; P = 0.0008; Fig 1E). A dose–response curve of MitoT was observed within the CD45+CD3+ gated population when donor MSCs were co‐cultured at increasing MSC:PBMC ratios (1:100, 1:25, and 1:10), with an average of 9.3, 32.7, and 40.0% positivity for MT label, respectively (Fig 1F and G; P < 0.0001). These results provided the setting conditions we chose for the ensuing experiments. To further characterize the time kinetics of MitoT, similar conditions were evaluated at 24, 48, and 72 h, with no differences noted with longer incubation times (Fig EV1C). Surprisingly, with shortened time point experiments, MitoT was detected within 1 h, peaking at only 5 h of co‐culture (2.2 and 36.7% of T CD3+ MitoTpos cells, respectively; Figs 1H and EV1D and E). This reflects the very short time required for the transfer process. The inhibition of MitoT at 4°C and the lack of MitoTpos CD3+ T cells when supernatant from labeled MSCs was used (Fig EV1F) point to the mediation of an energy‐dependent process, not attributable to passive transfer due to unspecific signals such as dye leakage of the MitoTracker. Furthermore, a negligible amount of MitoT was observed from PBMCs to MSCs, and no detection of MitoT was observed from MSCs to MSCs (Fig EV1G and H), pointing to a target‐specific and unidirectional MT transfer. To reinforce the occurrence of MitoT, we quantified the mean fluorescent intensity (MFI) of MitoTracker‐labeled MSCs at baseline and after PBMCs co‐culture, evidencing a significant 3.6‐fold decrease in the mitochondrial fluorescent signal in MSCs post‐co‐culture (P = 0.0003), confirming the loss of the signal as result of the MT donation (Fig 1I). MitoT was confirmed by confocal microscopy, which showed the presence of labeled umbilical cord (UC)‐MSC‐derived MT inside the co‐cultured human CD3+ T cells stained in red (Fig 1J). Using human–mouse cell co‐culture experiments, we validated MitoT from MSCs by qPCR, as only mitochondrial‐specific human gene expression was detected, with no human B2M expression in FACS‐sorted mouse splenocytes previously co‐cultured with UC‐MSCs (Fig 1K). This confirmed that organelle transfer is not attributable to cell fusion. Since in non‐lymphoid cells MitoT has been previously shown to occur in response to target cell oxidative stress or damage 5 and MSC effects are activated by inflammatory signaling 8, we tested the effect of target cell conditions on MitoT, finding that anti‐oxidant treatment with pterostilbene did not modulate MitoT from MSCs to human CD3+ T cells (Fig EV1I), as neither did prior MSC licensing with IFN‐γ and IL1β (Fig EV1J).
Figure 1. MSCs efficiently transfer mitochondria in a dose‐dependent manner to T and B lymphocytes.
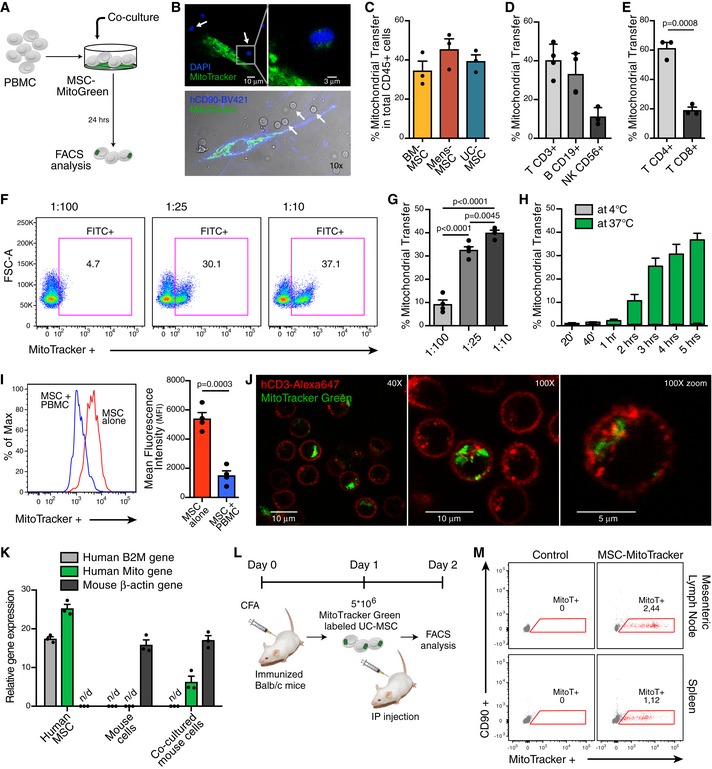
- Schematic representation of the experimental design used for co‐culture experiments.
- Representative confocal microscopy of human PBMCs stained with DAPI (white arrows) co‐cultured with previously labeled UC‐MSC with MitoTracker‐Green (top image) and specific antibody for human CD90 (bottom image).
- Percentage of mitochondrial transfer (MitoT) on total human CD45+ cells after 24 h co‐culture with MitoTracker‐Green labeled bone marrow (BM), menstrual (Mens) or umbilical cord (UC)‐MSCs (MSC:PBMC ratio 1:25) (n = 3 biological replicates, with three different donors of BM, Mens and UC‐MSCs).
- FACS analysis of MitoT on T CD3+ (n = 4), B CD19+ (n = 4) and natural killer (NK) CD56+ (n = 3) cells after 24 h co‐culture with MitoGreen labeled UC‐MSCs (ratio 1:25) (Biological replicates, with different donors of UC‐MSCs).
- FACS analysis of MitoT on CD3+ CD4+ or CD3+ CD8+ T cell populations after 24 h co‐culture with labeled UC‐MSCs (ratio 1:25) (n = 3 biological replicates, with three different donors of UC‐MSCs).
- Representative FACS plots of MitoT on CD45+ CD3+ T cells at increasing amounts of UC‐MSC.
- Percentage of MitoT on CD45+ CD3+ human cells after 24 h co‐culture with increasing ratios of UC‐MSC:PBMCs (n = 5 biological replicates, with five different UC‐MSCs and 5 different PBMCs).
- FACS analysis of MitoT on CD45+ CD3+ T cells after short times of co‐culture with UC‐MSCs at two different temperatures, at a ratio 1:25 (n = 3 biological replicates, with three different UC‐MSCs and three different PBMCs).
- Mean fluorescence intensity (MFI) of MitoTracker‐Green+ UC‐MSCs at baseline or after 72 h PBMC co‐culture. Representative FACS plot (left panel) and average of MFI (n = 4 biological replicates, with four different UC‐MSCs) (right panel).
- Confocal microscopy of human PBMCs after co‐culture with MitoTracker‐Green stained UC‐MSCs. Images showed MSC‐mitochondria (green) inside the CD3+ T cells (red).
- qPCR analysis of human β2‐microglobulin (B2M), human specific mitochondrial (Mito) and mouse specific (β‐actin) gene expression levels in UC‐MSCs, mouse derived spleen cells or FACS sorted CD45+ mouse cells after 24 h co‐culture with UC‐MSCs (n = 3 biological replicates). n/d = not detected.
- In vivo experimental design for MitoT in Balb/c mice transplanted with MitoTracker Green labeled MSCs.
- FACS analysis of in vivo MitoT from UC‐MSCs to Balb/c mouse mesenteric lymph node and spleen cells, 24 h after intraperitoneal transplantation of 5 × 10⁶ MitoTracker‐labeled MSCs or without cells (control) (n = 1).
Figure EV1. Extended characterization of MitoT from MSC to lymphocytes.
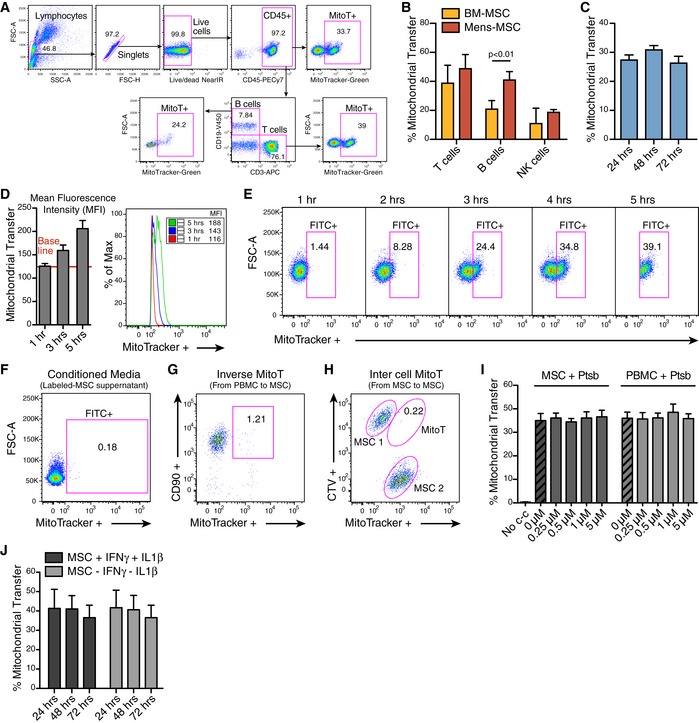
- Representative gating strategy showing MitoT to different cell type populations analyzed.
- FACS analysis of MitoT on T CD3+ (n = 3), B CD19+ (n = 3) and NK CD56+ (n = 2) cells after 24 h co‐culture with MitoGreen labeled bone marrow (BM) or menstrual (Mens) MSCs (ratio 1:25).
- Percentage of MitoT on CD45+ CD3+ human cells after 1–3 days of co‐culture with UC‐MSCs (ratio 1:25) (n = 3 biological replicates).
- Mean fluorescence intensity (MFI) of T CD3+ MitoTpos cells after short times of co‐culture with UC‐MSCs. Average bar graph (n = 3, left panel) and representative FACS plot (right panel).
- Representative FACS plots of MitoT on CD45+ CD3+ cells after short times of co‐culture with MitoTracker Green labeled UC‐MSCs.
- Representative FACS plot, out of five independent experiments, on human CD3+ cells cultured for 24 h with MitoGreen labeled UC‐MSC supernatant.
- Representative FACS analysis of MitoT from MitoTracker stained PBMC to CD90+ UC‐MSC, 24 h following the co‐culture (ratio 1:25).
- Representative FACS analysis of MitoT from MitoGreen stained MSC to CellTrace Violet (CTV) labeled MSC, after 24 h co‐culture (ratio 1:1).
- Percentage of MitoT on CD3+ T cells from UC‐MSCs or PBMCs pre‐treated with increasing concentrations of the anti‐oxidant Pterostilbene (Ptsb), after 4 h co‐culture (n = 2 biological replicates).
- Percentage of MitoT on CD45+ CD3+ human cells after 1–3 days of co‐culture with UC‐MSCs (ratio 1:25) with or without pro‐inflammatory licensing cytokines (n = 3 biological replicates).
Finally, to corroborate that MSCs exert MitoT to lymphocytes also in vivo, experiments were designed using Balb/c mice previously immunized with Complete Freund's Adjuvant (CFA) and transplanted with MitoTracker‐labeled UC‐MSCs (Fig 1L). Mouse mesenteric lymph nodes and spleen cells were harvested after 24 h and flow cytometry analysis, gating on total leukocyte population, showed a 2.4 and 1.12% positivity for MitoTracker label, respectively, substantiating that MSCs are capable of in vivo MitoT (Fig 1M).
CD3+ T cells are permissive to artificial mitochondrial transfer
Artificial MitoT referred as “Mitoception” was used to selectively assess the functional impact that MitoT from UC‐MSCs had on T cells, independently from the effects due to cell contact or other paracrine factors. On that ground, functional and biologically active MT were isolated from UC‐MSCs and incubated with human PBMCs following the Mitoception protocol 7 (Fig 2A). As visualized by confocal microscopy images and flow cytometry, isolated MSC‐MT displayed a physiological mitochondrial membrane potential (MMP) as revealed by MitoTracker Red CMXRos and TMRM‐positive stains (Fig EV2A–C). Further activity of isolated MSC‐MT was assessed by measurements of ATP production (Fig EV2D), demonstrating that the MT we transferred to T cells were active and functional. Confocal microscopy images revealed the presence of both endogenous and exogenous MT (labeled with MitoTracker Red and MitoTracker Green, respectively) within the target CD3+ T cells (Fig 2B). CD3+ T cells were permissive to artificial MitoT mimicking the co‐culture condition, since a dose‐dependent uptake of MSC‐derived MT equivalent to MSC:PBMC ratios of 1:100, 1:25, and 1:10 was evidenced, with an average of 15, 36, and 50.4% of MitoTracker‐labeled CD3+ T cells, respectively (Fig 2C). Also, using transmission electron microscopy, a significant twofold increase in MT numbers was counted in the sorted CD3+ MitoTpos target cells compared with MitoTneg cells (average of 11 and 5 per cell, respectively, P < 0.0001; Fig 2D and E); nevertheless, no changes on area, length, or MT perimeter were observed between both groups (Fig EV2E). To determine the status of the mitochondrial dynamics within the CD3+ MitoTpos cells, we evaluated fusion/fission key players mRNA levels and protein expression changes. After 48 h post‐mitoception, a significant reduction in Opa1, Mfn1/2, and Dnm1l mRNA expression was observed when comparing CD3+ MitoTpos and MitoTneg cells, although no significant differences were observed in protein levels at the evaluated times points (Fig EV2F and G). Phosphorylated Ser616‐DRP1 (p‐DRP1) was not detected.
Figure 2. CD3+ T cells are permissive to artificial MitoT (Mitoception) resulting in an increase of their mitochondrial content.
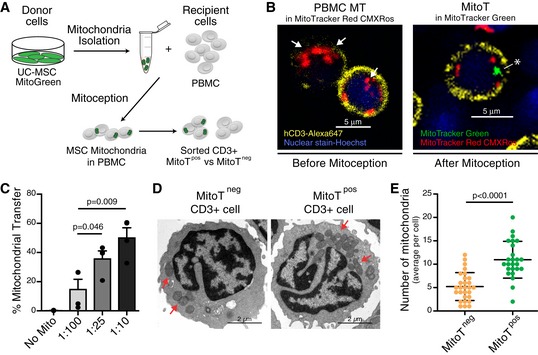
- Schematic representation of the experimental design of the Mitoception protocol.
- Confocal microscopy images of human CD3+ T cells with endogenous MT‐labeled with MitoTracker Red CMXRos (white arrows, left panel) or after Mitoception with MitoTracker Green labeled‐MT from UC‐MSCs (white asterisk, right panel).
- FACS analysis of MitoT on CD3+ human T cells after Mitoception with increasing amounts of UC‐MSC‐MT corresponding to the same cell number ratios used in co‐culture experiments (n = 4 biological replicates, with 4 different donors of UC‐MSCs). Graph shows mean ± SEM and statistical analysis by Student's t‐test.
- Representative transmission electron microscopy images of FACS‐sorted human CD3+ MitoTneg and CD3+ MitoTpos cells following Mitoception with UC‐MSC‐MT. Red arrows show human mitochondria.
- Quantification of human MT in sorted CD3+ MitoTneg and MitoTpos cells after Mitoception with UC‐MSCs, by transmission electron microscopy (n = 25 independent cells analyzed per group). Graph shows mean ± SEM and statistical analysis by Student's t‐test.
Figure EV2. Characterization of MSC‐derived mitochondria activity and fate. Functional assays on isolated MT.
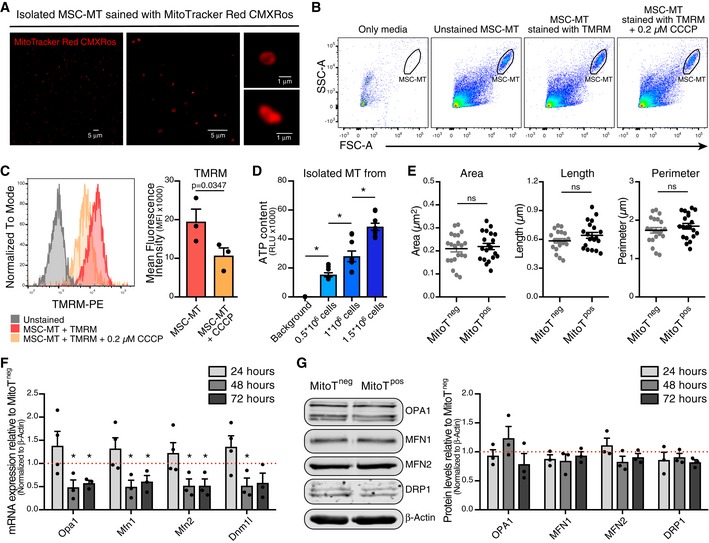
- Representative confocal microscopy of isolated MSC‐MT stained with MitoTracker Red CMXRos at different magnifications (40× left and middle panel, and 63× right panels).
- Representative gating strategy showing isolated mitochondria from 1 × 10⁶ MSCs per condition by FACS.
- Mean fluorescence intensity (MFI) of TMRM dye on unstained MSC‐MT, MSC‐MT stained with TMRM or MSC‐MT stained with TMRM previously treated with 0.2 μM of CCCP (carbonyl cyanide 3‐chlorophenylhydrazone). Representative FACS plot (left panel) and average of MFI (n = 3 biological replicates, with three different UC‐MSCs) (right panel).
- ATP production of isolated MSC‐MT from increasing amounts of MSC cells (n = 3 biological replicates run in triplicates). Graph shows mean ± SEM and statistical analysis by one‐way ANOVA with Tukey's post‐test.
- Analysis of mitochondrial morphology parameters of human MT in sorted CD3+ MitoTneg and MitoTpos cells after Mitoception with UC‐MSCs, by transmission electron microscopy (n = 20 independent cells analyzed per group).
- qRT‐PCR analysis of genes related to mitochondrial fusion/fission in FACS‐sorted CD3+ MitoTneg and CD3+ MitoTpos cells from healthy human PBMCs (n = 3 biological replicates, with three different donors of PBMCs), after 24, 48 and 72 h post Mitoception. The graph depicts fold expression in CD3+ MitoTpos cells relative to CD3+ MitoTneg cells, which are set at 1 (red dotted line).
- Western Blot analysis of protein levels related to mitochondrial fusion/fission in FACS‐sorted CD3+ MitoTneg and CD3+ MitoTpos cells from healthy human PBMCs. Representative blots at 24 h post Mitoception (left panel) and bar graph showing 24, 48 and 72 h post Mitoception (right panel) (n = 3 biological replicates, with three different donors of PBMCs). The graph depicts fold expression in CD3+ MitoTpos cells relative to CD3+ MitoTneg cells, which are set at 1.
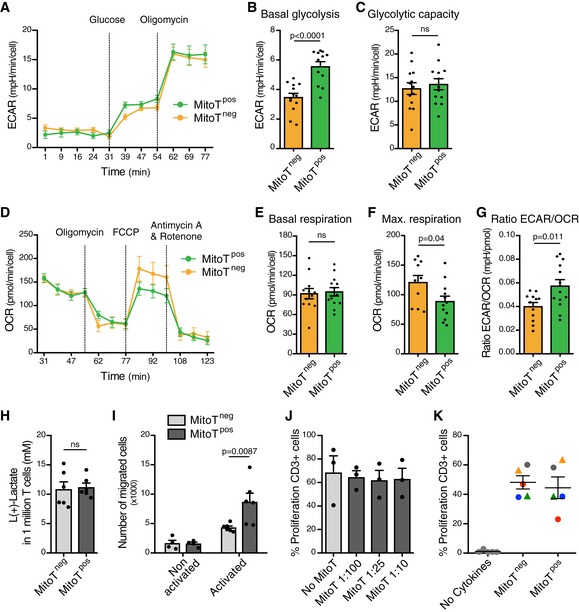
Metabolic activity changes were measured using extracellular flux analysis on sorted CD3+ MitoTpos and CD3+ MitoTneg cells. The extracellular acidification rate (ECAR), indicative of the glycolytic activity, showed a significant 1.6‐fold increase in the basal glycolysis (measured as ECAR above basal after adding glucose) in MitoTpos compared with MitoTneg cells (P < 0.0001; Fig EV3A and B), but no changes were observed for glycolytic capacity (measured as maximal ECAR above basal after ATP synthase inhibition with oligomycin; Fig EV3C). In contrast, the oxygen consumption rate (OCR, an indicator of OXPHOS activity) did not show any variation of the basal mitochondrial respiration (measured as basal OCR before ATP synthase inhibition with oligomycin) between MitoTpos and MitoTneg cells, though a significant decrease in the maximum respiration was observed (measured as OCR above basal after uncoupling with FCCP) in MitoTpos cells in comparison with MitoTneg cells (P = 0.04; Fig EV3D–F), which is linked to the capacity of the cells to adapt to a stressful environment or increased work conditions. Moreover, using the ECAR/OCR ratio, a significant 1.5‐fold increase (P = 0.011) was computed for the mitocepted T‐cell population, suggesting a metabolic switch toward an activated state of the lymphocyte population (Fig EV3G), even though lactate production remained the same between CD3+ MitoTpos compared with CD3+ MitoTneg cells (Fig EV3H).
Figure EV3. Functional analysis of MitoT on CD3+ T cells. Metabolic changes, transmigration capacity and proliferation analysis on MitoTpos cells.
-
A–CExtracellular Acidification Rate (ECAR) analysis measured in a Seahorse XFp extracellular flux analyzer in FACS‐sorted MitoTpos and MitoTneg CD3+ T cells mitocepted with UC‐MSC mitochondria (n = 3 biological replicates, ran in quadruplicates).
-
D–FOxygen Consumption Rate (OCR) analysis measured in a Seahorse XFp extracellular flux analyzer in FACS‐sorted MitoTpos and MitoTneg CD3+ T cells mitocepted with UC‐MSC mitochondria (n = 3 biological replicates, ran in quadruplicates).
-
GGlycolysis/OXPHOS ratio on FACS‐sorted MitoTpos and MitoTneg CD3+ T cells mitocepted with UC‐MSC‐MT (n = 3 biological replicates, ran in quadruplicates).
-
HL(+)‐Lactate concentrations from supernatants of sorted CD3+ MitoTneg and MitoTpos T cells, previously mitocepted with UC‐MSC‐MT (n = 2 biological replicates, each one in triplicate).
-
INumber of migrated CD4+ MitoTneg and MitoTpos sorted T cells from 100.000 cells seeded on media non‐activated or activated with anti‐CD3 and IL‐2 for 3 days (n = 3 biological replicates, in duplicates).
-
JPercentage of CD3+ T cell proliferation after increasing Mitoception ratios, quantified by measuring the corresponding decrease in CellTrace Violet (CTV) proliferation dye intensity by flow cytometry (n = 3 biological replicates with three different PBMC donors).
-
KPercentage of proliferation of FACS‐sorted MitoTneg and MitoTpos CD3+ cells, after 5 days in culture with anti‐CD3/CD28 beads (1/20) and IL‐2 (50 U/ml) in the presence or absence of PHA (15 μg/ml) (round or triangle dots respectively) (n = 5 biological replicates with five different PBMC donors).
Transmigration capacity of MSC‐mitocepted T cells was also analyzed using a commercial Transwell device. After 4 h of incubation, FACS‐sorted CD4+ MitoTpos cells that were activated with anti‐CD3 and IL‐2 showed a significant increase in migration capacity compared with MitoTneg cells (P = 0.0087, Fig EV3I). Functional analysis showed no differences in the proliferation rate of mitocepted CD3+ T cells compared with control conditions (Fig EV3J and K).
MitoT induces changes in mRNA expression associated with T‐cell activation pathways
To further assess the functional impact of exogenous MSC‐derived MT on human T‐cell function, we performed whole transcriptome RNA sequencing (RNA‐Seq) of FACS‐sorted CD3+ MitoTpos and CD3+ MitoTneg cells. Differential gene expression (using HISAT2 software version 2.0.5) was first analyzed finding 191 coding genes that were differentially expressed (DE; at FDR 5%) between MitoTpos as opposed to MitoTneg CD3+ cells (Fig 3A). Volcano plots depict DE genes that were upregulated or downregulated in response to MitoT (Fig 3B). Unsupervised hierarchical clustering, as heat map representation, performed for all coding DE genes, revealed that T‐cell regulation and/or activation‐related gene expression distinguished MitoTpos from MitoTneg CD3+ sorted samples (Figs 3C and EV4A). Further gene set enrichment analysis (GSEA) of RNA‐Seq data revealed over‐representation of modules containing genes related to functional pathways including MT membrane organization and biogenesis and co‐expression/interaction network displaying FOXP3 as hub gene (Fig EV4B–D). Next, to elucidate the roles of the DE genes we used the web‐based Enrichr bioinformatics tool (see Materials and Methods) that identified pathways enriched for the DE genes in each case. Among the top 20 pathways that were significantly involved (adjusted P‐value < 0.05) according to the GO Biological Process 2015 database, 10 were related to T‐cell regulation and/or activation (Fig 3D). Interestingly, important transcripts concerning T‐cell activation (IL2RA‐CD25) and T regulatory cell (Treg) differentiation (FoxP3) were found to be increased in MitoTpos CD3+ T cells, while conversely, negative regulators of Treg differentiation such as RORC were decreased compared with MitoTneg cells (Fig 3E). Finally, expression levels for selected DE genes involved in T‐cell activation and Treg differentiation were additionally validated by qRT–PCR, corroborating the significant (P < 0.05) upregulation of FoxP3, CTLA4, and GITR mRNA levels (Fig 3F) seen in the RNA‐Seq analyses of MitoTpos compared with MitoTneg cells (Fig 3G).
Figure 3. Bioinformatic analysis of MitoT cells identifies changes in mRNA expression associated with T cell activation and differentiation pathways.
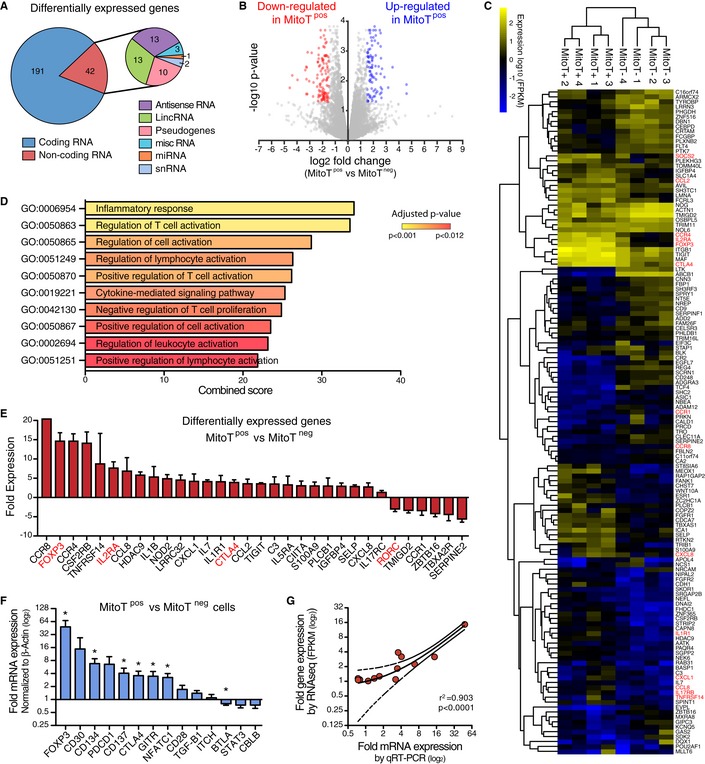
- Differentially expressed (DE) genes from whole transcriptome RNA sequencing analysis in FACS‐sorted CD3+ MitoTneg and CD3+ MitoTpos cells from healthy human peripheral blood samples (n = 4 biological replicates, with 4 different donors of PBMCs).
- Volcano plot analysis derived from FPKM values showing DE genes (P < 0.05, Student's t test) in sorted MitoTneg and MitoTpos CD3+ cells (from four different donors of PBMCs).
- Heatmap depiction of RNA‐Seq analysis of significantly (P < 0.01, Student's t test) DE coding genes from sorted MitoTpos and MitoTneg CD3+ cells (from four different donors of PBMCs).
- Significantly enriched pathways related to T cell regulation and activation for DE genes (P < 0.05, Student's t test) between MitoTpos and MitoTneg CD3+ cells, from the GO Biological Process 2015 database (from 4 different donors of PBMCs).
- Differentially expressed genes from the significantly enriched pathways listed in Fig 2D. Highlighted in red are key markers of Treg phenotype.
- qRT‐PCR analysis of genes related to T cell activation after Mitoception with UC‐MSC‐MT (n = 4 biological replicates, with four different donors of PBMCs). The graph depicts fold expression in CD3+ MitoTpos cells relative to CD3+ MitoTneg cells, which are set at 1. Graph shows mean ± SEM and statistical analysis by Student's t‐test (*P < 0.05).
- Correlation analysis of 14 sampled genes between qRT‐PCR and RNA‐Seq, from MitoTpos and MitoTneg CD3+ cells (from 4 different donors of PBMCs). Graph depicts best‐fit line and 95% confidence intervals by Pearson correlation analysis.
Figure EV4. MitoT‐driven Treg differentiation. Analysis of gene set enrichment of RNA‐Seq data.
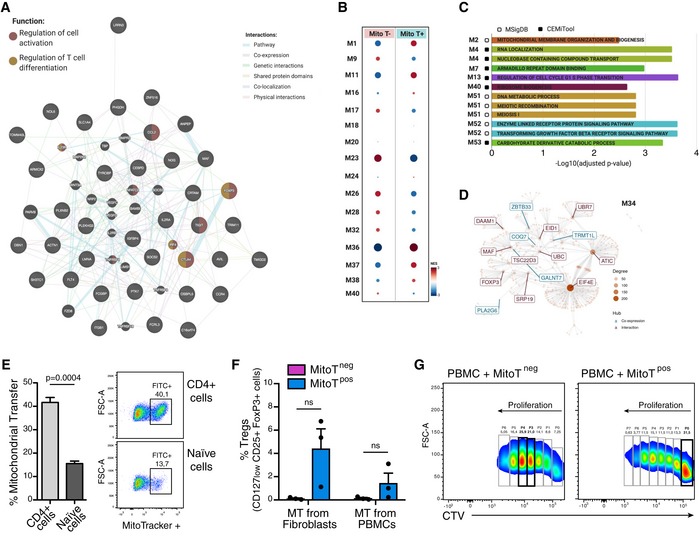
- Interaction network from FOXP3‐associated DE coding genes in sorted MitoTposCD3+ compared to MitoTnegCD3+ T cells (n = 4 different donors of PBMCs), using Genemania.
- Gene Set Enrichment Analysis (GSEA) of co‐expressed modules identified by webCEMiTool showing, the enriched module activity between sorted MitoTpos and MitoTnegCD3+ T cells (from 4 different donors of PBMCs).
- Top over‐represented functional categories according to webCEMiTool and MSigDB, identified co‐expressed gene modules.
- Gene co‐expression/interaction networks of module 34 (M34) displaying FOXP3 as hub gene.
- FACS analysis of MitoT on CD4+ and naïve (CD4+ CD45RA+ CD45RO−) T cells after Mitoception with UC‐MSC mitochondria, represented as bar graph (left panel, n = 3 biological replicates) and representative FACS plot (right panel). Graph shows mean ± SEM and statistical analysis by Student's t‐test.
- FACS analysis of Treg induction after 5–7 days differentiation in plain media of FACS‐sorted CD4+ naïve MitoTneg and MitoTpos cells previously mitocepted with Fibroblasts or same donor PBMCs mitochondria (n = 3 biological replicates for each condition).
- Representative proliferation FACS plots of CTV‐stained PBMC co‐cultured with MitoTneg or MitoTpos cells (ratio 1:1) after 5–7 days of CD4+ naïve cell activation with differentiation media.
The sole transfer of mitochondria induces Treg cell differentiation
To assess whether MSC‐MitoT impacts T‐cell differentiation, functional analyses were performed using FACS‐sorted T CD4+ naïve cells. Human PBMCs were mitocepted, stained, and sorted for naïve (CD4+CD45RA+CD45RO−) MitoTpos and naïve MitoTneg cell populations (Fig EV4E). These were then tested for in vitro differentiation in the absence or presence of Treg‐inducing media (anti‐CD3, IL‐2, and TGF‐β1). Interestingly, in the absence of cytokine‐based induction media cell clusters identified by bright‐field microscopy evidenced a particular activation/proliferation status among MitoTpos cells (Fig 4A). Furthermore, FACS analysis confirmed that marked levels of Treg differentiation occurred in MitoTpos cells compared with the MitoTneg condition (24% and < 1%, respectively), revealing that MitoT alone was capable of driving Treg cell (CD25+FoxP3+) differentiation (Fig 4B). The percentage of Treg cells among MitoTpos compared with MitoTneg cells was significantly increased in both cultures, with or without the differentiation media (19.8 versus 0.56; and 41.45 and 5.19, P = 0.013 and P < 0.0001, respectively; Fig 4C). Interestingly, MT from other sources including fibroblasts or PBMCs failed to obtain high frequency of Treg cells (4.4 and 1.4%, respectively; Fig EV4F), proving that the observed MitoT effect is source‐dependent.
Figure 4. Efficient MitoT to T cells underlies functional changes including enhanced immunosuppression through regulatory T cell (Treg) induction.
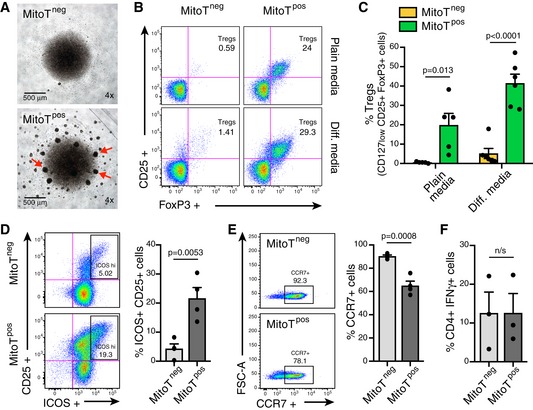
- Representative bright‐field microscopy images of FACS‐sorted CD4+ naïve MitoTneg (upper panel) and MitoTpos (lower panel) cells after 5 days in culture with plain media (no cytokines added). Red arrows are indicative of activation/proliferation clusters.
- Representative FACS plots of Treg (CD127lowCD25+ FoxP3+) populations after T cell differentiation on media with or without cytokines and antibody supplements (anti‐CD3, IL‐2 and TGF‐b1).
- FACS analysis of Treg induction after 5–7 days differentiation of FACS‐sorted CD4+ naïve MitoTneg and MitoTpos cells in plain (n = 5) or differentiation media (n = 6) (Biological replicates, with different donors of PBMCs).
- ICOS expression on FACS‐sorted CD4+ naïve MitoTneg and MitoTpos cells after 5–7 days in culture with differentiation media. Representative FACS plot (left panel) and bar graph (right panel) of ICOS high population (n = 4 biological replicates).
- CCR7 expression on sorted CD4+ naïve MitoTneg and MitoTpos cells after 5–7 days in culture with differentiation media. Representative FACS plot (left panel) and bar graph (right panel) of CCR7+ population (n = 4 biological replicates).
- FACS analysis of Th1 (CD4+ IFN‐γ+) induction after 5–7 days differentiation of FACS‐sorted CD4+ naïve MitoTneg and MitoTpos cells in plain media (n = 3 biological replicates). n/s= not significant.
Further analysis on FACS‐sorted T CD4+ naïve MitoTneg compared with MitoTpos cells differentiated into Treg cells showed a significant increase in the CD25+ICOS+ subset (average of 4.3 and 21.6%, respectively, P = 0.0053) and a decrease in the CCR7+ subset (average of 90.3 and 64.9%, respectively, P = 0.0008; Fig 4D and E), suggesting that MitoTpos cells feature phenotypic characteristics of highly activated Treg cells 9, 10. Interestingly, no changes were observed on pro‐inflammatory T‐helper 1 (Th1; CD4+IFN‐γ+) cells when comparing MitoTpos and MitoTneg cells cultured in plain media (Fig 4F). T‐helper 17 (Th17; CD4+IL17+) cells were not detected under this condition.
MitoT‐induced Treg suppress effector T cells
Next, we evaluated whether the phenotypic Treg cells obtained following MSC‐MT induction retain their suppressive function. Using a co‐culture assay with PBMCs from a different donor, previously stained with Cell Trace Violet (CTV), the capacity of the new Treg cells to inhibit proliferation (immunosuppression assay) was tested (Fig 5A). After 5 days in co‐culture under PHA activation, FACS analysis showed that both MitoTneg and MitoTpos Treg‐induced cells inhibited the proliferation of target PBMCs. However, MitoTpos Treg‐mediated immunosuppression of PBMCs was significantly higher compared with MitoTneg Treg cells, at both 1:1 (4.7‐fold change) and 2:1 (fivefold change) cell ratios (P = 0.0074 and 0.0028, respectively; Fig 5B and C, and EV4G).
Figure 5. MitoT‐induced Treg cells inhibit the proliferation of target PBMCs.

- Schematic representation of the experimental design used for the immunosuppression assay.
- Representative proliferation FACS histogram of CTV‐stained PBMC co‐cultured with MitoTneg or MitoTpos cells (ratio 1:1) after 5–7 days of CD4+ naïve cell activation with Treg induction/differentiation media (anti‐CD3, IL‐2 and TGF‐b1). PBMC alone represents positive control of proliferation and PBMC co‐culture with MitoTneg correspond to the inhibition control with induced Treg cells.
- Percentage of immunosuppression of CTV‐stained PBMC co‐cultured with MitoTneg or MitoTpos cells after 5–7 days of CD4+ naïve cell activation with differentiation media (ratio MitoT cells:PBMC) (n = 3 biological replicates, with different donors of PBMCs). Graph shows mean ± SEM and statistical analysis by Student's t‐test.
MitoT significantly increased the survival rate of GVHD mice reducing the degree of tissue inflammation
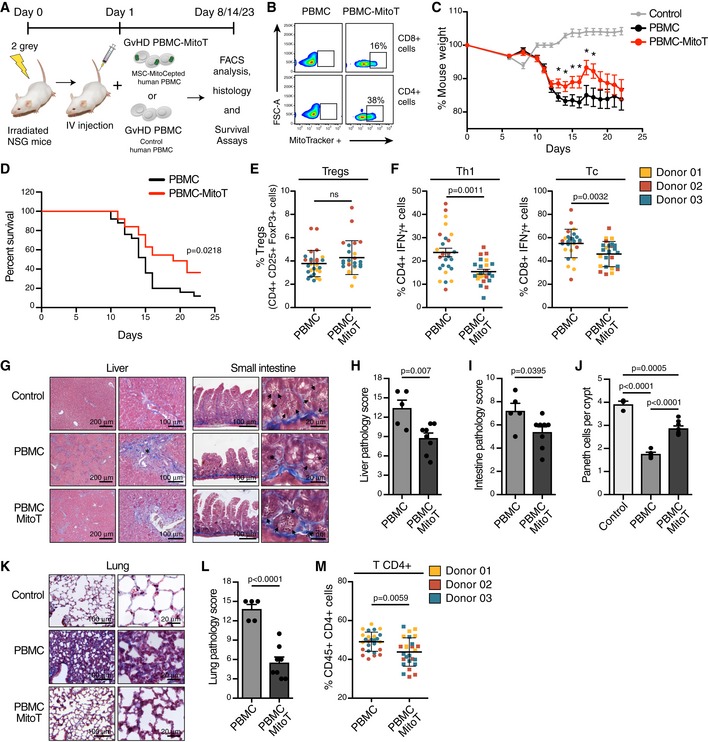
Since CD4+CD25+Foxp3+ Treg cells are critical in the control of tolerance and autoimmunity and also implicated in human diseases including GVHD 11, we used this model to assess the functional impact of MitoT in vivo. To this end, we assessed the effect of mitocepted PBMCs in contrast with non‐treated PBMCs in the induction of a murine model of GVHD. To gauge the expansion of the donor‐derived and disease‐inducing cells in the host, we employed a human xenogeneic mouse model of GVHD (Fig 6A and B). Starting at 13 days post‐GVHD induction, a significant difference in weight loss (P < 0.05) was observed comparing the PBMC‐MitoT (88.5%) and control PBMC group (84.4%; Fig 6C). Moreover, the mitocepted PBMC‐induced group displayed a significant improvement in mice survival rate compared with controls, with a median survival of 19 and 15 days, respectively (P = 0.0218; Fig 6D). Next, we evaluated the in vivo expansion and tissue infiltration of pro‐inflammatory and anti‐inflammatory human donor T cells in spleen, small intestine (SI), liver, and lung. After 8–9 days of GVHD induction, FACS analysis of splenocytes showed that CD4+CD25+Foxp3+ T cells were increased in the mitocepted group, yet not significantly (Figs 6E and EV5A and B), while the IFN‐γ+ pro‐inflammatory cells showed a significant reduction in Th1 (CD4+IFN‐γ+; average of 23.6% for PBMC and 15.4% for PBMC‐MitoT) and cytotoxic T CD8+IFN‐γ+ (1.2‐fold change) populations (P = 0.0011 and P = 0.0032, respectively; Figs 6F and EV5C and D). No change was observed in Th17 cells (CD4+IL‐17+ populations; Fig EV5E). Histopathological analysis showed that mice receiving mitocepted PBMCs had less pathological damage scores in the liver and SI compared with mice receiving control PBMCs (Fig 6G), with 34.7% (P = 0.007) and 25.35% (P = 0.0395) reduction in pathology scores for liver and SI, respectively (Fig 6H and I). Interestingly, we found that the number of Paneth (gut‐regenerating) cells per crypt was significantly higher (1.6‐fold) in mice receiving PBMC‐MitoT compared with untreated PBMC‐inducing protocol (P < 0.0001; Fig 6J). In lung tissues, histological analysis showed that mice receiving control PBMC displayed a dense mononuclear cell infiltrate surrounding both pulmonary vessels and bronchioles and a severe pneumonitis involving both the interstitium and alveolar spaces (Fig 6K), while mitocepted PBMC‐treated mice showed a 2.5‐fold reduction in damage scores (P < 0.0001) compared with PBMC control group (Fig 6L). FACS analysis revealed a significant decrease in total human T CD4+ cells in lung tissues of PBMC‐MitoT group versus PBMC control group (P = 0.0059; Fig 6M). These results suggest that the increased survival rate of mitocepted‐PBMC mice is associated with a marked reduction in tissue injury of the main target organs affected in GVHD.
Figure 6. Xeno‐GVHD induction with MitoTpos‐PBMCs is associated with improved survival and reduced tissue inflammation in a mouse model of disease.
-
AIn vivo experimental design of human xenogenic model of GVHD in NSG immunodeficient mice, with MSC‐mitocepted human PBMC transplant.
-
BRepresentative FACS plots of Mitoception (% of MitoTracker+) in CD4+ or CD8+ T cells from mitocepted PBMC compared to control PBMC, before intravenous injection.
-
CPercent of mouse weight after GVHD induction with IV injection of mitocepted PBMC or control PBMC cells (n = 3, with a total of 25 mice per group). Control group in grey, were untreated mice (n = 6 mice). *P < 0.05 by Mann Whitney t‐test.
-
DKaplan Meier plot showing percent survival of GVHD mice after transplantation of an equal amount (12 × 106 cells) of mitocepted PBMC or control PBMC cells (n = 3, with a total of 25 mice per group) (P = 0.0218 by log‐rank test).
-
EFACS analysis of human Treg (CD4+ CD25+ FoxP3+) cell engraftment in mouse spleen following transplantation of PBMC‐MitoT or control PBMC cells (n = 3, with a total of 25 and 27 mice per group, respectively).
-
FFACS analysis of human pro‐inflammatory T helper1 (CD4+ IFN‐γ+, left panel) and T cytotoxic (CD8+ IFN‐γ+, right panel) cell engraftment in mouse spleen following transplantation of mitocepted or control PBMC cells (n = 3, with a total of 25 and 27 mice per group, respectively).
-
GRepresentative histopathologic images of GVHD in liver and small intestine sections obtained from PBMC‐MitoT, PBMC and non‐transplanted control samples, stained with Masson's trichrome staining. Asterisk showed increased periportal collagen deposits in the liver and increased piknotic cells in the small intestine crypts. Arrowheads represents a reduced number of Paneth cells.
-
H, ISemiquantitative scoring system for pathologic damage in the liver and small intestine of mitocepted PBMC (n = 8 independent mice) or control PBMC transplanted mice (n = 5 independent mice).
-
JQuantification of Paneth cells per crypt, from at least 50 crypts per PBMC‐MitoT (n = 8 mice), PBMC transplanted (n = 5 mice) or non‐transplanted control (n = 3) mouse.
-
KRepresentative histopathologic images of GVHD in lung sections obtained from PBMC‐MitoT, PBMC and non‐transplanted control, stained with Masson's trichrome staining.
-
LSemiquantitative scoring system for pathologic damage in lung of mitocepted PBMC (n = 8 independent mice) or control PBMC transplanted mice (n = 5 independent mice).
-
MFACS analysis of total human CD4+ cell engraftment in mouse lungs following transplantation of mitocepted PBMC or control PBMC cells (n = 3, with a total of 25 and 27 mice per group, respectively).
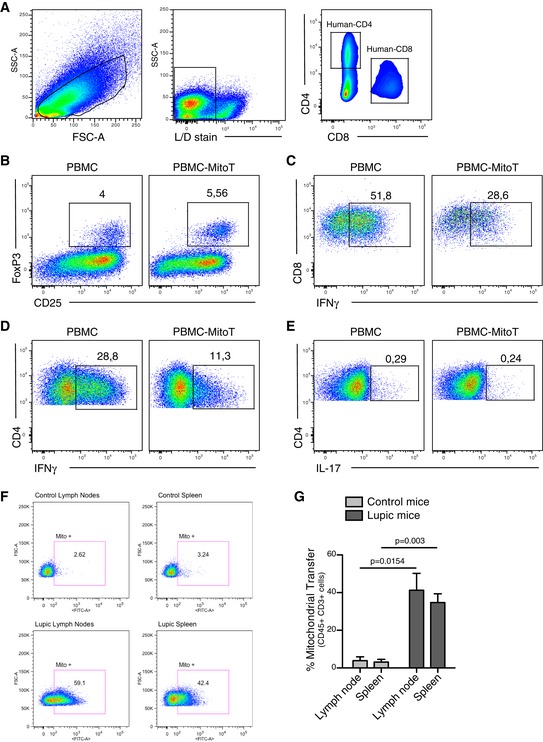
Figure EV5. Efficient ex vivo MitoT in inflammatory T cells isolated from a SLE mouse model.
-
A–ERepresentative gating strategy used for the in vivo analyses. Representative FACS plots of (B) Tregs (FoxP3+ CD25+), (C) T cytotoxic (CD8+ IFNg+), (D) Thelper 1 (CD4+ IFNg+) and (E) Thelper 17 (CD4+ IL17+) populations cell engraftment in mouse spleen following transplantation of mitocepted or control PBMC cells.
-
FRepresentative FACS plot, out of 3 independent experiments, on MRL/MpJ/Fas mouse CD45+ CD3+ cells from spleen or lymph nodes co‐cultured for 24 h with MitoGreen labeled UC‐MSCs.
-
GFACS analysis of ex vivo MitoT from labeled UC‐MSCs to MRL/MpJ/Fas (lupic) or MRL/MpJ (control) mouse CD45+ CD3+ cells from spleen or lymph nodes (n = 3 biological replicates). Graph shows mean ± SEM and statistical analysis by Student's t‐test.
Systemic lupus erythematosus (SLE) is an autoimmune disease with inflammatory disorder of the connective tissues. The SLE model was selected to demonstrate the MitoT efficiency on inflammatory T cell ex vivo. Immune cells isolated from the spleen and lymph nodes from SLE mice (MRL/MpJ/Fas) showed a significant increased (10‐fold) MitoT from UC‐MSCs compared with control healthy mice (MRL/MpJ; Fig EV5F and G).
Discussion
Mitochondria as key players of cellular metabolism are critically important to understand T‐cell function changes. MT status not only fuels active lymphocytes but as our data indicate also provides guidance for proliferation, migration, and cell fate decisions. Hence, MitoT might represent an amenable system to study functional changes in T cells while enabling improved cell‐based treatments, since MSCs are a main cell source for MitoT 12. The scope of such immunometabolic and regulatory change has been in part addressed by Chen et al 13 who evidenced that UC‐MSCs tended to correct the mitochondrial respiratory dysfunction and increased T‐cell apoptosis of SLE patients, in concomitance with MitoT to PBMCs in vitro. While most of the work regarding mitochondrial delivery from one cell to another involves the rescue of damaged cells by healthy ones, no study to date has shown the physiological or artificial transfer to healthy lymphocytes. In this work, we assemble direct evidence for a reproducible, rapid, dose‐dependent, and efficient MitoT from cultured MSCs to T and B lymphocytes isolated from healthy donors. Since MitoTracker‐labeled MT can leak dye over time, control experiments were necessary to confirm the real uptake of MT. The suppression of MitoT at 4°C and the detection of only human‐specific mitochondrial genes (qPCR) but no human β2‐microglobulin genes in murine UC‐MSC‐co‐cultured murine lymphoid cells confirmed the mediation of an energy‐dependent process, not attributable to cell fusion nor dye‐related artifact. MT trafficking was found to be independent of pre‐conditioning, pro‐inflammatory, or anti‐oxidant treatment of MSCs or mitogen stimulation of target PBMCs.
Mesenchymal stem cells are known to establish tunneling nanotube connections (TNTs) with target cells, including cardiomyocytes, endothelial cells, and tumor cells 12. Also, TNT formation was described between MSCs and macrophages leading to an enhanced phagocytosis activity 6. For this reason, we tested the effect of cytochalasin D, an inhibitor of TNT formation in the co‐culture condition, finding no interference of the inhibitor on the levels of MitoT. Mindful of other possible mechanisms sustaining MitoT, including gap junctions, hemi‐channels, and macropinocytosis, and corresponding inhibitors such as lanthanum III chloride hydrate, carbenoxolone, and EIPA ((5′N‐ethyl‐N‐isopropyl) amiloride) were used, with MitoT remaining unaffected. Phinney et al 14 described the use of extracellular vesicles (EVs) by MSCs to shuttle MT, that were subsequently engulfed by macrophages, resulting in increased macrophage bioenergetics. In consideration of this finding, PBMCs were incubated with conditioned media from MitoTracker‐labeled MSCs; nonetheless, no MitoT was detected. Probably, certain signals from recipient cells that trigger this phenomenon remain necessary. In this regard, a recent study described MT transfer mediated by the adhesion molecule ICAM‐1 between Jurkat cells and MSCs, where treatment with a neutralizing antibody against ICAM‐1 led to partial inhibition of MitoT 15. In contrast with our results, Wang et al 15 showed that while both ALL T cells and Jurkat cells can transfer MT to MSCs, they receive almost no MT from MSCs, resulting in chemoresistance. Within our experimental setting, we also observed a unidirectional transfer; however, contrariwise to the above study, MitoT was uniquely observed from MSCs to PBMCs. This divergence in the direction of the transfer can be due to the tumoral nature of the cells used in the Wang et al study in comparison with the primary cells we used from healthy individuals. Future research should explore the existence of a two‐way transfer of MT among MSCs and PBMCs, from donors of different disease conditions, and how these parameters affect MitoT efficiency. In vivo, we could also evidence the natural transfer of MT in response to intraperitoneal infusion of MSCs in immune‐competent mice. To overcome the limitation of dye fading in this case, the use of cells with a stable MT reporter 16 will allow improved monitoring of this phenomenon, including more precise quantitation of biodistribution and fate at longer time points.
Since active and functional MT are able to maintain an electrochemical gradient, known as the MMP, we demonstrated the functionality of our isolated MT from UC‐MSCs using MitoTracker Red CMXRos and TMRM, both dyes accumulate in active MT with an intact MMP, as well as measurement of ATP production, as previously reported by other groups 7, 17, 18, 19. We then assayed functional changes resulting from the MitoT to CD3+ T cells including the effect on proliferation, metabolism, migration, and differentiation. While no direct effect was observed on proliferation, preliminary metabolic analysis of MitoTpos PBMCs revealed a decrease in maximum respiration compared with MitoTneg cells. Regarding lymphocytes, it has been shown that effector T cells have a substantially lower maximal respiration than memory T cells 2, 20, suggesting that T cells may enter in an activated state when mitocepted. Additionally, MitoTpos cells displayed a 50% increase in the glycolytic/OXPHOS ratio, which is a hallmark of T‐cell activation 21, 22. Activated MitoTpos CD3+ cells also showed significant increases in migration capacity compared with MitoTneg cells. MT localization and fission have been reported to positively affect migration, suggesting a role in breast cancer metastasis 23. MT are also implicated in lymphocyte adhesion, polarity, and migration, in correlation with the expression of Miro‐1, an adaptor molecule that couples MT to microtubules 24.
To further encompass a wider range of functional changes related to MitoT, transcriptome analysis was performed on sorted T CD3+ populations, according to MT uptake. Bioinformatic analysis on the two distinct populations (MitoTpos and MitoTneg) showed that the most significant changes in mRNA expression levels were found in Treg activation pathways, including FOXP3, IL2RA, CTLA4, and TGF‐β1. Indeed, naïve MitoTpos‐sorted T cells were driven toward a CD127lowCD25+FoxP3+ (Treg) suppressor phenotype as opposed to MitoTneg cells (fold change of 14). Thus, the displayed evidence points to the independent capability of MitoT to curb pro‐inflammatory T cells while directing cell fate toward a Treg phenotype in vitro, even in the absence of the exogenous cytokine stimulation usually required for such T‐cell differentiation. In 2013, our group had demonstrated that MSCs are able to generate a CD4+CD25+Foxp3+ Treg population, even during the differentiation process of Th1 and Th17 cells 25. Many mechanisms behind this observation have been forwarded since, including ubiquitination 26, jagged‐1‐dependent pathway 27, and miRNA modulation 28 resulting in the induction of stable expression of Foxp3. Herein, we unexpectedly identified a novel mechanism of Treg induction by MSCs based on MitoT alone.
While MT are critically involved in the regulation of T‐cell activation, differentiation, and expansion, they are also involved in modulating signaling in T cells through different mechanisms including mitonuclear communication induced by the hormetic response (mitohormesis). The metabolism changes rely in a variety of signals among which are MT dynamics, mROS, and metabolite and mitokines production. These MT‐derived metabolites may provide signals for the activation and differentiation toward a Treg fate. Indeed, one report has shown that S‐2‐hydroxyglutarate (S‐2HG) acts as an immunometabolite, driving the T‐cell differentiation through epigenetic changes that alter the gene expression profile 29. Future metabolomic investigation is required to determine the effect of MitoT on immunometabolite changes that affect T‐cell fate.
Additionally, MitoT might also induce a retrograde MT‐to‐nuclear signaling. This feedback transmits mitochondrial signals such as transcription factors leading to changes in nuclear gene expression and a reconfiguration of metabolism to accommodate cells to MT status changes. While much is still unknown about such signaling pathways in mammalian cells; recently, sirtuin (SIRT) and G‐protein pathway suppressor 2 (GPS2) were identified as a molecular mediator of mitochondrial retrograde communication. Their transcriptional activity is in fact directly regulated by the MT functional status through regulated MT‐to‐nucleus translocation 30. Furthermore, GPS2 activity has recently been reported to play a role in B‐cell development also 31. Future directions related to this work will consider evaluating the effect of GPS2 in the context of MitoT while establishing the possible correlation with the activation of the FOXP3 pathway.
In addition to our transcriptomic data, cell phenotyping also sheds some light on the resultant cell type, since we found increased CD25+ICOS+ cells, with decreased CCR7 expression.
A CD4+CD25+ Treg subpopulation characterized by an ICOS+FoxP3+ phenotype has been identified among Treg cells 32, 33 featuring a highly and more efficient suppressive capacity compared with its ICOSneg counterpart 10, 34. ICOS+ Treg cells have been directly related to a higher expression of cytotoxic T‐lymphocyte‐associated protein 4 (CTLA‐4), essential in Treg generation 35, 36, and stabilization of the expression of FoxP3 10, 37. CCR7 is described as a potent chemotactic receptor 38, under inflammatory conditions, and the activation of quiescent Treg cells results in the loss of CCR7 marker, allowing newly activated Treg cells to redistribute to inflamed sites 9, 39, 40. Interestingly, the maintenance of CCR7 low‐activated Treg cells in non‐lymphoid organs depended on the ICOS pathway 9 that we also found upregulated in response to MitoT.
The action of CD4+CD25+Foxp3+ Tregs is pivotal in the prevention and treatment of acute GVHD, both in animal models 41 and in clinical settings 42. The expression of inhibitory CTLA‐4 molecules, lymphocyte‐activation gene 3 (LAG‐3), and neuropilin‐1 contribute to the inhibition of co‐stimulatory markers resulting in decreased proliferation of T cells 43. This is convergent with the results in our in vivo xeno‐GVHD disease model in response to MitoTpos cell disease induction as compared to non‐treated cells, showing significant improvements in survival and weight loss, and reduction in tissue damage (lung, liver, and gut) and organ infiltrating CD4+, CD8+ (P < 0.05), and IFN‐γ+ cells (P < 0.0001). These results substantiate that MitoT of MSCs into T cells is able to modulate the pro‐inflammatory signature of T cells, inducing functional Treg cells in vivo and prompting a diminished pro‐inflammatory state that leads to beneficial clinical effect. This was associated with significantly higher number of Paneth cells per crypt (1.6‐fold) in mice receiving PBMC‐MitoT, also in line with the fact that the number of Paneth cells located in the base of intestinal crypts has been inversely correlated with the outcome and severity of clinical GVHD 44, 45. Thus, the increased survival rate of GVHD animals induced by mitocepted PBMCs is convergent with the in vitro effects of MitoT, the transcriptomic profile of target cells, and the phenotypic profile of the resultant Treg cell.
In summary, this study reports for the first time the natural and artificial horizontal transfer of MSC‐derived MT to human T‐cell populations. We also provide evidence that MitoT alone was self‐sufficient for inducing Treg cell differentiation with no need for the release of other paracrine factors or exosomes, when target cells were subjected to a Mitoception protocol. Furthermore, mitocepted disease‐inducing cells regulated the inflammatory response and tissue damage leading to improved survival in a GVHD pre‐clinical model. These findings point at a new mechanism for MSC‐mediated control of immune‐mediated diseases based on MitoT from MSCs to immunocompetent cells. In conclusion, we demonstrated that mitocepted T cells undergo distinct metabolic reprogramming and propose that promoting Treg induction may represent a promising strategy to control inflammatory immune‐mediated diseases epitomized by GVHD. While shedding light on this new immunoregulatory mechanism, our findings offer strategies to improve cell‐based therapies or eventual cell‐free therapeutic approaches.
Materials and Methods
Cell isolation and culture
Peripheral blood samples were collected from healthy donors, previous informed consent, and Ficoll‐Paque PLUS density gradient media was used for the isolation of mononuclear cells (PBMCs). UC‐MSC, bone marrow (BM), and menstrual (Mens)‐derived MSCs were cultured, expanded, and fully characterized according to international guidelines, as previously described 46, 47 (Table EV1). All the experiments were performed using MSCs at early passages (P3–P7) and fresh PBMC cultured with 10% FBS, 1% Pen/Strep, 1% sodium pyruvate, 1% non‐essential amino acids, 1% glutamine, and 25 μM β‐mercaptoethanol in RPMI media (lymphocyte media). When indicated, UC‐MSCs were pre‐activated for 24 h with 20 ng/ml of IFN‐γ and 10 ng/ml of IL‐1β, as previously described 48, 49 or incubated over night with increasing concentrations of the anti‐oxidant pterostilbene (Ptsb). All the procedures presented in this work were approved by the Ethics Committee of Universidad de los Andes.
Co‐culture assay and flow cytometry analysis
Umbilical cord‐MSCs were labeled the day before the experiments with MitoTracker Green FM, MitoTracker Red CMXRos, or MitoTracker Deep Red FM (Molecular Probes, Eugene, OR, USA), according to manufacturer's instruction, and plated using 48‐well plates. For co‐culture assays, different MSC:PBMC ratios were used, and after UC‐MSC media was removed, 5 × 10⁵ freshly isolated PBMCs were plated on top of the MSCs with the lymphocyte media as mentioned above. After 24 h, cells were collected, washed with PBS, and, when indicated, stained at 4°C for 20 min using specific antibodies for human CD45‐PECy7 (#557748, 1:100), CD3‐APC (#555335, 3:100), CD19‐V450 (#644491, 1:200), and CD56‐APC (#555518, 3:100) from BD Biosciences (Franklin Lakes, NJ, USA); and CD4‐PECy7 (#317414, 1:500) and CD8‐PECy5.5 (#301032, 3:100) from BioLegend (San Diego, CA, USA). In control experiments, MSCs were also stained with either anti‐CD90‐PECy7 antibody (#561558, 1:50 from BD Biosciences) or CTV dye (Thermo Fisher Scientific, Waltham, MA, USA), according to manufacturer's instruction. For T‐cell differentiation assays, cells were stained with specific surface antibodies against human CD127‐V450 (#560823, 1:100, BD Biosciences), CD25‐PerCPCy5.5 (#560503, 1:50, BD Biosciences), CD278 (ICOS)‐APC (#313509, 1:500, BioLegend), and CD197 (CCR7)‐Pacific blue (#353209, 1:100, BioLegend). For intracellular staining, cells were fixed at 4°C with the forkhead box P3 (FoxP3) staining buffer set (eBioscience Inc, San Diego, CA, USA) and then incubated for 30 min with anti‐FoxP3‐PE (#12477442, 1:100), anti‐IFN‐γ‐APC‐eFluor 780 (1:100; eBioscience), or anti‐IL‐17‐PerCP‐Cy5.5 (#560799, 1:100, BD Biosciences). For humanized xenogenic‐GVHD mouse model experiments, cells were stained with CD45‐PerCP (#347464, 1:100), CD8‐PE (#555367, 1:100), CD25‐PerCP‐Cy5.5 (#560503, 1:100), and IFN‐γ Alexa Fluor 488 (#557718, 1:100) from BD Biosciences, and CD4‐PECy7 (#317414, 1:300, BioLegend) and FoxP3‐FITC (#11477741, 1:100) from eBioscience. After staining, cells were washed and labeled with the near‐IR or yellow fluorescent reactive dye for cell viability (Live/Dead Fixable Near‐IR or Yellow Dead Stain Kit, from Thermo Fisher Scientific). Data were acquired using FACS Canto II and analyzed with the FlowJo software.
Microscopy
Confocal microscopy of live PBMCs after co‐culture with MSCs was done with a Carl Zeiss LSM 700 confocal laser system. MSC‐MT were labeled with MitoTracker Green, and PBMCs were stained with a lymphoid‐specific antibody for human CD3‐Alexa Fluor 647 (#300422, 1:25 from BioLegend). Confocal microscopy of fixed co‐cultures or mitocepted PBMCs was performed with a Leica TCS SP8 confocal laser system using MitoTracker Green for staining MSC‐MT and MitoTracker Red CMXRos to label endogenous PBMC MT. Cells were seeded on a cover slide previously coated with poly‐lysine (Sigma‐Aldrich, St. Louis, MO, USA). After 3 h of co‐culture or 24 h post‐mitoception, cells were fixed in 10% formalin solution (Sigma‐Aldrich), stained with DAPI or Hoechst (nuclear staining), and mounted with Dako fluorescent mounting medium (Dako North America Inc., CA, USA).
Transmission electron microscope images were taken with a Philips Tecnai 12 Biotwin TEM Electron Microscope. Mitoception was performed on freshly isolated PBMCs, and FACS‐sorted CD3+ MitoTneg and MitoTpos T cells were fixed with fresh glutaraldehyde solution. Samples were then processed at the Advanced Microscopy Unit at the Pontificia Universidad Católica de Chile.
DNA and RNA extraction, and quantitative RT–PCR
Total DNA was isolated from human UC‐MSC, mouse spleen cells from MRL/MpJ mice (The Jackson Laboratory, Bar Harbor, ME, USA), or FACS‐sorted CD45+ previously co‐cultured mouse spleen cells, using QIAamp DNA Mini Kit (Qiagen, Hilden, Germany), following the manufacturer's instructions. qPCR was performed in duplicate on a Stratagene Mx3000P with the use of Brilliant II SYBR Green Master Mix (Agilent Technologies, Santa Clara, CA, USA). For whole‐genome RNA‐Seq analyses and qRT–PCR, total RNA was isolated from 500,000 FACS‐sorted CD3+ MitoTpos or CD3+ MitoTneg cells, previously resuspended in RLT lysing buffer (Qiagen, Hilden, Germany), using RNeasy Micro Kit from Qiagen and following the manufacturer's recommendations. Complementary DNA was prepared in a reverse‐transcription reaction using 200–250 ng of RNA and SuperScript II Reverse Transcriptase (Thermo Fisher Scientific). Five nanogram of template mRNA and 5 μM of each forward and reverse human‐specific primers (Table EV2) were used. Data were expressed as relative gene expression or fold mRNA expression using the 2‐∆Ct method and normalized to β‐actin housekeeping gene.
In vivo mitochondrial transfer
MitoT from human MSCs to murine lymphoid cells was assessed using a BALB/c mouse model. Animals were kept at specific pathogen‐free animal facility of Universidad de los Andes with water and food ad libitum, according to international guidelines for animal care and protocols approved by the Institutional Animal Care and Use Committee (ARRIVE Guidelines Animal Research) and approved by the local animal care committee (number CEC201729, June 30, 2017). Mice were firstly immunized using an intraperitoneal injection of CFA emulsion (100 μl of CFA suspension diluted 1:1 in PBS 1×). At 24 h post‐immunization, mice were intraperitoneally injected with 5 × 10⁶ human UC‐MSCs, previously stained with MitoTracker Green, as described above. Euthanasia was performed 24 h after cell injection, and mouse organs were collected and mechanically disrupted for cell extraction in PBS 1× supplemented with 2% FBS and 2 mM EDTA. Cells were stained using a specific antibody for human CD90‐Pacific Blue (#561558, 1:100, BD Biosciences) and labeled with the live/dead near‐IR fluorescent dye (as described above). Data were acquired using a FACS Canto II, and total leukocyte population was analyzed with the FlowJo software.
Mitochondria isolation and artificial transfer (Mitoception)
Umbilical cord‐MSC‐MT were isolated using the MT Isolation Kit (Thermo Fisher Scientific) following manufacturer's instructions, from previously MitoTracker‐labeled donor cells. MT preparations were done using a range of 1–10 × 106 MSCs resuspended in the lymphocyte media (as described above) and maintained on ice until the artificial transfer was done (around 2–3 h). Mitoception was performed on PBMCs as previously reported 7, using the amounts of MSC‐MT corresponding to the same cell number ratios used in co‐culture experiments (MSC:PBMC ratios of 1:100, 1:25, and 1:10). The following day, cells were washed with PBS and used for experimental procedures.
Confocal microscopy on isolated MT
Umbilical cord‐MSCs were previously labeled with MitoTracker Red CMXRos (Invitrogen, M7512), according to manufacturer's instruction, and isolated MT were resuspended in lymphocyte media and mounted on a microscope glass slide to be immediately visualized by the confocal microscope Leica Sp8.
Flow cytometry on isolated MT
Isolated MSC‐MT were resuspended in lymphocyte media and stained with 200 nM of tetramethylrhodamine (TMRM; Invitrogen, T668), for 30 min at 37°C. For positive control, isolated MT were previously treated with 0.2 μM of CCCP (carbonyl cyanide 3‐chlorophenylhydrazone; CCCP; C2759, Sigma‐Aldrich) for 5 min at 37°C. MT were gated based on light‐scattering properties in a SSC versus FSC plot, and at least 2,000 events were recorded for each sample using a BD FACS Canto II Flow Cytometer. Histograms showing PE fluorescence were analyzed, and the mean fluorescence intensity (MFI) of each sample was calculated using FlowJo software (version 10).
ATP determination of isolated MT
ATP production was measured using the CellTiter‐Glo® Luminescent Cell Viability Assay (Promega, G7570), according to manufacturer's instruction. Isolated MSC‐MT were resuspended in 50 μl of lymphocyte media and plated in an opaque 96‐well plate. In each sample, 50 μl of CellTiter‐Glo® Reagent was added and the plate was incubated for 30 min at room temperature, followed by a luminescence reading using a BioTek FLx800 microplate reader.
Western blot analysis
CD3+ MitoTpos and CD3+ MitoTneg T cells were FACS‐sorted at 24, 48, and 72 h post‐mitoception with MSC‐MT and resuspended with 50 μl of cold RIPA buffer containing protease/phosphatase inhibitors (Cell Signaling Technology, #5872). Samples were then sonicated for 5 min at high intensity and centrifuged at 16,100 g for 15 min at 4°C to discard cellular debris. Supernatants containing proteins were collected, and protein quantification was performed using the Bradford method following the manufacturer's instructions (Bio‐Rad, #500‐006). Twenty to thirty microgram of total protein was loaded and run in 10% SDS–PAGE gels. Five percent of BSA in PBS‐Tween (0.01%) was used for blocking and primary antibodies were used in a dilution of 1:1,000 prepared in PBS‐Tween (0.01%), over night with agitation at 4°C (all antibodies were purchased from Cell Signaling Technology: α‐OPA1 #67589, α‐MFN1 #14739, α‐MFN2 #9482, α‐DRP1 #14647, α‐phospho‐DRP1 Ser616 #4494, and α‐β‐actin #3700). Secondary fluorescent antibodies were prepared in a dilution of 1:20,000 in 5% BSA in PBS‐Tween (0.01%; secondary antibodies were purchased from Invitrogen: α‐mouse Alexa Fluor 680 #A32729 and α‐rabbit Alexa Fluor 800 #A32735). Finally, fluorescence was detected using Odyssey® CLx and image analysis was made using Image Studio Lite software (version 5.2).
Metabolic measurements by extracellular flux analysis
Live‐cell metabolic measurements of OCR and ECAR were performed with the Seahorse XF24 Flux Analyzer instrument (Seahorse Bioscience, North Billerica, MA, USA), in order to test mitochondrial respiration and glycolysis, respectively. Mitoception was performed on freshly isolated PBMC, and FACS‐sorted CD3+ MitoTneg and MitoTpos cells were plated on a 24‐well plate (500,000–700,000 cells per well, samples run in quadruplicates) with XF buffer. OCR (pmol/min/cell) was measured for 2 h using the following mitochondrial inhibitors: oligomycin (10 μM), FCCP (2.5 μM), antimycin A (20 μM), and rotenone (20 μM). Basal respiration rate was calculated as the difference between basal OCR and OCR after rotenone and antimycin A addition, where maximum respiration rate was measured following inclusion of the uncoupler FCCP.
Extracellular acidification rate (mpH/min/cell) measurements were quantified using glucose (10 mM) and oligomycin (10 μM). Basal glycolysis was calculated as the difference between basal ECAR and ECAR upon glucose addition. All Seahorse measures were normalized to the number of cells counted in each well seeded before Seahorse experiments.
Lactate detection assay
l(+)‐Lactate concentrations were measured from supernatants of FACS‐sorted CD3+ MitoTneg and MitoTpos T cells, previously mitocepted with UC‐MSC‐MT, using a commercially available kit from BioVision, Inc. (Milpitas, CA, USA), and following the manufacturer's recommendations. MitoTneg and MitoTpos cells were cultured at 37°C for 24 h in lymphocyte phenol red‐free media. Then, cells were counted, and supernatants were collected and kept at −80°C until fluorometric quantification of lactate was performed.
Transmigration assay
T‐cell migration was evaluated using a 24‐well plate with 3.0‐μm‐pore size Transwell polycarbonate membrane insert (Costar, Kennebunk, ME, USA). Freshly isolated and mitocepted human PBMCs were FACS‐sorted into CD4+ MitoTpos and MitoTneg populations and cultured at 37°C for 3 days with activation media (lymphocyte media with anti‐CD3 [3 μg/ml] and Il‐2 [50 U/ml]), or control media (no cytokines added). Afterward, cells were collected and 150,000 cells in 100 μl of lymphocyte media were seeded on the top chamber of the Transwell wells. The bottom chamber was filled with 600 μl of lymphocyte media to allow transmigration. After 4 h of incubation at 37°C, T cells that had migrated into the bottom chamber were collected and counted under the microscope with trypan blue staining for cell viability.
Proliferation assay
Freshly isolated human PBMCs were mitocepted with UC‐MSC‐MT, stained with CTV dye (as described above), and cultured at 37°C in the presence of 15 μg/ml of phytohaemagglutinin (PHA). After 3–4 days, cells were collected and stained with CD3‐APC (3:100) from BD Biosciences, and labeled with live/dead fixable near‐IR. Similar proliferation rates were measured in FACS‐sorted CD3+ MitoTneg and MitoTpos T cells following 3 h of co‐culture with MitoTracker Green‐labeled UC‐MSC. Both groups were stained with CTV dye and cultured at 37°C for 5 days with CD3/CD28 Dynabeads (1/20; Thermo Fisher Scientific), IL‐2 (50 U/ml), and PHA (15 μg/ml). Data were acquired using FACS Canto II and analyzed with the FlowJo software.
Transcriptome profiling, differential expression analyses, and GSEA
Whole‐genome RNA‐Seq was performed at the DNA Array Core Facility at Scripps Research Institute (CA, USA) using an Illumina NextSeq 500 instrument. Raw reads were trimmed with the clipping of the first 10 bases in each extremity using Trimmomatic version 0.36 50 when their quality average falls below the quality threshold of Q < 30. A five‐base sliding window quality filtering was also performed, eliminating reads when the average quality of a window fells bellow Q < 30. Reads shorter than 15 nt after trimming were discarded, and the resulted clean data were mapped to the human genome GRCh38 51 using HISAT2 version 2.0.5 52. SAM files generated on the mapping process were used as input to the Cufflinks protocol described by Trapnell et al 53, in order to obtain DE genes, using the GTF annotation file recovered from Ensembl database for the human genome GRCh38 51. Transcripts were considered as statistically DE when presenting a fold change bigger to 1.5 and a P‐value smaller than 0.05. Web‐based Enrichr bioinformatics tool 54 was used to identify gene ontology terms for the DE genes. We used webCEMiTool (https://www.ncbi.nlm.nih.gov/pmc/articles/PMC6414412/) with standard parameters to identify co‐expressed modules in the RNA‐Seq data, and to perform GSEA, as well as the over‐representation of identified gene modules. The sets of functional categories were provided by webCEMiTool and Molecular Signatures Database (MSigDB) 55.
T‐cell differentiation assays
Freshly isolated human PBMCs were mitocepted with MT from different sources, including UC‐MSC, fibroblast, or PBMCs. Following Mitoception protocol was described above, and cells were collected and stained at 4°C for 30 min with antibodies against CD4‐PECy7 (1:500; BioLegend), CD45RA‐V450, and CD45RO‐APC (1:200; both from BD Biosciences). Then, MitoTpos and MitoTneg CD4+ naïve cells (CD45RA+CD45RO− population) were FACS‐sorted and cultured at 37°C for 5–7 days on Treg induction/differentiation media: lymphocyte media with human anti‐CD3 (3 μg/ml), IL‐2 (50 U/ml), and TGF‐β1 (10 ng/ml) or cultured on plain media (lymphocyte media with no cytokines added). Afterward, cells were collected and analyzed for Treg or for effector Th1 and Th17 lymphocyte differentiation by FACS analysis described above.
Immunosuppression assay
FACS‐sorted CD4+ naïve MitoTneg and MitoTpos cells previously cultured in Treg induction/differentiation media (as mentioned above for T‐cell differentiation assays) were co‐cultured, for 5–7 days at 37°C with freshly isolated and CTV‐stained PBMCs from a new donor (described above), in lymphocyte media supplemented with PHA (15 μg/ml). Two different ratios of MitoT cells:PBMC were tested (1:1 and 2:1). Following co‐culture, cells were collected and stained for FACS analysis, as described above. Proliferation rate and percentage of immunosuppression were analyzed with FlowJo software, looking at CTV+CD3+ populations. For immunosuppression analysis, the division index was calculated for each condition and values were obtained following the equation: 1 − (Div. Index/Div. Index control) * 100.
Humanized xenogenic‐GVHD mouse model
NOD‐scid IL2rcnull (NSG) mice from The Jackson Laboratory (Bar Harbor, ME, USA) were kept at specific pathogen‐free animal facility of Universidad de los Andes with water and food ad libitum, according to international guidelines for animal care and protocols approved by the Institutional Animal Care and Use Committee (ARRIVE Guidelines Animal Research) and approved by the local animal care committee (number CEC201729, June 30, 2017). Ten‐ to twelve‐week‐old mice were irradiated using a dose of 2 Gy at the Chilean Commission for Nuclear Energy Facilities. At 24 h post‐irradiation, animals were randomized and injected through the tail vein with 12 × 106 mitocepted or control (same donor) human PBMCs obtained from buffy coats of healthy donors as described above. The onset of the GVHD progression occurs typically 7 days post‐PBMC injection. Euthanasia of mice was performed at day 8–9 for immunological analysis by FACS, and at day 14 for histological analysis, or when a total body weight loss was > 20% of original starting weight. Target organs including spleen, liver, and lung were harvested from each group for specific human immunophenotypic, no blinding, analysis (see flow cytometry analysis section), in order to detect the presence of human pro‐inflammatory and anti‐inflammatory lymphocytes within the mouse tissue samples by FACS.
Histopathological analysis
Liver, SI, and lung samples from GVHD mice were harvested 14 days after PBMC injection, fixed in 4% paraformaldehyde, and embedded in paraffin. Five‐μm‐thick sections were processed for hematoxylin–eosin and Masson's trichrome staining for detailed histological examination. Coded slides were examined systematically, in a blinded fashion, using a semi‐quantitative scoring system for pathological alterations known to be associated with GVHD 56, 57, 58, 59, 60. The severity of histopathological changes in the lung was scored using two parameters: periluminal inflammatory cell infiltrates (around airways/vessels) and pneumonitis (alveolar/interstitial), following the system described by Cooke et al 56. Briefly, the pathology score for each parameter was generated by multiplying the severity grade (0–3) by the extent of involvement (5–25% = 1; > 25–50% = 2; > 50% = 3; range of 0–9 in each parameter). A total lung pathology score was finally calculated by adding the pathology scores for pneumonitis and periluminal infiltrate (range of 0–18). On the other hand, seven parameters were scored for SI (villous blunting, crypt regeneration, loss of enterocyte brush border (ulceration), luminal sloughing of cellular debris, pyknotic crypt cells, outright crypt destruction, and lamina propria inflammatory cell infiltrate) and 11 parameters for liver (portal tract expansion by an inflammatory cell infiltrate, collagen depositions, bile duct infiltrate, intraepithelial cells (nuclear multilayering), pyknotic duct cells, vascular endothelialitis, hepatocellular necrosis, acidophil bodies, microabscesses, mitotic figures, and steatosis). The scoring system for each parameter ranged from 0 to 4 and denoted 0 as normal; 0.5 as focal and rare; 1 as focal and mild; 3 as diffuse and moderate; and 4 as diffuse and severe, as previously published 58, 59. Scores for each parameter were added to provide a total score for each organ; thus, the maximum pathology score for small intestine was 28 and for liver 44. In addition, in small intestine samples, at least 50 crypts per mouse were observed under high‐magnification microscopy (100×) to count Paneth cells.
Ex vivo mitochondrial transfer
Mitochondria from human UC‐MSCs to murine cells from lymph nodes and spleen was assessed ex vivo using a SLE (MRL/MpJ/Fas) and a healthy control (MRL/MpJ) mouse models from The Jackson Laboratory. Animals were kept at specific pathogen‐free animal facility of Universidad de los Andes with water and food ad libitum, according to international guidelines for animal care and protocols approved by the Institutional Animal Care and Use Committee (ARRIVE Guidelines Animal Research) and approved by the local animal care committee (number CEC201729, June 30, 2017). UC‐MSCs were labeled the day before the experiments with MitoTracker Green FM and plated using 48‐well plates. Mouse organs were collected and mechanically disrupted for cell extraction in PBS 1× supplemented with 2% FBS and 2 mM EDTA. Co‐culture assays were performed at 1:16 MSC:PBMC ratio, and after UC‐MSC media were removed, 5 × 10⁵ freshly isolated mouse cells were plated on top of the MSCs. After 24 h, cells were collected, washed with PBS, and stained at 4°C for 20 min using specific antibodies for mouse CD45‐PECy7 (#103114, 2:100; BioLegend) and CD3‐APC (#100236, 3:100; BioLegend), and labeled with the live/dead near‐IR fluorescent dye (as described above). Data were acquired using a FACS Canto II, and MitoT was analyzed with the FlowJo software.
Statistics
Statistical analyses were performed with the aid of Microsoft Excel and GraphPad Prism, and the results were expressed as mean ± SEM, as indicated in the figure legends. The unpaired, two‐tailed, Student's t‐test was performed to compare two mean values, and P < 0.05 was considered statistically significant. For RNA‐Seq analysis, transcripts were considered as statistically DE when presenting a fold change bigger to 1.5 and a P‐value smaller than 0.05.
Author contributions
FEF, PL‐C, ACC, KP‐L, and MKh contributed to the conception of the study and experimental design. ACC, AL‐G, PL‐C, and EP performed the experiments, data analysis, and participated in the acquisition of data. VA‐T, MKu, and VM‐C performed transcriptome profiling, and whole gene expression and pathway analysis. LFB and RE‐V carried out the histopathology analysis, providing images and analysis. RAC and MIO assisted in mouse experiments and data analysis. FEF and MKh prepared the manuscript. All the authors critically revised the manuscript and provided help with interpretation of data. The final manuscript was read and approved by all authors.
Conflict of interest
Maroun Khoury is the CSO of Cells for Cells and Regenero, and Angela Court and Alice LeGatt received stipends from Regenero. The other authors declare that they have no conflict of interest.
Supporting information
Expanded View Figures PDF
Table EV1
Table EV2
Review Process File
Acknowledgements
The authors would like to specially thank Andres Caicedo (Universidad San Francisco de Quito) for scientific assistance regarding the Mitoception protocol, Alex Cabrera, Hector Andrés Ramirez, and Yessia Hidalgo (C4C‐Regenero Flow Cytometry Facility) for assistance with flow cytometry and cell sorting, Macarena Ocaña and Claudia Rubí (C4C‐Regenero Animal Facility) for technical expertise and assistance in the in vivo experiments, Álvaro Elorza (Universidad Andrés Bello) for Seahorse services, and also the members of the C4C laboratory for support and helpful discussion. This work was supported by grants from National Agency for Investigation and Development: ANID (Agencia Nacional de Investigación y Desarrollo) previously branded as the Chilean National Commission for Scientific and Technological Investigation‐CONICYT [FONDECYT regular #1170852, FONDAP‐CONICYT #15130011, and PAI‐CONICYT #PAI79170021].
EMBO Reports (2020) 21: e48052
Contributor Information
Fernando E Figueroa, Email: ffigueroa@uandes.cl.
Maroun Khoury, Email: mkhoury@uandes.cl.
Data availability
The datasets (and computer code) produced in this study are available in the following databases: RNA‐Seq data: Gene Expression Omnibus GSE140483 (https://www.ncbi.nlm.nih.gov/geo/query/acc.cgi?acc=GSE140483).
References
- 1. Chang C‐H, Curtis JD, Maggi LB Jr, Faubert B, Villarino AV, O'Sullivan D, Huang SC‐C, van der Windt GJW, Blagih J, Qiu J et al (2013) Posttranscriptional control of T cell effector function by aerobic glycolysis. Cell 153: 1239–1251 [DOI] [PMC free article] [PubMed] [Google Scholar]
- 2. Buck MD, O'Sullivan D, Klein Geltink RII, Curtis JDD, Chang CH, Sanin DEE, Qiu J, Kretz O, Braas D, van der Windt GJJW et al (2016) Mitochondrial dynamics controls T cell fate through metabolic programming. Cell 166: 63–76 [DOI] [PMC free article] [PubMed] [Google Scholar]
- 3. Spees JL, Olson SD, Whitney MJ, Prockop DJ (2006) Mitochondrial transfer between cells can rescue aerobic respiration. Proc Natl Acad Sci USA 103: 1283–1288 [DOI] [PMC free article] [PubMed] [Google Scholar]
- 4. Singer NG, Caplan AI (2011) Mesenchymal stem cells: mechanisms of inflammation. Annu Rev Pathol 6: 457–478 [DOI] [PubMed] [Google Scholar]
- 5. Ahmad T, Mukherjee S, Pattnaik B, Kumar M, Singh S, Rehman R, Tiwari BK, Jha KA, Barhanpurkar AP, Wani MR et al (2014) Miro1 regulates intercellular mitochondrial transport & enhances mesenchymal stem cell rescue efficacy. EMBO J 33: 994–1010 [DOI] [PMC free article] [PubMed] [Google Scholar]
- 6. Jackson MV, Morrison TJ, Doherty DF, McAuley DF, Matthay MA, Kissenpfennig A, O'Kane CM, Krasnodembskaya AD (2016) Mitochondrial transfer via tunneling nanotubes is an important mechanism by which mesenchymal stem cells enhance macrophage phagocytosis in the in vitro and in vivo models of ARDS. Stem Cells 34: 2210–2223 [DOI] [PMC free article] [PubMed] [Google Scholar]
- 7. Caicedo A, Fritz V, Brondello JM, Ayala M, Dennemont I, Abdellaoui N, De Fraipont F, Moisan A, Prouteau CA, Boukhaddaoui H et al (2015) MitoCeption as a new tool to assess the effects of mesenchymal stem/stromal cell mitochondria on cancer cell metabolism and function. Sci Rep 5: 9073 [DOI] [PMC free article] [PubMed] [Google Scholar]
- 8. Ren G, Zhang L, Zhao X, Xu G, Zhang Y (2008) Mesenchymal stem cell‐mediated immunosuppression occurs via concerted action of chemokines and nitric oxide. Cell Stem Cell 2: 141–150 [DOI] [PubMed] [Google Scholar]
- 9. Smigiel KS, Richards E, Srivastava S, Thomas KR, Dudda JC, Klonowski KD, Campbell DJ (2014) CCR7 provides localized access to IL‐2 and defines homeostatically distinct regulatory T cell subsets. J Exp Med 211: 121–136 [DOI] [PMC free article] [PubMed] [Google Scholar]
- 10. Ukena SN, Höpting M, Velaga S, Ivanyi P, Grosse J, Baron U, Ganser A, Franzke A (2011) Isolation strategies of regulatory T cells for clinical trials: phenotype, function, stability, and expansion capacity. Exp Hematol 39: 1152–1160 [DOI] [PubMed] [Google Scholar]
- 11. Romano M, Tung SL, Smyth LA, Lombardi G (2017) Treg therapy in transplantation: a general overview. Transpl Int 30: 745–753 [DOI] [PubMed] [Google Scholar]
- 12. Vignais ML, Caicedo A, Brondello JM, Jorgensen C (2017) Cell connections by tunneling nanotubes: effects of mitochondrial trafficking on target cell metabolism, homeostasis, and response to therapy. Stem Cells Int 2017: 6917941 [DOI] [PMC free article] [PubMed] [Google Scholar]
- 13. Chen J, Wang Q, Feng X, Zhang Z, Geng L, Xu T, Wang D, Sun L (2016) Umbilical cord‐derived mesenchymal stem cells suppress autophagy of T cells in patients with systemic lupus erythematosus via transfer of mitochondria. Stem Cells Int 2016: 4062789 [DOI] [PMC free article] [PubMed] [Google Scholar]
- 14. Phinney DG, Di Giuseppe M, Njah J, Sala E, Shiva S, St Croix CM, Stolz DB, Watkins SC, Di YP, Leikauf GD et al (2015) Mesenchymal stem cells use extracellular vesicles to outsource mitophagy and shuttle microRNAs. Nat Commun 6: 8472 [DOI] [PMC free article] [PubMed] [Google Scholar]
- 15. Wang J, Liu X, Qiu Y, Shi Y, Cai J, Wang B, Wei X, Ke Q, Sui X, Wang Y et al (2018) Cell adhesion‐mediated mitochondria transfer contributes to mesenchymal stem cell‐induced chemoresistance on T cell acute lymphoblastic leukemia cells. J Hematol Oncol 11: 11 [DOI] [PMC free article] [PubMed] [Google Scholar]
- 16. Hodneland Nilsson LI, Nitschke Pettersen IK, Nikolaisen J, Micklem D, Avsnes Dale H, Vatne Røsland G, Lorens J, Tronstad KJ (2015) A new live‐cell reporter strategy to simultaneously monitor mitochondrial biogenesis and morphology. Sci Rep 5: 17217 [DOI] [PMC free article] [PubMed] [Google Scholar]
- 17. Mattiasson G (2004) Flow cytometric analysis of isolated liver mitochondria to detect changes relevant to cell death. Cytometry 60: 145–154 [DOI] [PubMed] [Google Scholar]
- 18. Cossarizza A, Ceccarelli D, Masini A (1996) Functional heterogeneity of an isolated mitochondrial population revealed by cytofluorometric analysis at the single organelle level. Exp Cell Res 222: 84–94 [DOI] [PubMed] [Google Scholar]
- 19. Kim MJ, Hwang JW, Yun CK, Lee Y, Choi YS (2018) Delivery of exogenous mitochondria via centrifugation enhances cellular metabolic function. Sci Rep 8: 3330 [DOI] [PMC free article] [PubMed] [Google Scholar]
- 20. van der Windt GJW, Everts B, Chang CH, Curtis JD, Freitas TC, Amiel E, Pearce EJ, Pearce EL (2012) Mitochondrial respiratory capacity is a critical regulator of CD8+ T cell memory development. Immunity 36: 68–78 [DOI] [PMC free article] [PubMed] [Google Scholar]
- 21. Pearce EL (2010) Metabolism in T cell activation and differentiation. Curr Opin Immunol 22: 314–320 [DOI] [PMC free article] [PubMed] [Google Scholar]
- 22. Patsoukis N, Bardhan K, Weaver J, Herbel C, Seth P, Li L, Boussiotis VA (2016) The role of metabolic reprogramming in T cell fate and function. Curr Trends Immunol 17: 1–12 [PMC free article] [PubMed] [Google Scholar]
- 23. Zhao J, Zhang J, Yu M, Xie Y, Huang Y, Wolff DW, Abel PW, Tu Y (2013) Mitochondrial dynamics regulates migration and invasion of breast cancer cells. Oncogene 32: 4814–4824 [DOI] [PMC free article] [PubMed] [Google Scholar]
- 24. Morlino G, Barreiro O, Baixauli F, Robles‐Valero J, Gonzalez‐Granado JM, Villa‐Bellosta R, Cuenca J, Sanchez‐Sorzano CO, Veiga E, Martin‐Cofreces NB et al (2014) Miro‐1 links mitochondria and microtubule dynein motors to control lymphocyte migration and polarity. Mol Cell Biol 34: 1412–1426 [DOI] [PMC free article] [PubMed] [Google Scholar]
- 25. Luz‐Crawford P, Kurte M, Bravo‐Alegría J, Contreras R, Nova‐Lamperti E, Tejedor G, Noël D, Jorgensen C, Figueroa F, Djouad F et al (2013) Mesenchymal stem cells generate a CD4+CD25+Foxp3+ regulatory T cell population during the differentiation process of Th1 and Th17 cells. Stem Cell Res Ther 4: 65 [DOI] [PMC free article] [PubMed] [Google Scholar]
- 26. Khosravi M, Bidmeshkipour A, Cohen JL, Moravej A, Hojjat‐Assari S, Naserian S, Karimi MH (2018) Induction of CD4+CD25+FOXP3+ regulatory T cells by mesenchymal stem cells is associated with modulation of ubiquitination factors and TSDR demethylation. Stem Cell Res Ther 9: 273 [DOI] [PMC free article] [PubMed] [Google Scholar]
- 27. Cahill EF, Tobin LM, Carty F, Mahon BP, English K (2015) Jagged‐1 is required for the expansion of CD4+CD25+FoxP3+ regulatory T cells and tolerogenic dendritic cells by murine mesenchymal stromal cells. Stem Cell Res Ther 6: 19 [DOI] [PMC free article] [PubMed] [Google Scholar]
- 28. Khosravi M, Karimi MH, Hossein Aghdaie M, Kalani M, Naserian S, Bidmeshkipour A (2017) Mesenchymal stem cells can induce regulatory T cells via modulating miR‐126a but not miR‐10a. Gene 627: 327–336 [DOI] [PubMed] [Google Scholar]
- 29. Tyrakis PA, Palazon A, Macias D, Lee KL, Phan AT, Veliça P, You J, Chia GS, Sim J, Doedens A et al (2016) S‐2‐hydroxyglutarate regulates CD8+ T‐lymphocyte fate. Nature 540: 236–241 [DOI] [PMC free article] [PubMed] [Google Scholar]
- 30. Cardamone MD, Tanasa B, Cederquist CT, Huang J, Mahdaviani K, Li W, Rosenfeld MG, Liesa M, Perissi V (2018) Mitochondrial retrograde signaling in mammals is mediated by the transcriptional cofactor GPS2 via direct mitochondria‐to‐nucleus translocation. Mol Cell 69: 757–772.e7 [DOI] [PMC free article] [PubMed] [Google Scholar]
- 31. Lentucci C, Belkina AC, Cederquist CT, Chan M, Johnson HE, Prasad S, Lopacinski A, Nikolajczyk BS, Monti S, Snyder‐Cappione J et al (2017) Inhibition of Ubc13‐mediated ubiquitination by GPS2 regulates multiple stages of B cell development. J Biol Chem 292: 2754–2772 [DOI] [PMC free article] [PubMed] [Google Scholar]
- 32. Ito T, Hanabuchi S, Wang YH, Park WR, Arima K, Bover L, Qin FXF, Gilliet M, Liu YJ (2008) Two functional subsets of FOXP3+ regulatory T cells in human thymus and periphery. Immunity 28: 870–880 [DOI] [PMC free article] [PubMed] [Google Scholar]
- 33. Zheng J, Chan PL, Liu Y, Qin G, Xiang Z, Lam KT, Lewis DB, Lau YL, Tu W (2013) ICOS regulates the generation and function of human CD4+ Treg in a CTLA‐4 dependent manner. PLoS ONE 8: e82203 [DOI] [PMC free article] [PubMed] [Google Scholar]
- 34. Vocanson M, Rozieres A, Hennino A, Poyet G, Gaillard V, Renaudineau S, Achachi A, Benetiere J, Kaiserlian D, Dubois B et al (2010) Inducible costimulator (ICOS) is a marker for highly suppressive antigen‐specific T cells sharing features of TH17/TH1 and regulatory T cells. J Allergy Clin Immunol 126: 280–289 [DOI] [PubMed] [Google Scholar]
- 35. Zeng H, Yang K, Cloer C, Neale G, Vogel P, Chi H (2013) MTORC1 couples immune signals and metabolic programming to establish Treg‐cell function. Nature 499: 485–490 [DOI] [PMC free article] [PubMed] [Google Scholar]
- 36. Liakou CI, Kamat A, Tang DN, Chen H, Sun J, Troncoso P, Logothetis C, Sharma P (2008) CTLA‐4 blockade increases IFN‐producing CD4+ ICOShi cells to shift the ratio of effector to regulatory T cells in cancer patients. Proc Natl Acad Sci USA 105: 14987–14992 [DOI] [PMC free article] [PubMed] [Google Scholar]
- 37. Redpath SA, van der Werf N, Cervera AM, Macdonald AS, Gray D, Maizels RM, Taylor MD (2013) ICOS controls Foxp3+ regulatory T‐cell expansion, maintenance and IL‐10 production during helminth infection. Eur J Immunol 43: 705–715 [DOI] [PMC free article] [PubMed] [Google Scholar]
- 38. Schneider MA, Meingassner JG, Lipp M, Moore HD, Rot A (2007) CCR7 is required for the in vivo function of CD4+ CD25+ regulatory T cells. J Exp Med 204: 735–745 [DOI] [PMC free article] [PubMed] [Google Scholar]
- 39. Campbell JJ, Murphy KE, Kunkel EJ, Brightling CE, Soler D, Shen Z, Boisvert J, Greenberg HB, Vierra MA, Goodman SB et al (2001) CCR7 Expression and memory T cell diversity in humans. J Immunol 166: 877–884 [DOI] [PubMed] [Google Scholar]
- 40. Menning A, Höpken UE, Siegmund K, Lipp M, Hamann A, Huenn J (2007) Distinctive role of CCR7 in migration and functional activity of naive‐ and effector/memory‐like Treg subsets. Eur J Immunol 37: 1575–1583 [DOI] [PubMed] [Google Scholar]
- 41. Taylor PA, Lees CJ, Blazar BR (2002) The infusion of ex vivo activated and expanded CD4+CD25+ immune regulatory cells inhibits graft‐versus‐host disease lethality. Blood 99: 3493–3499 [DOI] [PubMed] [Google Scholar]
- 42. Rezvani K, Mielke S, Ahmadzadeh M, Kilical Y, Savani BN, Zeilah J, Keyvanfar K, Montero A, Hensel N, Kurlander R et al (2006) High donor FOXP3‐positive regulatory T‐cell (Treg) content is associated with a low risk of GVHD following HLA‐matched allogeneic SCT. Blood 108: 1291–1297 [DOI] [PMC free article] [PubMed] [Google Scholar]
- 43. Ramlal R, Hildebrandt GC (2017) Advances in the use of regulatory T‐cells for the prevention and therapy of graft‐vs.‐host disease. Biomedicines 5: 23 [DOI] [PMC free article] [PubMed] [Google Scholar]
- 44. Eriguchi Y, Takashima S, Oka H, Shimoji S, Nakamura K, Uryu H, Shimoda S, Iwasaki H, Shimono N, Ayabe T et al (2012) Graft‐versus‐host disease disrupts intestinal microbial ecology by inhibiting Paneth cell production of α‐defensins. Blood 120: 223–231 [DOI] [PubMed] [Google Scholar]
- 45. Levine JE, Huber E, Hammer STG, Harris AC, Greenson JK, Braun TM, Ferrara JLM, Holler E (2013) Low Paneth cell numbers at onset of gastrointestinal graft‐versus‐host disease identify patients at high risk for nonrelapse mortality. Blood 122: 1505–1509 [DOI] [PMC free article] [PubMed] [Google Scholar]
- 46. Alcayaga‐Miranda F, Cuenca J, Luz‐Crawford P, Aguila‐Díaz C, Fernandez A, Figueroa FE, Khoury M (2015) Characterization of menstrual stem cells: angiogenic effect, migration and hematopoietic stem cell support in comparison with bone marrow mesenchymal stem cells. Stem Cell Res Ther 6: 32 [DOI] [PMC free article] [PubMed] [Google Scholar]
- 47. González PL, Carvajal C, Cuenca J, Alcayaga‐Miranda F, Figueroa FE, Bartolucci J, Salazar‐Aravena L, Khoury M (2015) Chorion mesenchymal stem cells show superior differentiation, immunosuppressive, and angiogenic potentials in comparison with haploidentical maternal placental cells. Stem Cells Transl Med 4: 1109–1121 [DOI] [PMC free article] [PubMed] [Google Scholar]
- 48. Luz‐Crawford P, Torres MJ, Noël D, Fernandez A, Toupet K, Alcayaga‐Miranda F, Tejedor G, Jorgensen C, Illanes SE, Figueroa FE et al (2016) The immunosuppressive signature of menstrual blood mesenchymal stem cells entails opposite effects on experimental arthritis and graft versus host diseases. Stem Cells 34: 456–469 [DOI] [PubMed] [Google Scholar]
- 49. Cuenca J, Le‐Gatt A, Castillo V, Belletti J, Díaz M, Kurte GM, Gonzalez PL, Alcayaga‐Miranda F, Schuh CMAP, Ezquer F et al (2018) The reparative abilities of menstrual stem cells modulate the wound matrix signals and improve cutaneous regeneration. Front Physiol 9: 464 [DOI] [PMC free article] [PubMed] [Google Scholar]
- 50. Bolger AM, Lohse M, Usadel B (2014) Trimmomatic: a flexible trimmer for Illumina sequence data. Bioinformatics 30: 2114–2120 [DOI] [PMC free article] [PubMed] [Google Scholar]
- 51. Hubbard T (2002) The Ensembl genome database project. Nucleic Acids Res 30: 38–41 [DOI] [PMC free article] [PubMed] [Google Scholar]
- 52. Kim D, Langmead B, Salzberg SL (2015) HISAT: a fast spliced aligner with low memory requirements. Nat Methods 12: 357–360 [DOI] [PMC free article] [PubMed] [Google Scholar]
- 53. Trapnell C, Roberts A, Goff L, Pertea G, Kim D, Kelley DR, Pimentel H, Salzberg SL, Rinn JL, Pachter L (2012) Differential gene and transcript expression analysis of RNA‐seq experiments with TopHat and Cufflinks. Nat Protoc 7: 562–578 [DOI] [PMC free article] [PubMed] [Google Scholar]
- 54. Kuleshov MV, Jones MR, Rouillard AD, Fernandez NF, Duan Q, Wang Z, Koplev S, Jenkins SL, Jagodnik KM, Lachmann A et al (2016) Enrichr: a comprehensive gene set enrichment analysis web server 2016 update. Nucleic Acids Res 44(W1): W90–W97 [DOI] [PMC free article] [PubMed] [Google Scholar]
- 55. Liberzon A, Subramanian A, Pinchback R, Thorvaldsdóttir H, Tamayo P, Mesirov JP (2011) Molecular signatures database (MSigDB) 3.0. Bioinformatics 27: 1739–1740 [DOI] [PMC free article] [PubMed] [Google Scholar]
- 56. Cooke KR, Kobzik L, Martin TR, Brewer J, Delmonte J, Crawford JM, Ferrara JL (1996) An experimental model of idiopathic pneumonia syndrome after bone marrow transplantation: I. The roles of minor H antigens and endotoxin. Blood 88: 3230–3239 [PubMed] [Google Scholar]
- 57. Cooke KR, Krenger W, Hill G, Martin TR, Kobzik L, Brewer J, Simmons R, Crawford JM, van den Brink MR, Ferrara JL (1998) Host reactive donor T cells are associated with lung injury after experimental allogeneic bone marrow transplantation. Blood 92: 2571–2580 [PubMed] [Google Scholar]
- 58. Hill GR, Cooke KR, Teshima T, Crawford JM, Keith JC, Brinson YS, Bungard D, Ferrara JLM (1998) Interleukin‐11 promotes T cell polarization and prevents acute graft‐ versus‐host disease after allogeneic bone marrow transplantation. J Clin Invest 102: 115–123 [DOI] [PMC free article] [PubMed] [Google Scholar]
- 59. Hill GR, Crawford JM, Cooke KR, Brinson YS, Pan L, Ferrara JL (1997) Total body irradiation and acute graft‐versus‐host disease: the role of gastrointestinal damage and inflammatory cytokines. Blood 90: 3204–3213 [PubMed] [Google Scholar]
- 60. Teshima T, Ordemann R, Reddy P, Gagin S, Liu C, Cooke KR, Ferrara JLM (2002) Acute graft‐versus‐host disease does not require alloantigen expression on host epithelium. Nat Med 8: 575–581 [DOI] [PubMed] [Google Scholar]
Associated Data
This section collects any data citations, data availability statements, or supplementary materials included in this article.
Supplementary Materials
Expanded View Figures PDF
Table EV1
Table EV2
Review Process File
Data Availability Statement
The datasets (and computer code) produced in this study are available in the following databases: RNA‐Seq data: Gene Expression Omnibus GSE140483 (https://www.ncbi.nlm.nih.gov/geo/query/acc.cgi?acc=GSE140483).