Abstract
The dedicator of cytokinesis 5 (DOCK5) is associated with obesity. However, the mechanism by which DOCK5 contributes to obesity remains completely unknown. Here, we show that hepatic DOCK5 expression significantly decreases at a state of insulin resistance (IR). Deletion of DOCK5 in mice reduces energy expenditure, promotes obesity, augments IR, dysregulates glucose metabolism, and activates the mTOR (Raptor)/S6K1 pathway under a high‐fat diet (HFD). The overexpression of DOCK5 in hepatocytes inhibits gluconeogenic gene expression and increases the level of insulin receptor (InsR) and Akt phosphorylation. DOCK5 overexpression also inhibits mTOR/S6K1 phosphorylation and decreases the level of raptor protein expression. The opposite effects were observed in DOCK5‐deficient hepatocytes. Importantly, in liver‐specific Raptor knockout mice and associated hepatocytes, the effects of an adeno‐associated virus (AAV8)‐ or adenovirus‐mediated DOCK5 knockdown on glucose metabolism and insulin signaling are largely eliminated. Additionally, DOCK5–Raptor interaction is indispensable for the DOCK5‐mediated regulation of hepatic glucose production (HGP). Therefore, DOCK5 acts as a regulator of Raptor to control hepatic insulin activity and glucose homeostasis.
Keywords: DOCK5, glucose metabolism, insulin resistance, mTOR pathway
Subject Categories: Metabolism, Signal Transduction
DOCK5 has been associated with obesity, however, the mechanism was not understood. This study reveals that DOCK5 reduces Raptor stability and mTORC1 activity in hepatocytes, thereby modulating hepatic insulin activity and glucose homeostasis.

Introduction
Obesity‐ and insulin resistance (IR)‐related diseases (e.g., type 2 diabetes mellitus, T2DM) are increasing rapidly worldwide 1, 2. The increasing incidence of obesity and T2DM is primarily related to high carbohydrate and fat diet combined with a sedentary lifestyle. In addition, obesity and IR have a genetic basis due to the combined effects of multiple genes. Therefore, in addition to advocating for lifestyle changes, it is important to study the roles of various genes in the development of obesity and IR and to identify potential clinical therapeutic strategies.
The dedicator of cytokinesis (DOCK) constitutes a family of evolutionarily conserved guanine nucleotide exchange factors (GEFs) for the Rho family of GTPases. This family consists of 11 members and is further classified into four subfamilies (DOCK‐A, DOCK‐B, DOCK‐C, and DOCK‐D) based on their sequence homology and substrate specificity 3, 4, 5. In particular, DOCK1, DOCK5 and DOCK2 belong to the DOCK‐A subfamily, and they have been confirmed to activate Rac1 6. DOCK5 is the least studied member of the DOCK family of GEFs that activate RhoA GTPases through exchanging bound GDP for forming free GTP 7, 8. DOCK5 is widely expressed in vivo, including adipose, brain, liver, and pancreas tissue 9. It has been reported that the ablation of DOCK5 in mice demonstrates increased bone mass for DOCK5‐induced osteoclast adhesion 10.
Furthermore, other roles for DOCK5 have also been identified, including the promotion of epithelial cell motility and invasion, neutrophil chemotaxis, mast cell degranulation, and myoblast fusion 3, 4, 8. Using the variable number tandem repeat (VNTR) allele bin refinement method, VNTR alleles of DOCK5 have been shown to be associated with obesity in humans 11. Additionally, when fed a diet with high saturated fatty acids, DOCK5 expression was found to be elevated in vivo compared with baseline levels, in conjunction with the accumulation of fat. Therefore, it is thought that DOCK5 expression in vivo is associated with an increased risk of obesity 11. In addition, among members of the DOCK‐A subfamily, DOCK2 has been found to be associated with metabolic homeostasis, obesity, and IR 12. However, the relationship between DOCK5 and obesity and IR remains poorly understood.
The mechanistic target of rapamycin (mTOR) is an intracellular energy sensor, the activity of which is modulated by nutrient and energy states, as well as some cytokines and hormones 13. Recently, mTOR complex 1 (mTORC1) has been reported to regulate several important metabolic processes and is considered a crucial interface for integrating insulin‐regulated protein kinase Akt (Akt) signaling, a major component of insulin signaling, and nutrient‐related signals 14, 15. Furthermore, Rac1, a member of the Rho family of GTPases, has been found to regulate mTORC1 activity 16, whereas DOCK5 has been confirmed to activate Rac1 6. However, it remains unknown whether DOCK5 can regulate energy metabolism in vivo and whether this effect is mediated via the Rac1 and mTOR pathways.
In the current study, we explored the impact of DOCK5 on obesity and IR both in vivo and in vitro. We found that a deficiency in DOCK5 decreases energy expenditure and leads to increased obesity and IR under conditions of a high‐fat diet (HFD) through the Rac1/mTOR/ribosomal protein S6 (S6) kinase 1 (S6K1)/Akt pathway. Since aging is an important risk factor for obesity‐related diseases (e.g., T2DM, cardiovascular disease, and non‐alcoholic fatty liver disease) 17, 18, 19, we also observed the effects of DOCK5 deficiency on age‐ and nutrition‐related energy metabolism in this study. Finally, we utilized genetic approaches both in vivo and in vitro to confirm that Raptor serves as a novel target of DOCK5 mediated by Rac1. Our findings are, for the first time, to demonstrate a critical role for DOCK5 in modulating energy homeostasis and IR.
Results
DOCK5 mRNA and protein expression in the livers of mice with or without IR
To investigate whether DOCK5 is related to IR or obesity, we examined hepatic DOCK5 expression in mice with or without IR. We found that in IR mice, including db/db mice, standard diet (SD)‐ or HFD‐fed adiponectin knockout (Adipoq−/−) and HFD‐fed WT mice, the level of hepatic DOCK5 mRNA and protein was significantly reduced compared with SD‐fed WT mice (Fig EV1A and B). Therefore, the abnormal expression of DOCK5 may be an important feature in IR animals.
Figure EV1. Hepatic DOCK5 is down‐regulated in insulin‐resistant and obese mice.

- DOCK5 mRNA and protein expression in the livers of db/db and C57BL/6J mice.
- DOCK5 mRNA and protein expression in the livers of SD‐ or HFD‐fed C57BL/6J and Adipoq−/− mice. SD, standard chow diet; HFD, high‐fat diet. Data are expressed as the mean ± SEM (n = 3 for each group). P‐values were determined with t‐test, *P < 0.01 compared with C57BL/6J mice.
DOCK5 KO mice have further increased body weight and decreased energy expenditure compared with WT mice under a HFD
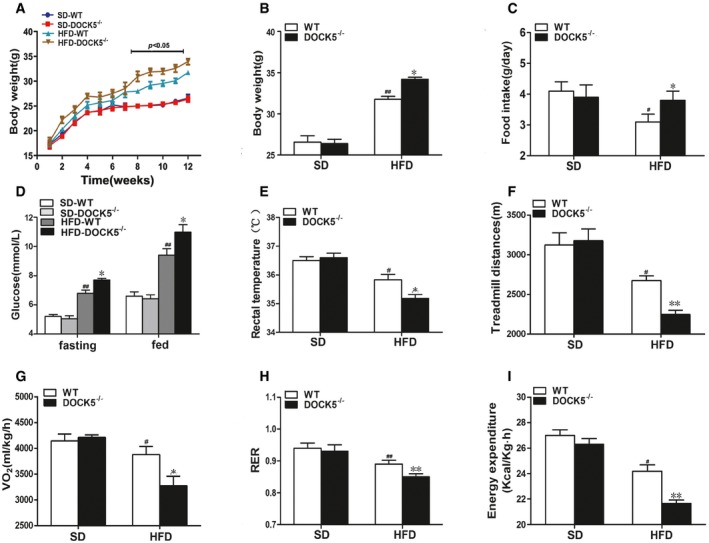
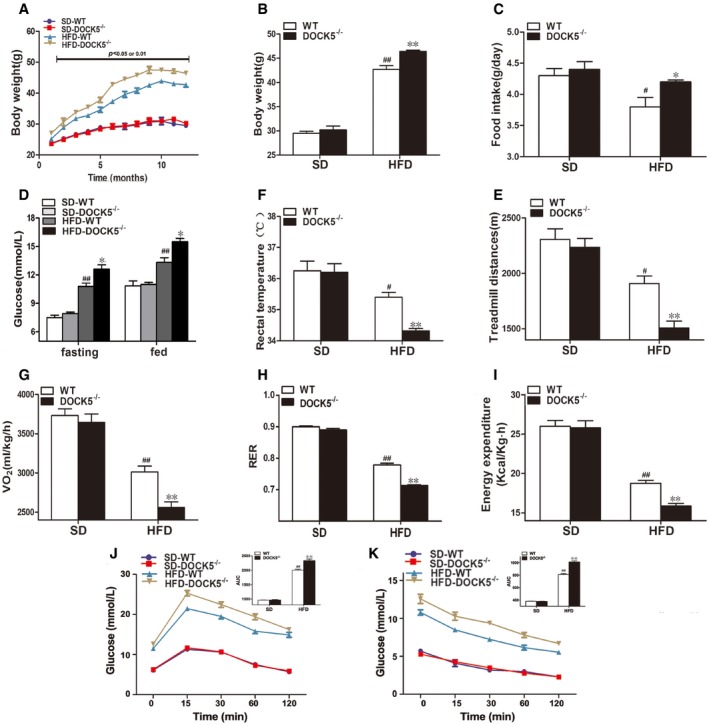
To investigate whether DOCK5 is related to obesity and energy homeostasis, DOCK5 knockout (DOCK5−/−) mice were generated. In response to being fed a HFD for 12 weeks, body weight (Fig 1A and B), food intake (Fig 1C), and blood glucose (Fig 1D) of the DOCK5−/− mice were significantly increased, whereas the rectal temperature (Fig 1E) and locomotor tolerance (Fig 1F) were significantly reduced in DOCK5−/− mice compared with the control animals. Other biochemical parameters of DOCK5−/− and WT mice are presented in Appendix Table S1.
Figure 1. Changes in body weight and energy expenditure in 5‐month‐old mice.
- Body weight curve.
- Cumulative body weight.
- Average daily food intake.
- Fasting and fed blood glucose.
- Rectal temperature.
- Locomotor tolerance.
- 24‐h oxygen consumption.
- Respiratory exchange ratio (RER: VCO2/VO2).
- Energy expenditure.
We subsequently investigated the effects of a DOCK5 deficiency on energy expenditure. Under a HFD, 24‐h oxygen consumption (VO2), energy expenditure, and the respiratory exchange ratio (RER, VCO2/VO2) were lower (Fig 1G–I) in DOCK5−/− mice compared to the control mice. In addition, the expression of uncoupling protein 1 (UCP1) mRNA in brown adipose tissue (BAT) of DOCK5−/− mice was significantly decreased compared to that of WT mice (Appendix Fig S1). Together, these data indicated that under a HFD, the increased body weight observed in DOCK5−/− mice may be primarily due to increased food intake and reduced energy expenditure.
Deletion of DOCK5 increases susceptibility to HFD‐ and lipid‐induced IR
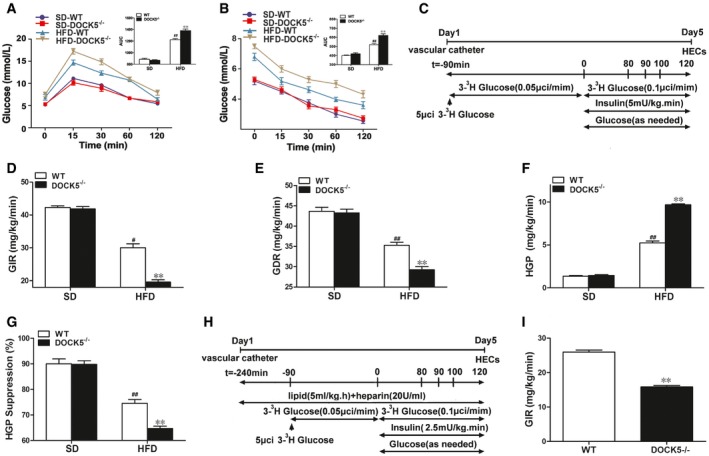
To investigate the impact of a DOCK5 deficiency on energy homeostasis and insulin sensitivity, we first performed a glucose tolerance test (GTT) and insulin tolerance test (ITT) in vivo. The results showed that under a HFD, DOCK5−/− mice exhibited significantly impaired glucose intolerance and attenuated glucose clearance as demonstrated by the GTT and ITT, compared with WT mice (Fig 2A and B).
Figure 2. Deletion of DOCK5 increases susceptibility to HFD‐ and lipid‐induced insulin resistance.
- Blood glucose levels and area under curve (AUC) during the glucose tolerance test.
- Blood glucose levels and AUC during the insulin tolerance test.
- Experimental procedure and hyperinsulinemic‐euglycemic clamp (HEC) protocol.
- Glucose infusion rate (GIR).
- Glucose disposal rate (GDR).
- Hepatic glucose production (HGP).
- Percentage of suppression of hepatic glucose production (HGP).
- Experimental procedure for lipid infusion and the hyperinsulinemic‐euglycemic clamp (HEC).
- Glucose infusion rate (GIR) during lipid infusion.
To evaluate the effects of a DOCK5 deficiency on the hepatic glucose flux in vivo, an hyperinsulinemic‐euglycemic clamp (HEC) was performed on conscious DOCK5−/− and WT mice fed either a HFD or a SD (10% fat) (Fig 2C). The biochemical parameters in WT and DOCK5−/− mice during the HECs are presented in Appendix Table S2. As shown in Fig 2D and E, the glucose infusion rate (GIR) and glucose disposal rate (GDR) were lower in the DOCK5−/− mice compared to their WT littermates fed a HFD, whereas a DOCK5 deficiency did not alter the GIR and GDR under a SD. These results suggest that a DOCK5 deficiency further impairs whole‐body insulin sensitivity under a HFD. To investigate the role of a DOCK5 deficiency on hepatic insulin sensitivity, we measured glucose kinetics using a tracer dilution method during the HEC. We found that when fed a SD, there was no difference in hepatic glucose production (HGP) between DOCK5−/− mice and WT littermates (Fig 2F and G). However, when fed a HFD, the suppression of HGP by hyperinsulinemia was 74.6% in WT mice, compared to only approximately 64% in DOCK5−/− mice (Fig 2F and G), indicating more severe IR in the livers of DOCK5−/− mice. Therefore, the DOCK5 deficiency further exacerbated HFD‐induced IR in both the peripheral tissues and liver.
It has been reported that increased plasma free fatty acid (FFA) levels can cause severe IR in vivo 20. Therefore, we examined the effects of a DOCK5 deficiency on the development of acute IR produced by a lipid infusion in alert mice (Fig 2H). The results demonstrated that during a lipid infusion and HEC, the GIR in DOCK5−/− mice was significantly decreased compared to WT mice, suggesting that under lipid perfusion, a DOCK5 deficiency leads to more severe IR (Fig 2I).
The effects of a DOCK5 deficiency on age‐associated obesity and IR
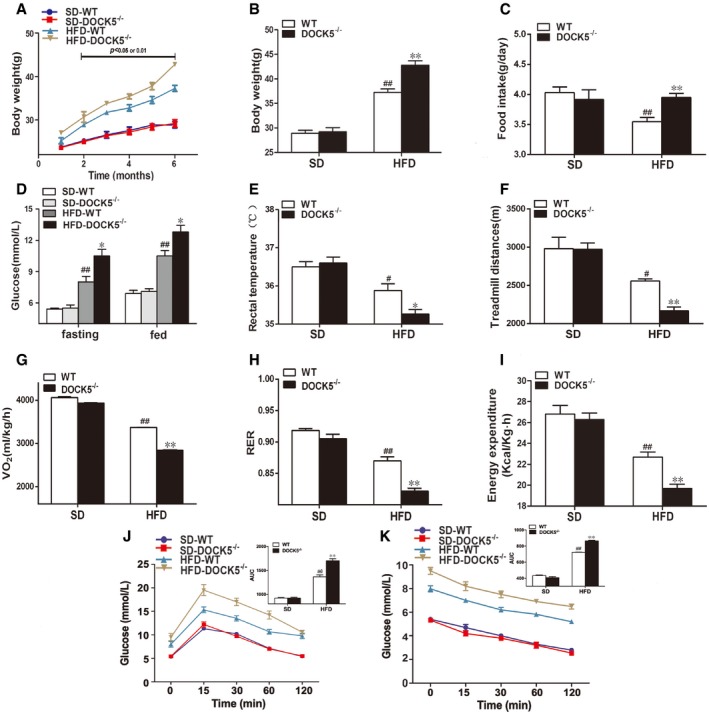
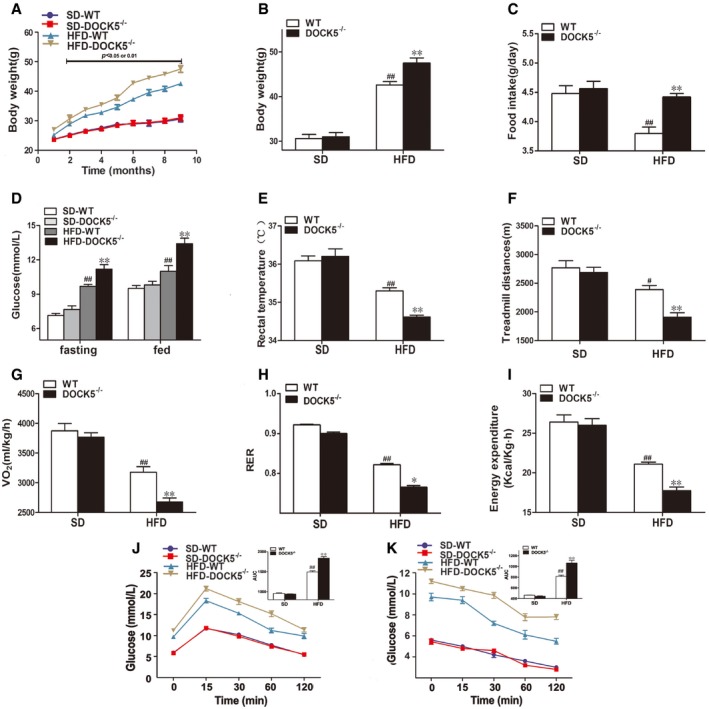
To explore the effect of a DOCK5 deficiency on metabolic phenotype during aging, WT and DOCK5−/− mice were fed either a SD or a HFD for 18 months and phenotypic studies over a time course were performed in mice aged 8–11 months (middle‐aged) and 14–18 months (old). As shown in Figs EV2 and EV3, middle‐aged DOCK5−/− mice developed obesity and IR when fed a HFD (greater body weight, increased food intake, higher blood glucose, lower rectal temperature, locomotor tolerance, VO2, RER and energy expenditure, impaired glucose intolerance, and attenuated glucose clearance). However, in the old DOCK5−/− mice, the effects of a HFD on metabolic and physiological variables gradually diminished to a partial disappearance (Figs EV4 and EV5). Other biochemical parameters are presented in Appendix Table S1. These data indicate that under a HFD, a DOCK5 deletion significantly accelerated obesity and IR in young and middle‐aged mice. However, in old mice, the metabolic effects of the DOCK5 deletion were weakened.
Figure EV2. Changes in body weight and energy expenditure in 8‐month‐old mice.
- Body weight curve.
- Cumulative body weight.
- Average daily food intake.
- Fasting and fed blood glucose.
- Rectal temperature.
- Locomotor tolerance.
- VO2.
- RER.
- Energy expenditure.
- GTTs.
- ITTs.
Figure EV3. Changes in body weight and energy expenditure in 11‐month‐old mice.
- Body weight curve.
- Cumulative body weight.
- Average daily food intake.
- Fasting and fed blood glucose.
- Rectal temperature.
- Locomotor tolerance.
- VO2.
- RER.
- Energy expenditure.
- GTTs.
- ITTs.
Figure EV4. Changes in body weight and energy expenditure in 14‐month‐old mice.
- Body weight curve.
- Cumulative body weight.
- Average daily food intake.
- Fasting and fed blood glucose.
- Rectal temperature.
- Locomotor tolerance.
- VO2.
- RER.
- Energy expenditure.
- GTTs.
- ITTs.
Figure EV5. Changes in body weight and energy expenditure in 18‐month‐old mice.
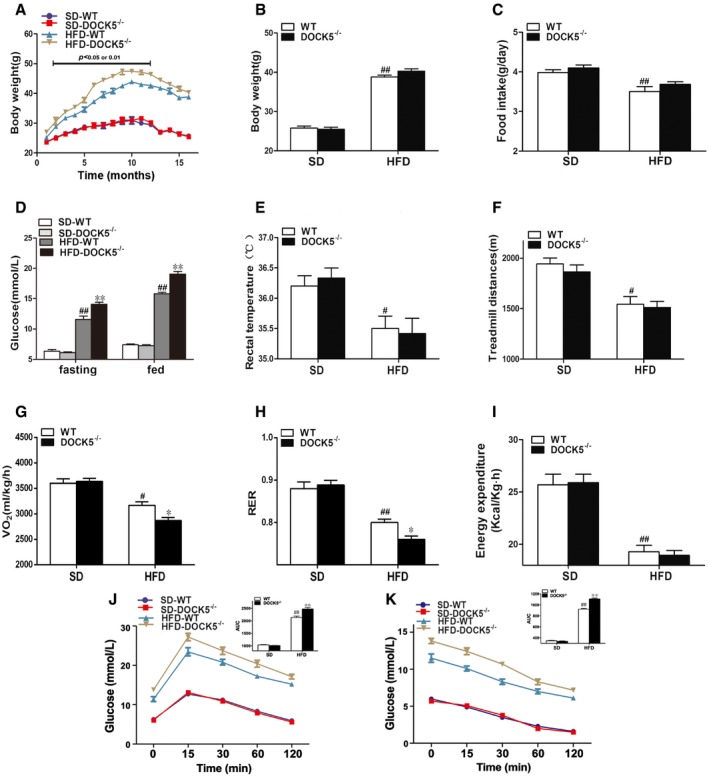
- Body weight curve.
- Cumulative body weight.
- Average daily food intake.
- Fasting and fed blood glucose.
- Rectal temperature.
- Locomotor tolerance.
- VO2.
- RER.
- Energy expenditure.
- GTTs.
- ITTs.
Deletion of DOCK5 increases the expression of gluconeogenic genes, inhibits insulin signaling, and activates the mTOR pathway in the liver
Since a DOCK5 deficiency significantly enhanced the HGP under a HFD, we next examined whether the expression of phosphoenolpyruvate carboxykinase (PEPCK) and glucose‐6‐phosphatase (G6Pase) was affected by this deficiency. Consistent with the glucose kinetic data described above, the expression of PEPCK and G6Pase mRNA and protein in the liver was significantly elevated in HFD‐fed DOCK5−/− mice compared to that of the WT littermates (Fig 3A). Based on these data, we next investigated the effects of a DOCK5 deficiency on the phosphorylation of insulin receptor substrate‐1 (IRS‐1) Ser1101, insulin receptor (InsR), and Akt, three major components of insulin signaling 21 in vivo. Under a HFD, a DOCK5 deficiency markedly impaired insulin‐stimulated phosphorylation of InsR and Akt, but increased the phosphorylation of IRS‐1 Ser1101 in the liver (Fig 3B).
Figure 3. Deletion of DOCK5 increases the expression of gluconeogenic genes, inhibits insulin signaling, and activates the mTOR pathway in the liver.
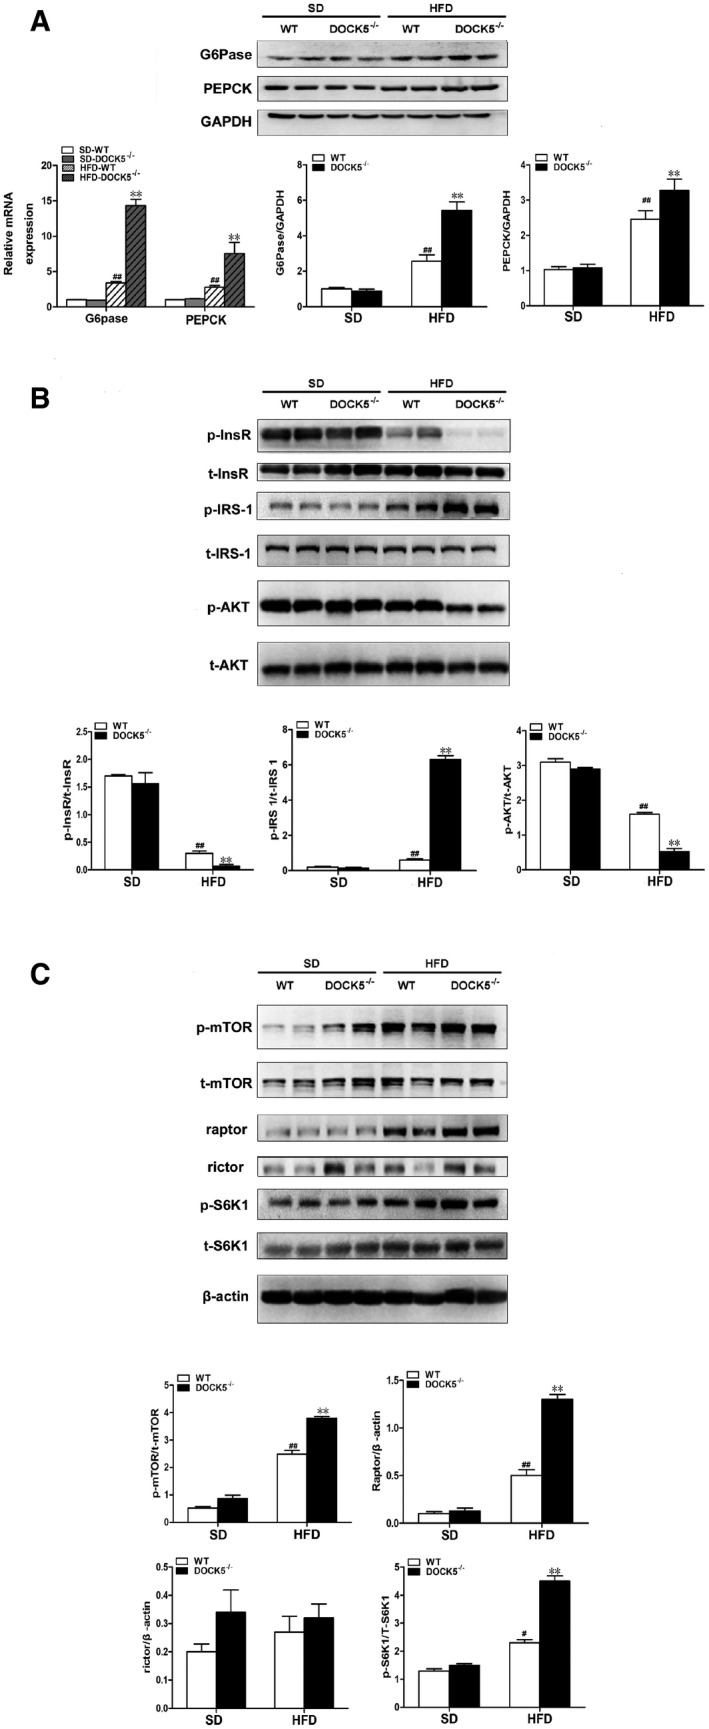
- The expression of phosphoenolpyruvate carboxykinase(PEPCK) and glucose‐6‐phosphatase(G6Pase) mRNA and protein.
- Total and phosphorylated insulin receptor (InsR), IRS‐1ser1101, and Akt.
- Total and phosphorylated mTOR, S6K1, and the levels of Raptor and Rictor protein.
To investigate the signaling pathways utilized by DOCK5 in the regulation of glucose metabolism and IR, we assessed the activation of potential signaling candidates by Western blot. It is important to note that the phosphorylation of both mTOR and its downstream target, S6K1, was markedly increased in the livers of HFD‐fed DOCK5−/− mice (Fig 3C), indicating that a DOCK5 deficiency leads to the activation of the mTOR/S6K1 pathway, a well‐established sensor of nutrient availability in vivo. It has been reported that S6K1 mediates the phosphorylation of IRS‐1 at Ser1101 and leads to IR 22. Therefore, these results suggest that a DOCK5 deficiency leads to the concomitant activation of mTOR/S6K1 and the increased phosphorylation of IRS‐1 Ser1101 to promote hepatic IR.
To further analyze the role of the mTOR/S6K1 signaling pathway, we examined the effects of a DOCK5 deficiency on Raptor and Rictor, two discrete multiprotein complexes. We found that when fed a HFD, a DOCK5 deficiency markedly elevated the level of Raptor protein expression in the liver, whereas the level of Rictor protein did not change (Fig 3C). These findings suggest that a DOCK5 deficiency mediates mTOR signaling primarily via Raptor.
DOCK5 regulates hepatic gluconeogenesis, insulin, and mTOR/mTORC1 (Raptor) signaling in vitro
To further determine whether DOCK5 is related to glucose metabolism and IR at a cellular level, Hep1‐6 cells were infected with pCDNA3.1‐DOCK5 or pCDNA3.1. As predicted, the level of DOCK5 protein was significantly increased by pCDNA3.1‐DOCK5 in infected cells (Appendix Fig S2). In parallel with the in vivo experiments, pCDNA3.1‐DOCK5‐infected Hep1‐6 cells subjected to glucosamine (GlcN) treatment displayed decreased levels of G6Pase and PEPCK mRNA and protein expression (Fig 4A) and increased levels of InsR and Akt phosphorylation compared with the control cells (Fig 4B). In addition, the overexpression of DOCK5 also inhibited the phosphorylation of mTOR, S6K1, and IRS‐1Ser1101, and decreased the level of Raptor protein expression in Hep1‐6 cells (Fig 4B and C). In contrast to the results obtained in Hep1‐6 cells transfected with pCDNA3.1‐DOCK5, mouse primary hepatocytes (MPHs) from DOCK5−/− mice exhibited increased levels (mRNA and protein) of G6Pase and PEPCK expression under GlcN and insulin treatment compared with MPHs from WT mice (Fig 4D). Moreover, we also observed that the phosphorylation of InsR and Akt stimulated by insulin was significantly reduced in the MPHs from DOCK5−/− mice relative to MPHs from WT mice (Fig 4E). Importantly, we also found increased levels of mTOR, S6K1, and IRS‐1Ser1101 phosphorylation, in addition to up‐regulating Raptor expression in MPHs of DOCK5−/− mice (Fig 4E and F). These results further suggest that DOCK5 regulates insulin sensitivity and activation of the mTOR/S6K1/IRS‐1 Ser1101 pathway.
Figure 4. DOCK5 regulates gluconeogenesis, insulin, and mTOR/mTORC1 (Raptor) signaling in vitro .
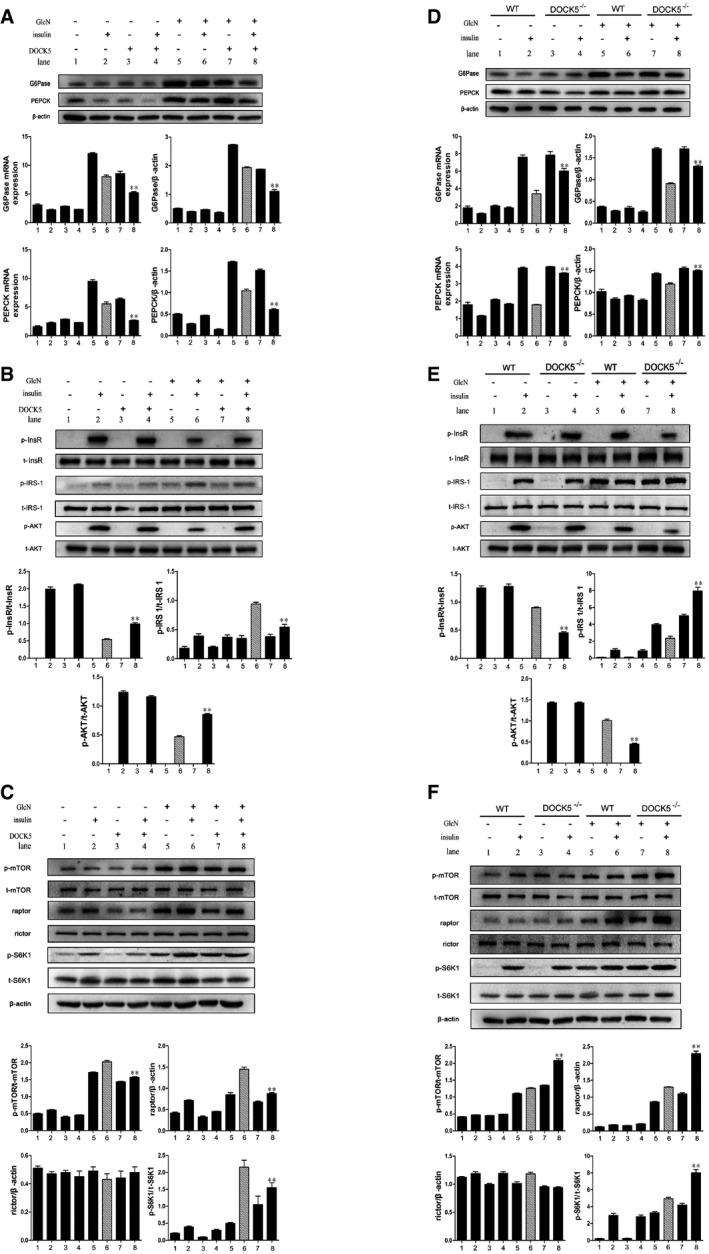
- The mRNA and protein expression of PEPCK and G6Pase in Hep1‐6 cells.
- Total and phosphorylated InsR, IRS‐1Ser1101, and Akt in Hep1‐6 cells.
- Total and phosphorylated mTOR and S6K1, and the levels of Raptor and Rictor protein in Hep1‐6 cells.
- The mRNA and protein expression of PEPCK and G6Pase in MPHs.
- Total and phosphorylated InsR, IRS‐1Ser1101, and Akt in MPHs.
- Total and phosphorylated mTOR and S6K1, and the levels of Raptor and Rictor protein in MPHs.
Deletion of liver mTORC1 (Raptor) in adult obese mice attenuates the role of the DOCK5 deficiency on hepatic glucose metabolism and insulin signaling
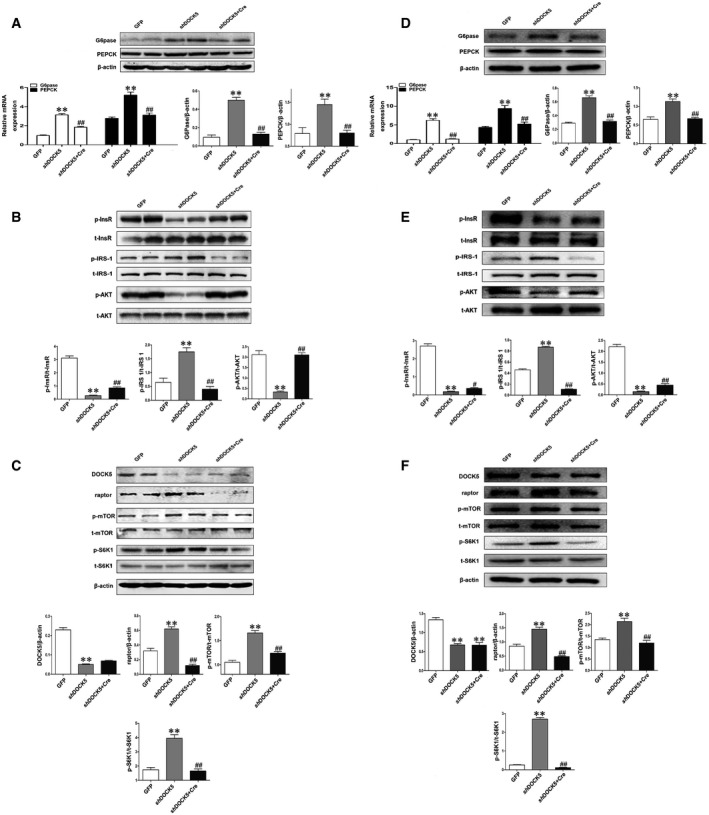
If the DOCK5‐mediated regulation of glucose homeostasis primarily relies on the ability of DOCK5 to regulate the mTOR/Raptor pathway, it is anticipated that deletion of Raptor in the liver should inhibit the effects of DOCK5 on glucose metabolism. To address this possibility, we generated Raptorflox/flox mice (Raptorflox/flox Cre+), in which Raptor is flanked by two flox sites. Male Raptorflox/flox mice were fed a HFD for 12 weeks to induce obesity and IR. To specifically delete Raptor in the liver of mice (L‐Raptor KO mice), Raptorflox/flox mice were transfected with adeno‐associated virus based on serotype 8 (AAV8) expressing shRNA against DOCK5 under the thyroid‐binding globulin promoter (AAV8‐shDOCK5) and AAV8‐Cre or AAV8‐shDOCK5 alone via a tail vein injection, and AAV8‐GFP was used as a control (Fig 5A). As predicted, the AAV8‐shDOCK5 transfection markedly down‐regulated DOCK5 expression and AAV8‐Cre transfection almost resulted in the disappearance of Raptor expression in the livers of L‐Raptor KO mice (Fig 6C and Appendix Fig S3A). However, no changes were observed in the fat and muscle (Appendix Fig S3B and C). We next examined whether the deletion of hepatic Raptor impacts the regulation of DOCK5 on glucose metabolism in vivo. AAV8‐shDOCK5 treatment resulted in a significant increase in both fasting and fed blood glucose in Raptorflox/flox mice compared with mice treated with AAV8‐GFP (Fig 5B). However, a co‐transfection with AAV8‐shDOCK5 and AAV8‐Cre led to a significant reduction in both fasting and fed blood glucose in Raptorflox/flox mice relative to AAV8‐shDOCK5 treatment alone (Fig 5B). In addition, a co‐transfection of AAV8‐shDOCK5 and AAV8‐Cre significantly ameliorated glucose tolerance and clearance compared with an AAV8‐shDOCK5 transfection alone, as evidenced by GTT (Fig 5C) and ITT (Fig 5D). Importantly, during the HEC study, GIR and GDR in AAV8‐shDOCK5 and AAV8‐Cre co‐infected Raptorflox/flox mice were significantly increased compared with that of AAV8‐shDOCK5 transfected mice (Fig 5E and F), whereas insulin‐stimulated suppression of HGP was significantly ameliorated (Fig 5G and H). Other biochemical parameters are presented in Appendix Table S3. Consistent with the changes in glucose turnover, the co‐transfection of AAV8‐shDOCK5 and AAV8‐Cre in Raptorflox/flox mice was associated with a significant decrease in PEPCK and G6Pase mRNA and protein expression (Fig 6A). In addition, co‐transfected Raptorflox/flox mice displayed markedly increased levels of InsR and Akt phosphorylation in the liver relative to AAV8‐shDOCK5 transfected animals (Fig 6B). As shown in Fig 6B and C, the co‐transfection of AAV8‐shDOCK5 and AAV8‐Cre also eliminated the effect of AAV8‐shDOCK5 on the level of mTOR, S6K1, and IRS‐1Ser1101 phosphorylation in the liver of Raptorflox/flox mice.
Figure 5. Adult onset, liver‐specific deletion of Raptor attenuates insulin resistance (IR) and glucose intolerance induced by DOCK5 knockdown in HFD‐fed mice.
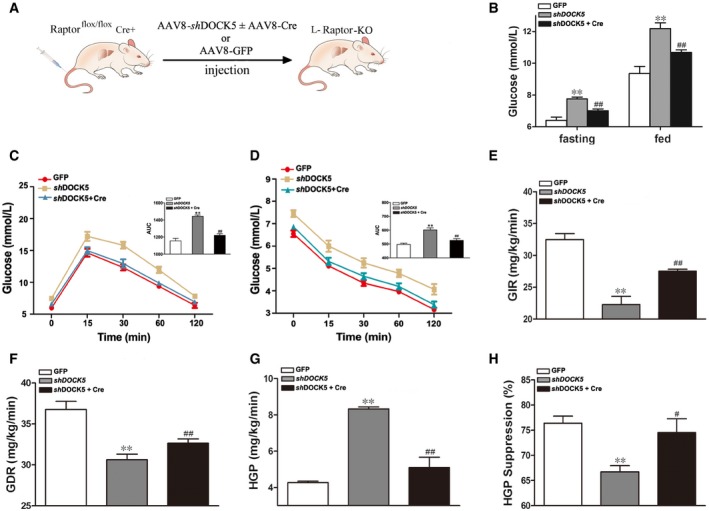
- Schematic representation of the strategy used to produce liver‐specific Raptor knockout (L‐Raptor KO) mice.
- Fasting and fed blood glucose 14 days post‐infection.
- Blood glucose levels and AUC during glucose tolerance tests.
- Blood glucose levels and AUC during insulin tolerance tests.
- Glucose infusion rate (GIR).
- Glucose disposal rate (GDR).
- Hepatic glucose production (HGP).
- Percentage of suppression of hepatic glucose production (HGP).
Figure 6. Deletion of liver Raptor attenuates the role of the DOCK5 deficiency on gluconeogenesis and insulin signaling in vivo and vitro .
-
AThe mRNA and protein expression of PEPCK and G6Pase in the liver.
-
BTotal and phosphorylated InsR, IRS‐1Ser1101, and Akt in the liver.
-
CThe levels of DOCK5 and Raptor protein, and total and phosphorylated mTOR and S6K1 in the liver.
-
D–FMPHs from Raptorflox/flox mice were infected with Ad‐GFP or Ad‐shDOCK5 or Ad‐shDOCK5+ Ad‐Cre. The lysates were immunoblotted with the indicated antibodies or β‐actin. (D) The expression of PEPCK and G6Pase mRNA and protein. (E) Total and phosphorylated InsR, IRS‐1Ser1101, and Akt. (F) The levels of DOCK5 and Raptor protein, and total and phosphorylated mTOR and S6K1.
Deletion of Raptor negates the roles of DOCK5 deficiency in vitro
To further confirm the findings described above at the cellular level, we next examined the impact of Raptor deletion on insulin signaling in adenovirus expressing shRNA against DOCK5 (Ad‐shDOCK5)‐infected MPHs from Raptorflox/flox mice. As expected, DOCK5 protein expression was significantly down‐regulated in Ad‐shDOCK5‐transfected MPHs from Raptorflox/flox mice (Fig 6F). Consistent with the changes in glucose metabolism in vivo, the co‐transfection with both Ad‐shDOCK5 and Ad‐Cre in the MPHs of Raptorflox/flox mice significantly decreased the level of PEPCK and G6Pase mRNA and protein expression relative to Ad‐shDOCK5‐transfected MPHs from the same mice (Fig 6D). In addition, the co‐transfection of Ad‐shDOCK5 and Ad‐Cre in MPHs of Raptorflox/flox mice partially or completely counteracted the effects of a single Ad‐shDOCK5 transfection on InsR, IRS‐1Ser1101, and Akt phosphorylation (Fig 6E). Importantly, co‐transfection with both Ad‐shDOCK5 and Ad‐Cre reduced the effects of Ad‐shDOCK5 on Raptor protein expression and the phosphorylation of mTOR and S6K1in the MPHs of Raptorflox/flox mice (Fig 6F).
The regulation of mTOR activity by DOCK5 requires its Rac atypical guanine nucleotide exchange factor (GEF) activity
To determine whether DOCK5 uses its GEF activity to regulate the mTOR pathway, we first examined the levels of Rac GEF activity in MPHs from WT and DOCK5−/− mice. As shown in Fig 7A, the deletion of DOCK5 resulted in decreased Rac1 GEF activation in the MPHs from DOCK5−/− mice. Next, we used SEW2871, a Rac1 activator, as a treatment to activate Rac1 in MPHs from WT and DOCK5−/− mice. The results showed that SEW2871 treatment in the MPHs from DOCK5−/− mice increased Rac1 GEF activation to the same level as MPHs from WT mice (Fig 7B). Importantly, increased S6K1 phosphorylation and Raptor protein expression by the DOCK5 deficiency was also reversed by SEW2871 treatment (Fig 7B). These data suggest that DOCK5 regulates mTOR (Raptor) activity via a Rac1‐dependent mechanism.
Figure 7. DOCK5 regulates mTOR signaling via its Rac guanine nucleotide exchange factors (GEF) activity, depending on the molecular interaction between DOCK5 and Raptor.
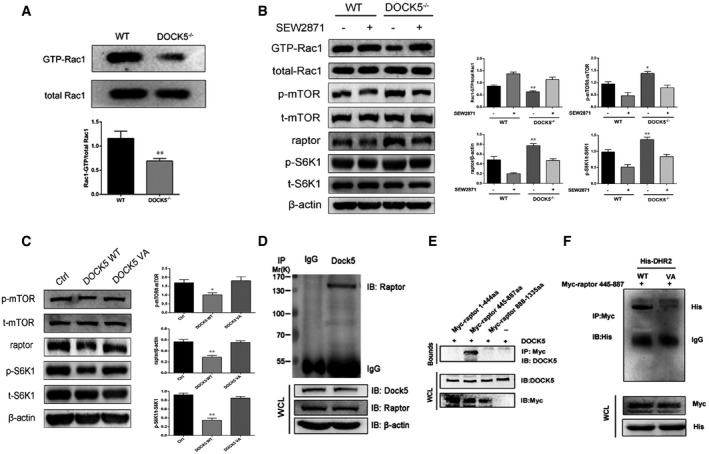
- Rac1 GEF activation in MPHs from WT and DOCK5−/− mice.
- SEW2871 treatment promotes Rac1 GEF activation and eliminates the influence of a DOCK5 deficiency on Raptor/S6K1 signaling in the mouse primary hepatocytes (MPHs) of DOCK5−/− mice.
- Total and phosphorylated mTOR and S6K1 and the level of Raptor protein expression in plasmids expressing a WT DOCK5‐ or mutant DOCK5‐treated Hep1‐6 cells.
- Co‐immunoprecipitation (Co‐IP) analysis of DOCK5 and Raptor expression in Hepa1‐6 cells. After transfected with the indicated plasmids, lysates from cells were immunoprecipitated (IP) with anti‐DOCK5 antibody or normal IgG and then immunoblotted (IB) with the indicated antibody.
- DOCK5 binding to Raptor fragments (445‐887 aa) during transient expression in Hepa1‐6 cells.
- The DOCK5 and Raptor binding sites were identified using mutant DOCK5 (DHR‐2V1559A) and Raptor fragments (445–887 aa) based on a Co‐IP assay. VA, mutant DOCK5 DHR‐2; His, His‐DHR‐2.
To further confirm that DOCK5 requires its GEF activity to regulate Raptor, we transfected plasmids expressing GFP‐tagged WT DOCK5 and a GEF‐dead DOCK5 mutant (V1559A) into Hepa1‐6 cells. The results showed that GEF‐dead DOCK5 failed to impact mTOR signaling and Raptor protein expression in these cells (Fig 7C), confirming that DOCK5 regulates mTOR signaling dependent on its GEF activity.
Interaction between DOCK5 and Raptor proteins
To further validate the functional interaction between DOCK5 and Raptor, we performed a Co‐IP experiment to confirm the precise association between these two proteins. We co‐expressed plasmid expressing DOCK5 (pCDNA3.1‐DOCK5) with a plasmid expressing full‐length Raptor (pCMV6‐Raptor) in Hepa1‐6 cells. As shown in Fig 7D, the interaction between DOCK5 and Raptor was clearly observed with the Co‐IP experiment.
We next sought to identify the region of Raptor responsible for binding to DOCK5. We co‐expressed DOCK5 with a variety of Myc‐tagged fragments of Raptor in Hepa1‐6 cells. The results of the Co‐IP experiments showed that DOCK5 did not bind to 1–444 amino acids (aa) and 888–1335 aa of Raptor. However, the binding of DOCK5 to Raptor was found in a fragment of 445–887 aa (Fig 7E). Therefore, the localization of the DOCK5 binding site on Raptor was in the segment between amino acids 445 and 887.
To investigate whether DOCK5 interacts with Raptor through its DOCK homology region 2 (DHR‐2) domain, we co‐expressed GEF‐dead DOCK5 (mutant DHR‐2) with a Myc‐tagged fragment (445–887 aa) of Raptor in Hepa1‐6 cells. Indeed, the interaction between DOCK5 and Raptor was eliminated by the DHR‐2 mutation of DOCK5 (Fig 7F). Due to the elimination of the interaction between DOCK5 and Raptor, GEF‐dead DOCK5 failed to impact mTOR signaling in Hepal‐6 cells (Fig 7C). These results suggest that there may be an interaction between the DHR‐2 domain of DOCK5 and the 445‐ to 887‐aa region of Raptor.
Discussion
In genome‐wide association studies (GWAS), a significant association of DOCK5 with childhood and adult severe obesity has been reported 11, 23. The metabolic phenotype and mechanism of how DOCK5 may contribute to obesity are currently unknown. In the present study, we first found that the hepatic expression of DOCK5 was decreased in genetically engineered diabetic mice, Adipoq−/− mice, and HFD‐induced IR mice. Based on these results, we hypothesized that DOCK5 might be related to glucose metabolism and IR. Consistent with this hypothesis, a knockout of DOCK5 in mice led to hypersensitivity to diet‐induced IR and obesity due to increased ingestion and lower energy expenditure. Although the obesity‐prone phenotype of DOCK5−/− mice was characterized by a reduction in energy expenditure, the underlying mechanism is unclear. However, the lower body temperature observed in DOCK5−/− mice was most likely caused by decreased thermogenesis, which is regulated by UCP1 in BAT. Therefore, the lower energy expenditure in DOCK5−/− mice may be due to decreased thermogenesis in vivo 24.
To observe the development of obesity and metabolic abnormalities over time, DOCK5−/− and WT mice were fed a HFD for 16 months. Compared with WT mice, prolonged HFD feeding in DOCK5−/− mice resulted in a further reduction in energy expenditure and augmentation in body weight and IR; however, these differences became less obvious in the 14‐ and 18‐month‐old mices. We speculate that these changes may be a result of the following reasons: (i) Age‐related changes mask the metabolic phenotype of a DOCK deficiency (e.g., beta cell failure, increase in inflammatory cytokines, and decreased leptin levels associated with aging) 25; and (ii) aging‐induced leptin resistance and IR 26. Moreover, it is also possible that in WT mice, the expression of DOCK5 gradually decreases with age; however, further studies are required to clarify the biological mechanisms of DOCK5‐mediated regulation of IR during a prolonged HFD.
In studies of glucose homeostasis and IR, a DOCK5 deficiency was found to exacerbate hepatic IR under a HFD as indicated by HEC as a gold standard for estimating IR. Moreover, a change in glucose metabolism is always associated with a change in the insulin signaling pathway. Consistent with changes in glucose kinetics, insulin‐stimulated phosphorylation of InsR and Akt was also substantially impaired in the livers of DOCK5−/− mice fed a HFD. Although various tissues can influence systemic insulin sensitivity, the contribution of the liver to glucose metabolism and insulin sensitivity is the most important in vivo. Therefore, IR of the liver has been established as a central IR. To determine whether a DOCK5 deficiency has a direct effect on insulin signaling in hepatocytes, we used cell‐based assays (e.g., Hep1‐6 cells and MPHs) to rigorously demonstrate the effects of DOCK5 on hepatic insulin signaling, which circumvents the function of DOCK5 in other tissues. Consistent with the in vivo observations, insulin‐stimulated phosphorylation of InsR and Akt was directly regulated by the overexpression or deficiency of DOCK5 in hepatocytes. A previous study reported that DOCK5 interacted with Akt, a serine/threonine kinase which phosphorylates GSK3β in a manner dependent on phosphatidylinositol 3‐kinase (PI3K) activation. Therefore, based on a previous report and both our in vivo and in vitro results, we believe that DOCK5 is likely to regulate insulin sensitivity via a canonical InsR‐Akt‐PI3K pathway. These findings also provide a possible potential mechanistic basis for the involvement of DOCK5 in obesity and IR.
The mammalian target of rapamycin (mTOR) is a serine–threonine protein kinase that has been established to be associated with protein synthesis, growth, proliferation, and development 27. mTOR has two functionally and structurally distinct multiprotein complexes termed mTORC1 (Raptor) and mTORC2. Signaling through mTORC1/S6K1, a downstream mTOR target, has been reported to act as a nutrient sensor that integrates a number of environmental signals (e.g., glucose and insulin) to contribute to the development of IR and obesity 27, 28, 29. It has also been found that mTOR‐Akt may play a pivotal role in maintaining glucose homeostasis and insulin sensitivity in the liver 29, 30. However, previous studies have reported conflicting results concerning the relationship between mTORC1 and IR. Decreased mTOR/S6K1 signaling has been shown to decrease or increase IR 29, 30, 31, 32. Based on the above findings and results of the present study, we hypothesized that the effects of DOCK5 on glucose homeostasis and insulin signaling are mediated by mTOR (Raptor)/S6K1 activity. Consistent with this hypothesis, we demonstrated the regulatory activity of DOCK5 on mTOR/S6K1 signaling by gain‐ and loss‐of‐function approaches in mouse livers, MPHs, and liver cell lines under IR conditions. Therefore, we believe that DOCK5 may function as an upstream inhibitor of mTOR/S6K1.
It has been found that the activation of the mTOR/S6K1 pathway promotes IR through several serine residues on IRS‐1; therefore, increasing the phosphorylation of IRS‐1Ser1101 is pivotal for the development of hepatic IR 22. In the present study, we found that a DOCK5 deficiency also increased the phosphorylation of IRS‐1Ser1101, reducing the activity of IRS‐1 and may thus impair InsR/Akt signaling to induce IR under the physiological setting of nutrient overload. It is conceivable that hepatic IR promoted by a DOCK5 deficiency in which nutrients are available in excess may be determined by the effects of mTOR activity toward S6K‐IRS‐1. Thus, DOCK5‐mediated regulation of the mTOR‐S6K‐IRS‐1 pathway may represent a potential drug target for the pharmacological and genetic administration of DOCK5 to improve IR and metabolic disorders.
mTORC1 contains Raptor and is sensitive to rapamycin 31, 32. Raptor is a specific and important component of mTORC1, which is a pivotal regulator for both metabolism and insulin sensitivity 30. In the present study, we demonstrated that the level of Raptor protein expression could be significantly increased or decreased by DOCK5 deficiency or overexpression in the liver and hepatocytes under IR conditions, suggesting that this protein is regulated by DOCK5.
DOCK5 is a highly specific GEF for Rac1 GTPase, which is the major function of this protein 3, 33, 34. Although whether the interaction between Rac1 and mTOR depends on its GDP/GTP loading state is still controversial, Rac 1 is critical for mTOR signaling regulation in both mTORC1 and mTORC2 16, 35, 36, 37. Therefore, it is important to investigate whether DOCK5 uses its GEF activity to regulate mTOR signaling. Indeed, we found that the expression of a GEF‐dead DOCK5 mutant in Hepa1‐6 cells failed to change mTOR activity and Raptor expression, indicating that DOCK5 regulates mTOR signaling dependent on its GEF activity.
A previous study observed a weak interaction between DOCK5 and Akt for the regulation of mast cell degranulation in a pull‐down assay 3. Therefore, we speculate that the activation of Akt by DOCK5 signaling in hepatocytes may also be mediated by the Rho family GTPase, Rac1. Thus, the DOCK5‐mediated regulation of glucose metabolism may be primarily associated with the Rac1/mTOR (Raptor)/Akt pathway.
To address this issue, we further analyzed the interaction between DOCK5 and Raptor both in vivo and in vitro. Raptorflox/flox mice were fed a HFD to induce IR and obesity, and Raptor was depleted in the liver of these mice via tail vein injections of AAV8‐Cre, which has a high tropism for murine liver (L‐Raptor KO). We intended to establish a model of Raptor inhibition in the liver of adult mice to avoid the adverse effects associated with prolonged Raptor inhibition. This approach addresses two concerns regarding the potential developmental compensation in other tissues as well as the expression or splicing of other genes induced by the flox insertion using conditional knockout techniques 38, 39. Moreover, since an adenoviral or adeno‐associated viral infection may result in hepatic inflammation, AAV8‐GFP was used as a control, and Raptor expression in fat and muscle tissues was examined to address these concerns. Therefore, we believe that these results demonstrate that the deletion of Raptor in the liver of mice ameliorated DOCK5 deficiency‐induced hepatic IR both in vivo and in vitro. These data also confirm an essential role of Raptor in DOCK5‐mediated regulation of hepatic insulin sensitivity. With regard to how these two protein molecules interact with each other, our Co‐IP analysis revealed that the DOCK5 binding site on Raptor was localized in the segment between 445 and 887 aa. Finally, we found that the interaction between DOCK5 and Raptor (445–887 aa) was eliminated by the DHR‐2 mutation of DOCK5. Therefore, it appeared likely that the DHR‐2 domain of DOCK5 binds to Raptor (445–887 aa) to regulate mTOR activity, which is mediated by the inhibition of Rac1 activation.
In summary, as demonstrated in a schematic illustration (Fig 8), in response to a challenge with HFD and/or hyperglycemia (e.g., in both db/db and HFD mice), DOCK5 expression is decreased in the liver. A DOCK5 deficiency leads to the activation of mTOR (Raptor)/S6K1 signaling through the inhibition of Rac1 activation to increase the phosphorylation of IRS‐1Ser1101 and inhibit InsR‐AKT phosphorylation cascades. These changes facilitate the hepatic gluconeogenesis and exacerbate both glucose metabolic disorders and IR. Therefore, the DOCK5–mTORC1–Akt axis may be a novel therapeutic target to combat IR and metabolic disorders.
Figure 8. Schematic diagram.
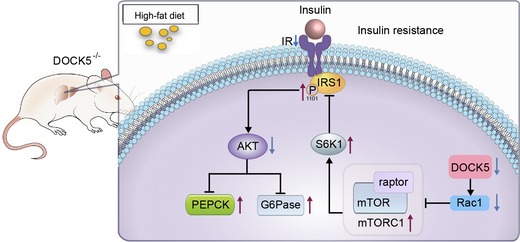
- DOCK5 deficiency results in Rac1 inhibition and the activation of mTOR/mTORC1 (raptor)/S6K1 signaling to increase the phosphorylation of IRS‐1Ser1101 and inhibit InsR‐Akt phosphorylation cascades. These changes facilitate the hepatic gluconeogenesis and exacerbate both glucose metabolic disorders and IR.
Materials and Methods
Vector construction
pCDNA3.1‐DOCK5 was constructed by Gene Create Inc. (Wuhan China). pCMV6‐Raptor, Ad‐shDOCK5, and Ad‐GFP were constructed and generated as previously reported 38. Plasmids expressing GFP‐tagged WT DOCK5 and its mutant (DHR‐2V1559A) were kindly provided by Dr. Yoshinori Fukui and Takehito Uruno (Kyushu University, Fukuoka, Japan). To identify the region of Raptor responsible for binding DOCK5, full‐length or truncated cDNAs of Raptor (1–444, 445–887, and 888–1,335 aa) were cloned into mammalian GV230 expression vectors. AAV8‐shDOCK5 and AAV8‐GFP were constructed by Genechem Inc. (Shanghai, China) and generated. The sequence for shDOCK5 was 5′‐ GCTTCTAAGCAAC ATCCTA‐3′. Ad‐Cre and AAV8‐Cre were purchased from Genechem Inc., Shanghai, China.
Animals and treatments
Male C57BL/6J (WT), Adipoq−/−, and db/db mice were purchased from the Animal Centers of Chongqing Medical University or Shanghai Biomodel or Ganismsci & Tech Develop CO., Ltd. Shanghai, China, respectively. DOCK5−/− mice were generously provided by Dr. Cote (the Burnham Institute for Medical Research, La Jolla, CA) and were generated as previously reported 40. Raptor flox/flox mice on a C57/BL6 background were kindly provided by Dr. Liu (Third Military Medical University, Chongqing, China) and were generated as previously described 31. Mice were housed in cages at 25°C under a 12‐h dark/light cycle and were fed a standard diet (SD; 10% fat) for 8 weeks. For mouse tissue experiments, adult male WT, Adipoq−/−, and db/db mice fed SD or HFD for 12 weeks were killed via a Metofane overdose, and 200–300 mg of hepatic tissue was obtained. The tissues were frozen and stored at −160°C for mRNA or protein analysis.
To construct the HFD‐induced IR model, 8‐week‐old WT and DOCK5−/− mice were fed either SD or HFD (45% fat; Medicine Inc. Jiangsu, China) for 12 weeks. For the age‐related metabolic experiments, 8‐week‐old male DOCK5−/− and WT mice were fed a HFD for 16 months. For signaling pathway studies, 8‐week‐old male Raptorflox/flox mice were fed a HFD for 12 weeks and injected with AAV8‐shDOCK5 ± AAV8‐Cre or AAV8‐GFP (at a dose of 3 × 10¹¹ vg/200 μl/mouse) via the tail vein 14 days prior to the in vivo study. All experimental procedures were approved by the Animal Experimentation Ethics Committee, Chongqing Medical University.
Glucose (GTTs) and insulin tolerance tests (ITTs) and hyperinsulinemic‐euglycemic clamp (HEC)
GTTs and ITTs were performed as previously described 41. Four days prior to the HEC study, catheters were inserted into the right internal jugular vein and left carotid artery of the mice. After fasting for 12 h before the clamp study, HECs were performed in conscious, unrestrained mice as previously described (Fig 2C) 42. For the lipid‐induced IR study, 15% lipid emulsion (5 ml/kg.h) was infused from 2 h before the clamp and to the end of the HECs 43, 44. At the end of the HECs, mice were anesthetized, and tissues were freeze‐clamped and stored at −160°C for further experiments.
Metabolic analyses
Body weight was measured daily in mice aged 8–20 weeks for the HFD‐induced IR study and from age 5 to 18 months for age‐related metabolic study. Food intake, locomotor tolerance, and rectal temperatures were measured at the indicated time points and duration. Energy expenditure was calculated by 24‐h VO2 and carbon dioxide produced (VCO2) as described previously 45.
Analytical procedures
Insulin was determined using an ELISA kit. Serum triglycerides (TG), total cholesterol (TC), and FFA were measured as described previously 45. A scintillation counter was used to measure [3‐3H] glucose radioactivity 46.
Cell culture and treatment
MPHs were isolated from DOCK5−/−, Raptorflox/flox, or WT mice aged 8 weeks as previously reported 47. MPH and Hepa1‐6 cells were cultured in DMEM/F12 or DMEM with 10% FBS, respectively, and cells were infected with pCDNA3.1‐ DOCK5 or pCDNA3.1, or Ad‐shDOCK5 or Ad‐GFP for 48 h. Hepa1‐6 cells were then incubated with 18 mM GlcN for 18 h. For the insulin signaling assay, cells were treated with or without 100 nM insulin for 20 min. For performing the overexpression experiments involving GFP‐tagged WT DOCK5 and GEF‐dead DOCK5, Hepa1‐6 cells were transfected with plasmids expressing a WT DOCK5 or a GEF‐dead DOCK5 (DOCK5 VA) 3.
Measurement of Rac1 activation
Rac1 activity was measured using a Rac Activation Assay Biochem Kit according to the manufacturer's instructions (Cytoskeleton, Denver, CO, USA) 10. For Rac1 activation, the MPHs from WT and DOCK5−/− mice were treated with SEW2871 (15 nM, Cayman Chemical) for 4 days. Cell lysates were collected and added to 15 μg PAK‐PBD beads 48, 49. Protein expression was analyzed by a Western blot, as indicated previously 50.
mRNA and protein analysis
Real‐time quantitative PCR was performed as described previously using β‐actin as an internal control gene 50. The primer pairs used are listed in Appendix Table S4. The primary antibodies included those against DOCK5, G6Pase (Abcam, UK), InsR/phospho‐InsR, IRS‐1 Ser1101/phospho‐IRS‐1 Ser1101, Akt/phospho‐Akt, mTOR/phospho‐mTOR, S6K1/phospho‐S6K1, Raptor, Rictor (Cell Signaling Technology, Boston, MA,USA), PEPCK (Santa Cruz Biotechnology, Dallas, TX), and β‐actin (ZSGB‐BIO, Beijing, China).
Co‐immunoprecipitation (Co‐IP)
Hepa1‐6 cells were co‐transfected with pCDNA3.1‐DOCK5 and pCMV6‐Raptor, or GV230‐Raptor (1–444 aa, 445–887 aa, and 888–1,335 aa) (ORIGENE Inc). To determine the domain for the interaction between DOCK and Raptor, Hepa1‐6 cells co‐expressed mutant DOCK5 DHR2 domain (His‐DHR2) with Raptor Myc‐tagged fragment (445–887 aa). Isolation of the cell extracts was performed as described previously 51. Pre‐resuspended protein G/A‐magnetic beads were incubated with anti‐DOCK5 for 60 min at room temperature with slow agitation. The coated magnetic beads were then incubated with cell lysates overnight at 4°C. The magnetized beads were washed, and the supernatant was discarded. The proteins were immunoblotted using an anti‐Raptor antibody.
Statistical analysis
Data are expressed as the mean ± SEM. Significant differences among multiple groups were assessed by a two‐way ANOVA with a post hoc test. A two‐tailed Student's t‐test was used for comparisons between two groups. For GTTs and ITTs, a paired Student's t‐test was used to compare the differences between groups. Differences were considered to be statistically significant at P < 0.05.
Author contributions
YL, AZ, MY, MT, YL, and SL researched and analyzed the data. JS and DL contributed to the writing of the manuscript and helpful discussion. CL and HZ provided research material. ZZ directed the project and contributed to discussion. LL and GY wrote and edited the manuscript. LL and GY are the guarantor of this work and, as such, had full access to all the data in the study and takes responsibility for the integrity of the data and the accuracy of the data analysis.
Conflict of interest
The authors declare that they have no conflict of interest.
Supporting information
Appendix
Expanded View Figures PDF
Review Process File
Source Data for Figure 3
Acknowledgements
The authors thank Dr. Cote (the Burnham Institute for Medical Research, La Jolla, CA) for providing DOCK−/− mice, Dr. Xingdong Liu (Third Military Medical University, Chongqing, China) for Raptorfl/fl mice, and Dr. Yoshinori Fukui and Takehito Uruno (Kyushu University, Fukuoka, Japan) for plasmids expressing mutant DOCK5 (DHR‐2V1559A). This study was supported by grants from the National Natural Science Foundation of China (Nos. 81873658, 81601214, 81670755, 81700758, and IRT1216). The Chongqing Postgraduate Research Innovation Project and Research Funding Project of Excellent Doctoral Thesis of Chongqing Medical University (CYB16104, CYB18159).
EMBO Reports (2020) 21: e49473
Contributor Information
Ling Li, Email: liling@cqmu.edu.cn.
Gangyi Yang, Email: gangyiyang@hospital.cqmu.edu.cn.
Data availability
The datasets generated during and/or analyzed during the current study are available from the corresponding author upon request.
References
- 1. Reaven GM (1988) Banting lecture role of insulin resistance in human disease. Diabetes 37: 1595–1607 [DOI] [PubMed] [Google Scholar]
- 2. Li K, Xu X, Hu W, Li M, Yang M, Wang Y, Luo Y, Zhang X, Liu H, Li L et al (2014) Glypican‐4 is increased in human subjects with impaired glucose tolerance and decreased in patients with newly diagnosed type 2 diabetes. Acta Diabetol 51: 981–990 [DOI] [PubMed] [Google Scholar]
- 3. Ogawa K, Tanaka Y, Uruno T, Duan X, Harada Y, Sanematsu F, Yamamura K, Terasawa M, Nishikimi A, Côté JF et al (2014) DOCK5 functions as a key signaling adaptor that links Fcepsilon RI signals to microtubule dynamics during mast cell degranulation. J Exp Med 211: 1407–1419 [DOI] [PMC free article] [PubMed] [Google Scholar]
- 4. Watanabe M, Terasawa M, Miyano K, Yanagihara T, Uruno T, Sanematsu F, Nishikimi A, Côté JF, Sumimoto H, Fukui Y (2014) DOCK2 and DOCK5 act additively in neutrophils to regulate chemotaxis, superoxide production, and extracellular trap formation. J Immunol 193: 5660–5667 [DOI] [PMC free article] [PubMed] [Google Scholar]
- 5. Kulkarni K, Yang J, Zhang Z, Barford D (2011) Multiple factors confer specific Cdc42 and Rac protein activation by dedicator of cytokinesis (DOCK) nucleotide exchange factors. J Biol Chem 286: 25341–25351 [DOI] [PMC free article] [PubMed] [Google Scholar]
- 6. Xu X, Yoshizaki H, Ishigaki Y, Kubo E, Minato H, Kiyokawa E (2017) Upregulation of multiple signaling pathways by Dock5 deletion in epithelial cells. Mol Vis 23: 1081–1092 [PMC free article] [PubMed] [Google Scholar]
- 7. Côté JF, Vuori K (2002) Identification of an evolutionarily conserved superfamily of DOCK180‐related proteins with guanine nucleotide exchange activity. J Cell Sci 115: 4901–4913 [DOI] [PubMed] [Google Scholar]
- 8. Frank SR, Köllmann CP, van Lidth de Jeude JF, Thiagarajah JR, Engelholm LH, Frödin M, Hansen SH (2017) The focal adhesion‐associated proteins DOCK5 and GIT2 comprise a rheostat in control of epithelial invasion. Oncogene 36: 1816–1828 [DOI] [PMC free article] [PubMed] [Google Scholar]
- 9. Safran M, Dalah I, Alexander J, Rosen N, Iny Stein T, Shmoish M, Nativ N, Bahir I, Doniger T, Krug H et al (2010) Gene cards version 3: the human gene integrator. Database 2010: baq020 [DOI] [PMC free article] [PubMed] [Google Scholar]
- 10. Vives V, Laurin M, Cres G, Larrousse P, Morichaud Z, Noel D, Côté JF, Blangy A (2011) The Rac1 exchange factor Dock5 is essential for bone resorption by osteoclasts. J Bone Miner Res 26: 1099–1110 [DOI] [PMC free article] [PubMed] [Google Scholar]
- 11. El‐Sayed Moustafa JS, Eleftherohorinou H, de Smith AJ, Andersson‐Assarsson JC, Alves AC, Hadjigeorgiou E, Walters RG, Asher JE, Bottolo L, Buxton JL et al (2012) Novel association approach for variable number tandem repeats (VNTRs) identifies DOCK5 as a susceptibility gene for severe obesity. Hum Mol Genet 21: 3727–3738 [DOI] [PMC free article] [PubMed] [Google Scholar]
- 12. Guo X, Li F, Xu Z, Yin A, Yin H, Li C, Chen SY (2017) DOCK2 deficiency mitigates HFD‐induced obesity by reducing adipose tissue inflammation and increasing energy expenditure. J Lipid Res 58: 1777–1784 [DOI] [PMC free article] [PubMed] [Google Scholar]
- 13. Li Z, Yu R, Yin W, Qin Y, Ma L, Mulholland M, Zhang W (2019) mTOR signaling in X/A‐like cells contributes to lipid homeostasis in mice. Hepatology 69: 860–875 [DOI] [PMC free article] [PubMed] [Google Scholar]
- 14. Gong Q, Hu Z, Zhang F, Cui A, Chen X, Jiang H, Gao J, Chen X, Han Y, Liang Q et al (2016) Fibroblast growth factor 21 improves hepatic insulin sensitivity by inhibiting mammalian target of rapamycin complex 1 in mice. Hepatology 64: 425–438 [DOI] [PMC free article] [PubMed] [Google Scholar]
- 15. Vander HE, Lee SI, Bandhakavi S, Griffin TJ, Kim DH (2007) Insulin signalling to mTOR mediated by the Akt/PKB substrate PRAS40. Nat Cell Biol 9: 316–323 [DOI] [PubMed] [Google Scholar]
- 16. Saci A, Cantley LC, Carpenter CL (2011) Rac1 regulates the activity of mTORC1 and mTORC2 and controls cellular size. Mol Cell 42: 50–61 [DOI] [PMC free article] [PubMed] [Google Scholar]
- 17. Sulander T, Rahkonen O, Helakorpi S, Nissinen A, Uutela A (2004) Eighteen‐year trends in obesity among the elderly. Age Ageing 33: 632–635 [DOI] [PubMed] [Google Scholar]
- 18. Guillory B, Jawanmardi N, Iakova P, Anderson B, Zang P, Timchenko NA, Garcia JM (2018) Ghrelin deletion protects against age‐associated hepatic steatosis by downregulating the C/EBPα‐p300/DGAT1 pathway. Aging Cell 17: 12688 [DOI] [PMC free article] [PubMed] [Google Scholar]
- 19. Sahin‐Efe A, Upadhyay J, Ko BJ, Dincer F, Park KH, Migdal A, Vokonas P, Mantzoros C (2018) Irisin and leptin concentrations in relation to obesity, and developing type 2 diabetes: a cross sectional and a prospective case‐control study nested in the Normative Aging Study. Metabolism 79: 24–32 [DOI] [PubMed] [Google Scholar]
- 20. Yang G, Li L, Tang Y, Boden G (2006) Short‐term pioglitazone treatment prevents free fatty acid‐induced hepatic insulin resistance in normal rats: possible role of the resistin and adiponectin. Biochem Bioph Res Commun 339: 1190–1196 [DOI] [PubMed] [Google Scholar]
- 21. Saltiel AR, Kahn CR (2001) Insulin signalling and the regulation of glucose and lipid metabolism. Nature 414: 799–806 [DOI] [PubMed] [Google Scholar]
- 22. Tremblay F, Brûlé S, Hee Um S, Li Y, Masuda K, Roden M, Sun XJ, Krebs M, Polakiewicz RD, Thomas G et al (2007) Identification of IRS‐1 Ser‐1101 as a target of S6K1 in nutrient‐ and obesity‐induced insulin resistance. Proc Natl Acad Sci USA 104: 14056–14061 [DOI] [PMC free article] [PubMed] [Google Scholar]
- 23. Say YH (2017) The association of insertions/deletions (INDELs) and variable number tandem repeat (VNTRs) with obesity and its related traits and complications. J Physiol Anthropol 36: 25 [DOI] [PMC free article] [PubMed] [Google Scholar]
- 24. Li Y, Wong K, Giles A, Jiang J, Lee JW, Adams AC, Kharitonenkov A, Yang Q, Gao B, Guarente L et al (2014) Hepatic SIRT1 attenuates hepatic steatosis and controls energy balance in mice by inducing fibroblast growth factor 21. Gastroenterology 146: 539–549 [DOI] [PMC free article] [PubMed] [Google Scholar]
- 25. van der Heijden RA, Sheedfar F, Morrison MC, Hommelberg PP, Kor D, Kloosterhuis NJ, Gruben N, Youssef SA, de Bruin A, Hofker MH et al (2015) High‐fat diet induced obesity primes inflammation in increased prior to liver in C57BL/6j mice. Aging 7: 256–268 [DOI] [PMC free article] [PubMed] [Google Scholar]
- 26. Hamrick MW, Ding KH, Pennington C, Chao YJ, Wu YD, Howard B, Immel D, Borlongan C, McNeil PL, Bollag WB et al (2006) Age‐related loss of muscle mass and bone strength in mice is associated with a decline in physical activity and serum leptin. Bone 39: 845–853 [DOI] [PubMed] [Google Scholar]
- 27. Wullschleger S, Loewith R, Hall MN (2006) mTOR signaling in growth and metabolism. Cell 124: 471–484 [DOI] [PubMed] [Google Scholar]
- 28. Wu D, Yang M, Chen Y, Jia Y, Ma ZA, Boden G, Li L, Yang G (2014) Hypothalamic Nesfatin‐1/NUCB2 knockdown augments hepatic gluconeogenesis that is correlated with inhibition of mTOR‐STAT3 signaling pathway in rats. Diabetes 63: 1234–1247 [DOI] [PubMed] [Google Scholar]
- 29. Xiao F, Huang Z, Li H, Yu J, Wang C, Chen S, Meng Q, Cheng Y, Gao X, Li J et al (2011) Leucine deprivation increases hepatic insulin sensitivity via GCN2/mTOR/S6K1 and AMPK pathways. Diabetes 60: 746–756 [DOI] [PMC free article] [PubMed] [Google Scholar]
- 30. Veilleux A, HoudeV P, Bellmann K, Marette A (2010) Chronic inhibition of the mTORC1/S6K1 pathway increases insulin‐induced PI3K activity but inhibits Akt2 and glucose transport stimulation in 3T3‐L1 adipocytes. Mol Endocrinol 24: 766–778 [DOI] [PMC free article] [PubMed] [Google Scholar]
- 31. Jiang H, Westerterp M, Wang C, Zhu Y, Ai D (2014) Macrophage mTORC1 disruption reduces inflammation and insulin resistance in obese mice. Diabetologia 57: 2393–2404 [DOI] [PubMed] [Google Scholar]
- 32. Bridges CR, Tan MC, Premarathne S, Nanayakkara D, Bellette B, Zencak D, Domingo D, Gecz J, Murtaza M, Jolly LA et al (2017) USP9X deubiquitylating enzyme maintains RAPTOR protein levels, mTORC1 signalling and proliferation in neural progenitors. Sci Rep 7: 391 [DOI] [PMC free article] [PubMed] [Google Scholar]
- 33. Tajiri H, Uruno T, Shirai T, Takaya D, Matsunaga S, Setoyama D, Watanabe M, Kukimoto‐Niino M, Oisaki K, Ushijima M et al (2017) Targeting Ras‐driven cancer cell survival and invasion through selective inhibition of DOCK1. Cell Rep 19: 969–980 [DOI] [PubMed] [Google Scholar]
- 34. Sanematsu F, Nishikimi A, Watanabe M, Hongu T, Tanaka Y, Kanaho Y, Côté JF, Fukui Y (2013) Phosphatidic acid‐dependent recruitment and function of the Rac activator DOCK1 during dorsal ruffle formation. J Biol Chem 288: 8092–8100 [DOI] [PMC free article] [PubMed] [Google Scholar]
- 35. Suzuki T, Das SK, Inoue H, Kazami M, Hino O, Kobayashi T, Yeung RS, Kobayashi K, Tadokoro T, Yamamoto Y (2008) Tuberous sclerosis complex 2 loss‐of‐function mutation regulates reactive oxygen species production through Rac1 activation. Biochem Biophys Res Commun 28(368): 132–137 [DOI] [PubMed] [Google Scholar]
- 36. Gulhati P, Bowen KA, Liu J, Stevens PD, Rychahou PG, Chen M, Lee EY, Weiss HL, O'Connor KL, Gao T et al (2011) mTORC1 and mTORC2 regulate EMT, motility, and metastasis of colorectal cancer via RhoA and Rac1 signaling pathways. Cancer Res 71: 3246–3256 [DOI] [PMC free article] [PubMed] [Google Scholar]
- 37. Setiawan J, Kotani T, Konno T, Saito Y, Murata Y, Noda T, Matozaki T (2019) Regulation of small intestinal epithelial homeostasis by Tsc2‐ mTORC1 signaling. Kobe J Med Sci 64: E200–E209 [PMC free article] [PubMed] [Google Scholar]
- 38. Tang JX, Li J, Cheng JM, Hu B, Sun TC, Li XY, Batool A, Wang ZP, Wang XX, Deng SL et al (2017) Requirement for CCNB1 in mouse spermatogenesis. Cell Death Dis 8: e3142 [DOI] [PMC free article] [PubMed] [Google Scholar]
- 39. Kalailingam P, Tan HB, Jain N, Sng MK, Chan JSK, Tan NS, Thanabalu T (2017) Conditional knock out of N‐WASP in keratinocytes causes skin barrier defects and atopic dermatitis‐like inflammation. Sci Rep 7: 7311 [DOI] [PMC free article] [PubMed] [Google Scholar]
- 40. Laurin M, Fradet N, Blangy A, Hall A, Vuori K, Côté JF (2008) The atypical Rac activator Dock180 (Dock1) regulates myoblast fusion in vivo . Proc Natl Acad Sci USA 105: 15446–15451 [DOI] [PMC free article] [PubMed] [Google Scholar]
- 41. Yang M, Dai J, Jia Y, Suo L, Li S, Guo Y, Liu H, Li L, Yang G (2014) Overexpression of juxtaposed with another zinc finger gene 1 reduces proinflammatory cytokine release via inhibition of stress‐activated protein kinases and nuclear factor‐κB. FEBS J 281: 3193–3205 [DOI] [PubMed] [Google Scholar]
- 42. Li L, Yang G, Shi S, Yang M, Liu H, Boden G (2009) The adipose triglyceride lipase, adiponectin and visfatin are downregulated by tumor necrosis factor‐a (TNF‐a) in vivo . Cytokine 45: 12–19 [DOI] [PubMed] [Google Scholar]
- 43. Lam TK, Pocai A, Gutierrez‐Juarez R, Obici S, Bryan J, Aguilar‐Bryan L, Schwartz GJ, Rossetti L (2005) Hypothalamic sensing of circulating fatty acids is required for glucose homeostasis. Nat Med 11: 320–327 [DOI] [PubMed] [Google Scholar]
- 44. Yang G, Li L, Fang C, Zhang L, Li Q, Tang Y, Boden G (2005) Effects of free fatty acids on plasma resistin and insulin resistance in awake rats. Metabolism 54: 1142–1146 [DOI] [PubMed] [Google Scholar]
- 45. Fan W, Waizenegger W, Lin CS, Sorrentino V, He MX, Wall CE, Li H, Liddle C, Yu RT, Atkins AR et al (2017) PPARδ promotes running endurance by preserving glucose. Cell Metab 25: 1186–1193 [DOI] [PMC free article] [PubMed] [Google Scholar]
- 46. Li L, Miao Z, Liu R, Yang M, Liu H, Yang G (2011) Liraglutide prevents hypoadiponectinemia ‐induced insulin resistance and alterations of gene expression involved in glucose and lipid metabolism. Mol Med 17: 1168–1178 [DOI] [PMC free article] [PubMed] [Google Scholar]
- 47. Shulman M, Nahmias Y (2013) Long‐term culture and coculture of primary rat and human hepatocytes. Methods Mol Biol 945: 287–302 [DOI] [PMC free article] [PubMed] [Google Scholar]
- 48. Cao X, Kaneko T, Li JS, Liu AD, Voss C, Li SS (2015) A phosphorylation switch controls the spatiotemporal activation of Rho GTPases in directional cell migration. Nat Commun 6: 7721 [DOI] [PMC free article] [PubMed] [Google Scholar]
- 49. Hoang MV, Nagy JA, Senger DR (2011) Active Rac1 improves pathologic VEGF neovessel architecture and reduces vascular leak: mechanistic similarities with angiopoietin‐1. Blood 117: 1751–1760 [DOI] [PMC free article] [PubMed] [Google Scholar]
- 50. Yang M, Wang J, Wu S, Yuan L, Zhao X, Liu C, Xie J, Jia Y, Lai Y, Zhao AZ et al (2017) Duodenal GLP‐1 signaling regulates hepatic glucose production through a PKC‐delta‐dependent neurocircuitry. Cell Death Dis 8: e2609 [DOI] [PMC free article] [PubMed] [Google Scholar]
- 51. Vanaja GR, Ramulu HG, Kalle AM (2018) Overexpressed HDAC8 in cervical cancer cells shows functional redundancy of tubulin deacetylation with HDAC6. Cell Commun Signal 16: 20 [DOI] [PMC free article] [PubMed] [Google Scholar]
Associated Data
This section collects any data citations, data availability statements, or supplementary materials included in this article.
Supplementary Materials
Appendix
Expanded View Figures PDF
Review Process File
Source Data for Figure 3
Data Availability Statement
The datasets generated during and/or analyzed during the current study are available from the corresponding author upon request.


