

Abstract
Background
Alzheimer disease (AD) is a typical progressive and destructive neurodegenerative disease that has been studied extensively. However, genetic features and molecular mechanisms underlying AD remain unclear. Here we used bioinformatics to investigate the candidate nuclear genes involved in the molecular mechanisms of AD.
Material/Methods
First, we used Gene Expression Omnibus (GEO) database to obtain the expression profiles of the mRNAs from hippocampus microarray and identify differentially expressed genes (DEGs) the plier algorithm. Second, functional annotation and visualization of the DEGs were conducted by the Gene Ontology (GO) and Kyoto Encyclopedia of Genes and Genomes (KEGG) enrichment analysis. Finally, BioGRID, IntAct, STRING, and Cytoscape were utilized to construct a protein-protein interaction (PPI) network. Hub genes were analytically obtained from the PPI network and the microRNA (miRNA)-target network.
Results
Two hippocampus microarrays (GSE5281 and GSE48350) were obtained from the GEO database, comprising 161 and 253 cases separately. Among these, 118 upregulated genes and 694 downregulated genes were identified. The upregulated DEGs were mainly involved in positive regulation of transcription from RNA polymerase II promoter, positive regulation of cartilage development, and response to wounding. The downregulated DEGs were enriched in chemical synaptic transmission, neurotransmitter secretion, and learning. By combining the results of PPI and miRNA-target network, 8 genes and 2 hub miRNAs were identified, including YWHAZ, DLG4, AGAP2, EGFR, TGFBR3, PSD3, RDX, BRWD1, and hsa-miR-106b-5p and hsa-miR-93-5p. These target genes are highly enriched in various key pathways, such as amyloid-beta formation, regulation of cardiocyte differentiation, and actin cytoskeleton reorganization.
Conclusions
In this study, YWHAZ, DLG4, AGAP2, EGFR, TGFBR3, PSD3, RDX, and BRWD1 were identified as candidate genes for future molecular studies in AD, which is expected to improve our understanding of its cause and potential molecular mechanisms. Nuclear genes, DEGs, and related networks identified by integrated bioinformatics analysis may serve as diagnostic and therapeutic targets for AD.
MeSH Keywords: Alzheimer Disease, Gene Expression Profiling, Hippocampus
Background
Alzheimer disease (AD) is the most common type of dementia in the elderly, characterized by irreversible degenerative memory, language, learning, and other cognitive impairments [1]. In 2016, it was estimated that nearly 500 000 new cases of AD are recorded yearly [2], and AD is the fifth-leading cause of death for those 65 years of age and older in the United States [3]. AD is major cause of poor quality of life and has huge financial burdens on families [4,5]. However, few therapeutic strategies have been successful in preventing or curing AD due to its complex pathogenesis. Given the high morbidity and mortality rate of AD, understanding its causes and pathogenesis through identifying molecular biomarkers is important for the early diagnosis, prevention, and treatment of AD.
Many biomarkers participate in the transcriptional and post-transcriptional regulation of AD. Many studies have examined changes in mRNA levels in the brain in the later stages of AD [6]. The in situ hybridization analysis revealed that the low expression of mRNA (cytochrome oxidase subunit II and hippocampal cholinergic neurostimulating peptide precursor protein) in the hippocampal CA1 field of AD patients may explain the downregulation of cholinergic neurons seen in these patients and may thus contribute to the pathogenic processes underlying AD [7,8]. Besides mRNA populations, microRNAs (miRNAs) may be equally important in AD. MiRNAs are short strands (~22 nt long) that bind complementary sequences in target mRNAs and can thus cause their selective degradation or block protein expression [9,10]. MiRNAs are enriched in the hippocampal region of fetal, adult and AD brain and alteration of miRNA-mediated mRNA abundance in the hippocampus of AD was associated with neural dysfunction [11].
Existing studies have shown that Tau, amyloid-β (Aβ), and APOE play critical roles in the pathogenesis of AD, but the analysis of the aforementioned aspects as targeted treatments have not achieved good results. It is essential to search for hub genes and pathways in AD. Thus, we extracted mRNA expression data of AD and normal aging in the same tissue and used an integrative network-based method to combine transcription and protein-protein interaction (PPI) data to identify differentially expressed genes (DEGs) and pathways that may reflect key biological processes in AD.
Material and Methods
This study protocol was approved by the First Affiliated Hospital of Guangxi Medical University Ethical Review Committee (No.2017 KY-E-059), and all procedures of the study were conducted in accordance with the Helsinki Declaration and current ethical guidelines. Flow chart of the study design (Figure 1).
Figure 1.
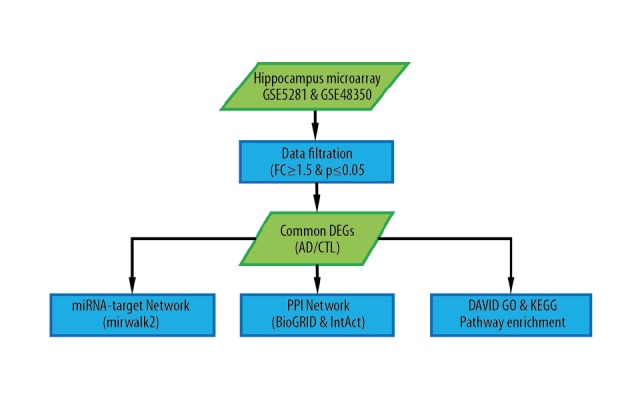
Flow chart of the study design. AD – Alzheimer disease; CTL – control.
Data collection
Gene Expression Omnibus (GEO) (http://www.ncbi.nlm.nih.gov/geo) is the largest public repository functional genomics database of high-throughput gene expression resources, comprising data from microarray, gene expression, and transcription factor binding. We downloaded 2 expression profiling datasets (GSE5281 and GSE48350) from GEO database. All mRNA profiles were based on the GPL570 platform (Affymetrix Human Genome U113 Plus 2.0 Array) (Agilent Technologies, Santa Clara, CA, USA). The GSE5281 dataset included 161 samples. Out of these, 13 hippocampus control and 10 hippocampus affected data were extracted. The GSE48350 dataset included 253 samples. Out of these, 43 hippocampus control and 19 hippocampal AD data were extracted. Each set of data was standardized, and the box plot was used to compare the results before and after standardization. The hippocampus data from GSE5281 and GSE48350 datasets were merged using the R programming language-based performance principle component analysis (PCA).
Identification of overlapping DEGs
Analysis of power tools (APT) was used to obtain the original data of CEL. The plier algorithm based on the R programming language was used to screen for DEGs between hippocampus tissues and corresponding control hippocampus tissue. P-value <0.05 and |logFC| ≥1.5 were considered as a cutoff criterion for DEGs mRNA selection. Hierarchical clustering analysis was conducted with Funrich Software (Version 3.0, http://funrich.org/index.html). The DEGs were displayed by a volcano and heat map.
Functional network establishment of DEGs
The Database for Annotation, Visualization and Integrated Discovery (DAVID) online tool (version 6.7, https://david.ncifcrf.gov/) was used to perform Gene Ontology (GO) and Kyoto Encyclopedia of Genes and Genomes (KEGG) analyses to determine the functions of the DEGs. The DEGs were divided into 3 functional groups: biological process group (BP), cellular component group (CC), and molecular function group (MF). The DEGs were uploaded to the DAVID to perform the GO enrichment analysis and KEGG pathways. In this analysis, the cutoff criteria for pathway screening and significant functionality were set as P<0.05.
Construction of protein-protein interaction (PPI) network
Online tools for BioGRID (https://thebiogrid.org/), IntAct (https://www.ebi.ac.uk/intact/) and Search Tool for the Retrieval of Interacting Genes database (STRING) (Version 10.0, http://string-db.org) were used to predict the relationship among the screened genes. The BioGRID software species source was limited to Homo sapiens, and the retrieval channel was set to gene. Cytoscape software (version 3.4.0, http://www.cytoscape.org/) was utilized to construct the PPI network. Based on analysis of central parameters, hub genes were determined and enriched by ClueGO plug-in of Cytoscape via GO enrichment analysis. PPI node pairs with a score of combination >0.4 (medium confidence) were considered to be significant.
MiRNA-target network construction
The mirwalk 2.0 (http://mirwalk.umm.uni-heidelberg.de/) platform was used combine the results of mRNA DEG with known miRNAs of human to construct the miRNA-mRNA network and to predict target genes with differential expression miRNAs. In addition, we predicted the target genes for miRNAs using three software: TargetScan [12], miRTarBase [13], and miRDB [14]. All 3 procedural predicted genes were selected as targets for DEGs to construct differentially expressed miRNA.
Results
Identification of DEGs in the hippocampus of AD
The GSE5281 and GSE48350 datasets were subjected to PCA prior to identifying the DEGs in the hippocampus tissues of AD (Supplementary Table 1). Results of PCA showed that based on GSE48350 data, GSM300301 sample displayed a large deviation and thus was removed (Figure 2A). Volcano plot of DEGs in the hippocampus tissues of AD and non-AD; Red points indicate high expression, while blue points represent low expression (Figure 2B). A Venn diagram of upregulated and downregulated genes probe (Figure 2C). A total of 9043 and 507 DEGs were upregulated, while 7723 and 1015 DEGs were downregulated in the GSE5281 and GSE48350 datasets, respectively (Figure 2C). A total of 118 overlapped upregulated genes and 694 downregulated genes were identified.
Figure 2.

DEG and gene function enrichment analysis. (A) PCA plot, based on GSE48350 data, GSM300301 sample was excluded due to large deviation; (B) Volcano plot; (C) Venn diagram of upregulated and downregulated genes probe; (D) upregulated DEG GO BP, top 15; (E) downregulated DEG GO BP, top 15; DAVID annotation. DEG – differentially expressed genes; PCA – principle component analysis; GO – Gene Ontology; BP – biological process; DAVID – Database for Annotation, Visualization and Integrated Discovery.
Functional enrichment analysis of DEGs
Overlapping upregulated DEGs in the GO functional enrichment analysis revealed that 75 genes were involved in many BP, including positive regulation of transcription from RNA polymerase II promoter, positive regulation of cartilage development, and response to wounding (Figure 2D). Overlapping downregulated DEGs on the GO functional enrichment analysis showed that 1157 genes were involved in a number of BP, including chemical synaptic transmission, nervous system development, and synaptic vesicle exocytosis (Figure 2E). In terms of CC, DEGs were mostly enriched in the cytoplasm, focal adhesion, extracellular matrix, cell junction, Z disc, actin cytoskeleton, receptor complex, cytoskeleton, extracellular exosome, and actin filament. The overlapping DEGs were mainly involved in actin binding, calmodulin binding, protein binding, actin filament binding, receptor signaling protein serine/threonine kinase activity, transforming growth factor beta-activated receptor activity, type II transforming growth factor beta receptor binding, heparin binding, ubiquitin protein ligase binding, and cadherin binding. In terms of MF, the downregulated DEGs were mainly involved in the chemical synaptic transmission, neurotransmitter secretion, and learning (Figures 3, 4). Unsupervised clustering analysis clearly distinguished neurotransmitter secretion and learning related genes between AD and control (Figure 4A, 4B). In addition, upregulated DEGs were mainly enriched in 3 KEGG pathways, i.e., those involved in regulation of actin cytoskeleton, foxO signaling pathway, and PI3K-Akt signaling pathway (Figure 5A). The downregulated DEGs were mainly enriched in three KEGG pathways, i.e., those involved in synaptic vesicle cycle, calcium signaling pathway, and GABAergic synapse (Figure 5B).
Figure 3.

Cluster diagram of chemical synaptic transmission. Many of the downregulated genes are involved in neural signaling and behavior.
Figure 4.

Cluster diagram of neurotransmitter secretion and learning. Many of the downregulated genes are involved in neural signaling and behavior, the heat maps of neurotransmitter secretion (A) and learning related gene (B) are shown.
Figure 5.

DEG KEGG pathway enrichment. (A) upregulated DEG, (B) downregulated DEGs (top 15). DEG – differentially expressed genes; KEGG – Kyoto Encyclopedia of Genes and Genomes.
PPI network construction and analysis
Venn diagram of known AD related genes with upregulated DEG showed no more overlapping gene, whereas Venn diagram of known AD related genes with downregulated DEG showed that PLD3 and SNCA were overlapping genes (Figure 6A). The PPIs with a combined score >0.4 were used to build a PPI network. The ClueGO was utilized to analyze the whole PPI network. As a result, we identified 14 genes with connection degree over 10. Among them, 13 genes were: YWHAZ, DLG4, AGAP2, EGFR, DLGAP1, APP, DBN1, GRIN1, CDC42, CNKSR2, MAPT, SNCA, and CALM1 (Figure 6B). After analysis of combining the results of ClueGO with the corresponding BP, and these results included plasma membrane bounded cell projection, ion transmembrane transport, amyloid-beta formation, and regulation of supramolecular fiber organization (P≤0.05) (Figure 7A). In addition, amyloid-beta formation was associated with the following genes: APOE, APP, CLU, EPHA4, PSEN1, SNAP91, and SORL1 as shown in Figure 7B.
Figure 6.

PPI network. (A) Venn diagram of known AD related genes with up- and downregulated DEG. (B) The interaction network diagram of AD related genes with the protein with up- and downregulated DEG, in which the connectivity of YWHAZ, DLG4, AGAP2, EGFR, DLGAP1, APP, DBN1, GRIN1, CDC42, CNKSR2, MAPT, SNCA, and CALM1 are >10. AD – Alzheimer disease; PPI – protein-protein interaction; DEG – differentially expressed genes.
Figure 7.

ClueGO functional annotation of the gene. (A) ClueGO functional annotation of genes in Figure 4, BP, P value ≤0.05. Their functions need experimental verification. (B) Amyloid-beta formation-related genes were enriched as shown in Figure 5A.
MiRNA-target network
After combining the results of mRNA DEG with the interactive network of miRNAs, 9 hub genes were selected, of which 1 was upregulated, 6 were downregulated, and 2 were miRNA. TGFBR3 was identified as the upregulated hub gene. Downregulated hub genes included PSD3, RDX, BRWD1, MAP3K9, ELAVL2, and PGM2L1. The hsa-miR-106b-5p and hsa-miR-93-5p were identified as the hub miRNA. Nine hub genes were involved in a number of BP, including positive regulation of carbohydrate metabolic process, regulation of cardiocyte differentiation, and actin cytoskeleton reorganization based on the combination of CytoHubba plugin and miRNA-target network analysis results (Figure 8B).
Figure 8.

MiRNA-target network. (A) miRNA-mRNA DEG interaction network. (B) The ClueGO function and association enrichment map of target genes in A. BP, P value ≤0.05. Their functions need experimental verification. MiRNA – microRNA; mRNA – messenger RINA; DEG – differentially expressed genes.
Hub gene selection and analysis
A total of 8 genes and 2 hub miRNAs were identified from PPI and miRNA-mRNA DEGs network. Four genes were identified as hub genes from the PPI network, with a degree cutoff of ≥30 (YWHAZ, DLG4, AGAP2, and EGFR). The functions of these hub genes are shown in Figure 6A. The hub genes showed the highest node score in the PPI network, suggesting that they might play key roles in the occurrence or progression of AD. Four genes (TGFBR3, PSD3, RDX, and BRWD1) and 2 hub miRNAs (hsa-miR-106b-5p and hsa-miR-93-5p) were identified from the miRNA-mRNA DEGs network (Figure 8A).
Discussion
AD was originally proposed by German pathologist and psychiatrist Alois Alzheimer in 1906 [15]. AD is characterized by widespread cognitive and behavioral dysfunction due to changes at the structural and neurochemical levels. After more than 100 years of research, a large pool of research results has been created on AD. The pathogenesis of AD remains unclear, which might be ascribed to the complexity of the pathogenesis process of AD involving multi-gene and multi-path interaction. Because the brain tissue of patients with AD is often difficult to obtain, research on AD has been limited, and thus the development of treatment options for the disease. In order to better study the pathogenesis of AD, a study based on diseased brain tissue would be the most effective. Related network and differential expression bioinformatics analysis have been applied to many diseases, revealing the complex pathogenesis and new biomarkers for diagnosis and treatment. However, an integrated bioinformatics analysis has not been systematically applied in AD. In this study, we used open public data platforms to obtain hippocampal tissue microarray data, and integrated the differentially expressed genes and miRNA expression data from GEO. We extracted important components from the whole complex network, and used the interaction information to determine the key gene and pathways involved in AD. In this way, we provide valuable clues for diagnosing diseases and screening for therapeutic drugs.
Therefore, 118 upregulated and 694 downregulated DEGs were identified. Furthermore, GO analysis indicated that several BPs played critical roles in the network, such as chemical synaptic transmission, neurotransmitter secretion, and learning. In addition, the downregulated genes and known AD-associated genes analysis indicated that the cross areas meant the commonly altered DEGs. The KEGG pathway enrichment analysis showed that the downregulated DEGs were significantly enriched in the synaptic vesicle cycle, calcium signaling pathway, and GABAergic synapse. Synaptic related genes are extensively downregulated across multiple brain regions in normal human aging and AD, such as posterior cingulate, neocortical regions [16,17]. A study by Kong et al. found that PLD3 was significantly downregulated in severe AD [18]. Animal experiments disclosed that PLD3 expression inhibited target cell innervation and neurotransmission [19]. The level of PLD3 was negatively associated with amyloid precursor protein (APP) and Aβ levels, which suggested that PLD3 might be associated with AD pathogenesis through APP processing [20]. However, further studies are needed to explore how it affects APP processing.
Some genetic factors leading to AD have been recognized. Although the precise cause of AD is not known, the amyloid-beta formation is suspected to contribute to the disease. APOE, APP, and PSEN1 are well known amyloid-beta formation genes in AD. Changes in expression level of these genes in AD have been reported frequently. In order to identify key genes in AD, Cytoscape software was used to analyze the protein interaction network constructed by STRING, BioGRID and IntAct database. The interaction network diagram of AD-related genes showed the upregulated and downregulated DEG. The top 5 key genes in the network were the following: YWHAZ, DLG4, AGAP2, EGFR, and DLGAP1. These genes were enriched in the following biological functions: plasma membrane bounded cell projection, ion transmembrane transport, and amyloid-beta formation. The β-amyloid precursor protein (APP) is the precursor of the β-amyloid protein (Aβ) of AD. It has been shown that the accumulation of β-amyloid (Aβ) triggers synaptic dysfunction, inflammation, and neuronal injury process leading to neuronal loss and cognitive impairment. Identification of frequent APP mutations in AD suggested that these mutations might be involved in the cellular homeostasis or pathway of AD. A study by Masuda et al. revealed that mice with APP-knock carrying NL-G-F mutations showed obvious deficits in spatial memory and flexible learning [21]. Aitken et al. found that YWHAZ was involved in many cellular processes, such as cell signaling, regulation of cell cycle progression, cytoskeletal structure, and transcription [22]. These results indicated that the comprehensive AD network may provide valuable clues for researchers to identify key AD-related components.
In recent years, the efficacy of drugs based on Aβ hypothesis has been debated. The main function of miRNAs is to regulate gene expression at the post-transcriptional level and to suppress gene expression mainly by complementary binding with the 3′-UTR end of its target gene, or by inhibiting the translation of mRNA [10]. Studies have shown that aberrant miRNA expression can affect AD pathogenesis and progress through targeting key genes in cellular systems [23]. However, the role played by miRNAs in AD pathogenesis is not clear. To address this issue, we explored interactive genes or mRNAs-target miRNAs by constructing a miRNA-mRNA DEGs network in AD. The network indicated that PSD3, TGFBR3, RDX, BRWD1, MAP3K9, hsa-miR-106b-5p, ELAVL2, PGM2L1, hsa-miR-93-5p and their corresponding biological processes were involved in the occurrence and development of AD. PSD3 is expressed in the endomembrane system [24], and its expression level in secondary glioblastoma was significantly decreased [25]. Previous studies showed that tau-phosphorylating fyn-kinase is targeted by miR-106b associated with synaptic dysfunction and cognitive deficits typical of AD [26–28]. However, how they interact in AD has not been illuminated and needs further exploration.
This study has 2 strengths. We combined the results of BioGRID, IntAct, and miRNA-target networks to identify the hub genes in the hippocampus of AD. Nuclear genes identified directly from hippocampal tissue are more accurate than those identified from other species or organs. Although the genes, such as APP and epidermal growth factor receptor (EGFR), are well characterized in AD, other new genes have been identified by integrated bioinformatics analysis to be involved in AD pathology, providing a basis for further research.
However, our research has certain limitations, such as the identified nuclear genes were not verified experimentally. The diagnostic utility of these markers in AD was not explored, and further research is needed to dissect the potential mechanisms of these genes. Since AD is caused by complex molecular mechanisms, a single pathway is not sufficient to explain the pathogenesis of AD. Therefore, the results of this study should be interpreted cautiously. Therefore, further experimental research is needed to confirm the current findings.
Conclusions
This study combined PPI network and miRNA-target networks to comprehensively analyze the hub genes of AD. A total of 8 nuclear genes in PPI and miRNA-target networks including YWHAZ, DLG4, AGAP2, EGFR, TGFBR3, PSD3, RDX, BRWD1, and processes such as amyloid-beta formation, regulation of cardiocyte differentiation, and actin cytoskeleton reorganization were found to be vital in the pathogenesis of AD. In conclusion, these hub genes and pathways add to our understanding of AD. The differentially expressed miRNAs and mRNAs may play important roles as new biomarkers or treatment targets for AD.
Footnotes
Source of support: This work was supported by National Key R&D Program of China (2017YFC1307500), National Key R&D Program of China (2018YFC1311305), Guangxi Natural Science Foundation (GNFC No. 2016GXNSFAA380281)
Conflicts of interest
None.
Supplementary Data
Supplementary Table 1. DEG.
Supplementary/raw data available from the corresponding author on request.
References
- 1.Liana G, Apostolova M. Alzheimer disease. Continuum (Minneap Minn) 2016;22(2 Dementia):419–34. doi: 10.1212/CON.0000000000000307. [DOI] [PMC free article] [PubMed] [Google Scholar]
- 2.Alzheimer’s Association. 2019 Alzheimer’s disease facts and figure. Alzheimers Dement. 2019;15(3):321–87. [Google Scholar]
- 3.Heron MP. Deaths. Leading causes for 2016. Natl Vital Stat Rep. 2018;67(6):1–77. [PubMed] [Google Scholar]
- 4.Deb A, Sambamoorthi U, Thornton JD, et al. Direct medical expenditures associated with Alzheimer’s and related dementias (ADRD) in a nationally representative sample of older adults – an excess cost approach. Aging Ment Health. 2018;22(5):619–24. doi: 10.1080/13607863.2017.1286454. [DOI] [PMC free article] [PubMed] [Google Scholar]
- 5.Hurd MD, Martorell P, Delavande A, et al. Monetary costs of dementia in the United States. N Engl J Med. 2013;368(14):1326–34. doi: 10.1056/NEJMsa1204629. [DOI] [PMC free article] [PubMed] [Google Scholar]
- 6.Blalock EM, Chen KC, Stromberg AJ, et al. Harnessing the power of gene microarrays for the study of brain aging and Alzheimer’s disease: Statistical reliability and functional correlation. Ageing Res Rev. 2005;4(4):481–512. doi: 10.1016/j.arr.2005.06.006. [DOI] [PubMed] [Google Scholar]
- 7.Chandrasekaran K, Hatanpaa K, Brady DR, et al. Downregulation of oxidative phosphorylation in Alzheimer disease: loss of cytochrome oxidase subunit mRNA in the hippocampus and entorhinal cortex. Brain Res. 1998;796(1–2):13–19. doi: 10.1016/s0006-8993(98)00248-0. [DOI] [PubMed] [Google Scholar]
- 8.Maki M, Matsukawa N, Yuasa H, et al. Decreased expression of hippocampal cholinergic neurostimulating peptide precursor protein mRNA in the hippocampus in Alzheimer disease. J Neuropathol Exp Neurol. 2002;61(2):176–85. doi: 10.1093/jnen/61.2.176. [DOI] [PubMed] [Google Scholar]
- 9.Ambros V. The functions of animal microRNAs. Nature. 2004;431(7006):350–55. doi: 10.1038/nature02871. [DOI] [PubMed] [Google Scholar]
- 10.Bartel DP. MicroRNAs: Genomics, biogenesis, mechanism, and function. Cell. 2004;116(2):281–97. doi: 10.1016/s0092-8674(04)00045-5. [DOI] [PubMed] [Google Scholar]
- 11.Lukiw WJ. Micro-RNA speciation in fetal, adult and Alzheimer’s disease hippocampus. Neuroreport. 2007;18(3):297–300. doi: 10.1097/WNR.0b013e3280148e8b. [DOI] [PubMed] [Google Scholar]
- 12.Lewis BP, Burge CB, Bartel DP. Conserved seed pairing, often flanked by adenosines, indicates that thousands of human genes are microRNA targets. Cell. 2005;120(1):15–20. doi: 10.1016/j.cell.2004.12.035. [DOI] [PubMed] [Google Scholar]
- 13.Chou CH, Chang NW, Shrestha S, et al. miRTarBase 2016: Updates to the experimentally validated miRNA-target interactions database. Nucleic Acids Res. 2016;44(D1):D239–47. doi: 10.1093/nar/gkv1258. [DOI] [PMC free article] [PubMed] [Google Scholar]
- 14.Wong N, Wang X. miRDB: An online resource for microRNA target prediction and functional annotations. Nucleic Acids Res. 2015;43(Database issue):D146–52. doi: 10.1093/nar/gku1104. [DOI] [PMC free article] [PubMed] [Google Scholar]
- 15.Hippius H, Neundorfer G. The discovery of Alzheimer’s disease. Dialogues Clin Neurosci. 2003;5(1):101–8. doi: 10.31887/DCNS.2003.5.1/hhippius. [DOI] [PMC free article] [PubMed] [Google Scholar]
- 16.Liang WS, Reiman EM, Valla J, et al. Alzheimer’s disease is associated with reduced expression of energy metabolism genes in posterior cingulate neurons. Proc Natl Acad Sci USA. 2008;105(11):4441–46. doi: 10.1073/pnas.0709259105. [DOI] [PMC free article] [PubMed] [Google Scholar]
- 17.Berchtold NC, Coleman PD, Cribbs DH, et al. Synaptic genes are extensively downregulated across multiple brain regions in normal human aging and Alzheimer’s disease. Neurobiol Aging. 2013;34(6):1653–61. doi: 10.1016/j.neurobiolaging.2012.11.024. [DOI] [PMC free article] [PubMed] [Google Scholar]
- 18.Kong W, Mou X, Liu Q, et al. Independent component analysis of Alzheimer’s DNA microarray gene expression data. Mol Neurodegener. 2009;4:5. doi: 10.1186/1750-1326-4-5. [DOI] [PMC free article] [PubMed] [Google Scholar]
- 19.Pedersen KM, Finsen B, Celis JE, et al. Expression of a novel murine phospholipase D homolog coincides with late neuronal development in the forebrain. J Biol Chem. 1998;273(47):31494–504. doi: 10.1074/jbc.273.47.31494. [DOI] [PubMed] [Google Scholar]
- 20.Cruchaga C, Haller G, Chakraverty S, et al. Rare variants in APP, PSEN1 and PSEN2 increase risk for AD in late-onset Alzheimer’s disease families. PLoS One. 2012;7(2):e31039. doi: 10.1371/journal.pone.0031039. [DOI] [PMC free article] [PubMed] [Google Scholar]
- 21.Masuda A, Kobayashi Y, Kogo N, et al. Cognitive deficits in single App knock-in mouse models. Neurobiol Learn Mem. 2016;135:73–82. doi: 10.1016/j.nlm.2016.07.001. [DOI] [PubMed] [Google Scholar]
- 22.Aitken A. 14-3-3 proteins: A historic overview. Semin Cancer Biol. 2006;16(3):162–72. doi: 10.1016/j.semcancer.2006.03.005. [DOI] [PubMed] [Google Scholar]
- 23.Millan MJ. Linking deregulation of non-coding RNA to the core pathophysiology of Alzheimer’s disease: An integrative review. Prog Neurobiol. 2017;156:1–68. doi: 10.1016/j.pneurobio.2017.03.004. [DOI] [PubMed] [Google Scholar]
- 24.Nerlich A, von Orlow M, Rontein D, et al. Deficiency in phosphatidylserine decarboxylase activity in the psd1 psd2 psd3 triple mutant of Arabidopsis affects phosphatidylethanolamine accumulation in mitochondria. Plant Physiol. 2007;144(2):904–14. doi: 10.1104/pp.107.095414. [DOI] [PMC free article] [PubMed] [Google Scholar]
- 25.van den Boom J, Wolter M, Blaschke B, et al. Identification of novel genes associated with astrocytoma progression using suppression subtractive hybridization and real-time reverse transcription-polymerase chain reaction. Int J Cancer. 2006;119(10):2330–38. doi: 10.1002/ijc.22108. [DOI] [PubMed] [Google Scholar]
- 26.Lee G, Thangavel R, Sharma VM, et al. Phosphorylation of tau by fyn: implications for Alzheimer’s disease. J Neurosci. 2004;24(9):2304–12. doi: 10.1523/JNEUROSCI.4162-03.2004. [DOI] [PMC free article] [PubMed] [Google Scholar]
- 27.Larson M, Sherman MA, Amar F, et al. The complex PrP(c)-Fyn couples human oligomeric Abeta with pathological tau changes in Alzheimer’s disease. J Neurosci. 2012;32(47):16857–71a. doi: 10.1523/JNEUROSCI.1858-12.2012. [DOI] [PMC free article] [PubMed] [Google Scholar]
- 28.Um JW, Nygaard HB, Heiss JK, et al. Alzheimer amyloid-beta oligomer bound to postsynaptic prion protein activates Fyn to impair neurons. Nat Neurosci. 2012;15(9):1227–35. doi: 10.1038/nn.3178. [DOI] [PMC free article] [PubMed] [Google Scholar]