Background
Randomized controlled trials (RCTs) are the gold standard for estimating the causal effects of treatments on outcomes while non-randomized observational studies fall low on the evidence hierarchy. Trauma, stroke, and cardiac arrest are the 3 leading causes of death, accounting for 75% of U.S. deaths according to the Centers for Disease Control. In some of these acute settings, randomization can be logistically difficult because the timeline for making decisions about care is short.1–3 Also, biological concepts underlying acute interventions or resuscitation measures may cast substantial doubt on scientific “equipoise” necessary to implement an RCT.
As a result, researchers sometimes rely on well-designed prospective observational studies with pre-planned statistical analyses for decision-making.2–7 In these settings, cohorts are prospectively followed, and analyses preplanned as they would be for an RCT.3,8 The analysis plans often invoke methods for causal inference, commonly propensity scoring. Propensity scoring is a two-stage procedure: Stage 1 estimates the probability of each patient receiving treatment given their baseline covariate profile and Stage 2 adjusts for this probability in the outcome model (via matching, stratification, or inverse probability weighting by the probability of receiving treatment; e.g., Stuart9). In some instances, this allows for unbiased causal effects of treatment on outcome as would have been obtained from an RCT. A large body of literature exists on the theoretical underpinnings of propensity score methods in producing causal treatment-outcome estimates,10–12 as well as on the application of these methods.13–18 However, the statistical literature does not typically explain how to translate theory to practice for real data sets, nor the inherent limitations implementing a propensity score analysis where confounding by indication is likely to be an important source of bias.19
With rapidly increasing availability of non-randomized prospective, longitudinal, and real-time clinical data, propensity methods are growing in popularity.20 When assumptions are met, propensity scoring can be a reliable way of obtaining unbiased estimates of treatment effects on outcomes11,21 and results are useful for the design of future RCTs. However, a large body of evidence indicates propensity scoring faces significant analytic challenges.6–8,22–29 Seeger et al.30 conducted an interim analysis of a sequential cohort study program in routine care to monitor safety and effectiveness of dabigatran and warfarin; these authors present an approach to interim monitoring along the course of a non-randomized study. Others have also implemented pre-planned retrospective analyses for propensity scoring;31,32 however, there are currently no formal guidelines or remedies for assumption violations at interim, especially with application to acute care settings.
To address these challenges, this paper recommends interim monitoring guidelines for non-randomized prospective studies in acute care that plan to invoke propensity scoring. Remedies include: reconsidering inclusion criteria for the study/enrolling patients with more varied covariate profiles, improving variation in the propensity score distribution either by adding sites to the study, or providing treatments at sites where it was previously not available. The example used to demonstrate the proposedguidelines is the Pre-hospital Resuscitation on Helicopter Study (PROHS), which assessed the effect of pre-hospital blood transfusion (PHT) versus no PHT on mortality, previously described in Holcomb et al.3
Methods
Brief Overview of Propensity Scoring
The propensity score is the probability of treatment assignment conditional on observed baseline covariates, X. If certain assumptions are met, propensity score can be used in a small variety of ways to estimate unconfounded (causal) effects of treatment on the outcome, Y.10 Propensity scores are estimated for each individual in a study, using either a parametric or non-parametric (e.g., machine learning) statistical model. Then, matching, inverse probability weighting, or stratification by the propensity score are used to estimate causal effects of treatment on the outcome, Y.
Many studies have been criticized for the fact that propensity scoring, like other non-experimental techniques, depends critically on maintained assumptions about the nature of the process by which participants select or are assigned into a treatment group.33–35 Less understood are the 2 assumptions that underpin the validity of results, and the circumstances in which those assumptions are violated.20,36
The 2 key assumptions that must hold in order implement propensity scoring are: 1.) overlap of the propensity score (i.e., the probability of being treated) in both treated and untreated patients, and 2.) no unmeasured confounding of the treatment-outcome relationship. Clinical data sets frequently violate these assumptions, leading to insurmountable limitations for use of propensity score methods to correct bias. For example, Greene et al,7 assessed 5 large studies that employed propensity scoring to assess the benefit of pre-hospital transfusion;6,26,28,29 most studies encountered these issues in the analysis stage. It is not well-understood that propensity scoring cannot control for selection bias; i.e., it does not alleviate flaws in the study design that may have resulted in lack of overlap in covariate space among treated and non-treated individuals. An example prevalent in longitudinal observational studies is confounding by time.20 While the two above assumptions have extensive theoretical underpinnings beyond the scope of this current opinion, the below explains how to test them in real world clinical data sets.
Assumption 1: Overlap of the propensity score
Overlap means both treated and untreated individuals have a nonzero probability of receiving treatment. This ensures that one can estimate the two causal effects of interest – the average treatment effect (ATE) and average treatment effect in the treated (ATT) - for all values of covariates without relying on extrapolation.37 This assumption is equivalent to stating there must be overlap in the covariate space among treated and untreated individuals in order to make causal inference. More technically, for all values of the pre-treatment covariates, collectively termed X, the probability of receiving either treatment (in the binary treatment case), or any level of the treatment (in the multiple or ordinal treatments case), must lie between 0 and 1 for all X in the study.
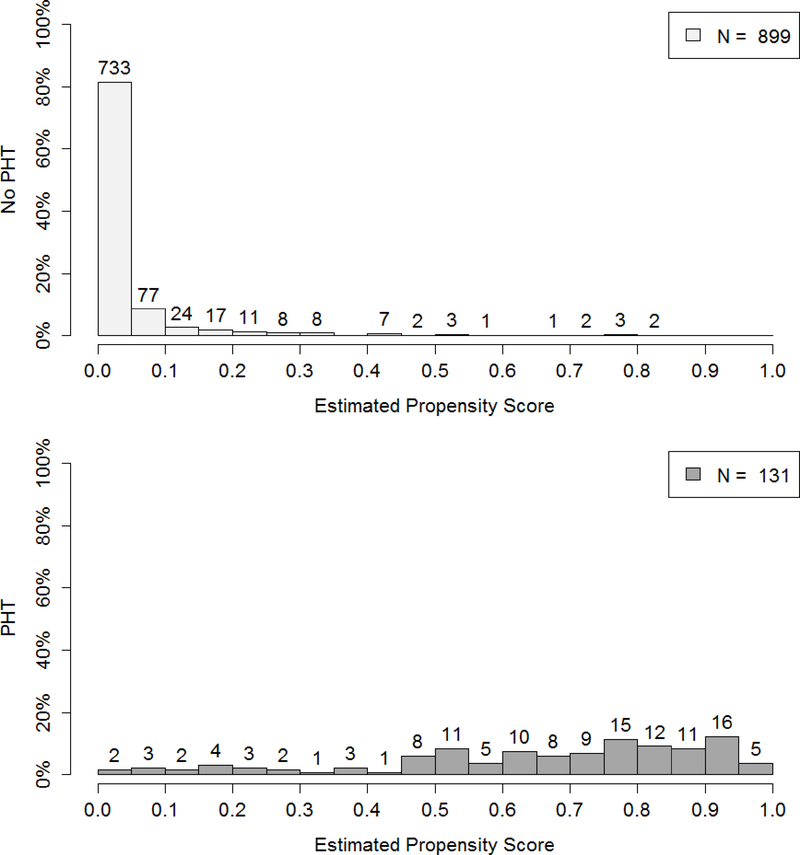
Overlap can be difficult to achieve in clinical research. Due to highly specialized paradigms for patient care, it is possible that not every patient in the data set has a nonzero probability of receiving any treatment. For example, in Holcomb et al.,3 733 of 899 patients not receiving PHT had a zero probability of receiving PHT in final analysis (Figure 1). The patient care paradigm may be so standardized across physicians and institutions, that a clinical data set demonstrates complete confounding by indication. Thus, one would not be able to find patients with similar covariate profiles who received different treatments as these patients do not exist, creating a bias that cannot be fully resolved.19
Figure 1.
Distribution of the propensity score for the no PHT and PHT groups upon completion of PROHS.
Assumption 2: No unmeasured confounding
The second assumption states that treatment assignment must be independent of the observed outcomes, conditional on the confounders used in the propensity model. Rosenbaum and Rubin10 call this the “no unmeasured confounders” assumption, i.e., treatment assignment is solely based on observable characteristics, i.e., all variables that influence treatment assignment and potential outcomes simultaneously are observed by the researchers.36,38
This assumption is so crucial to the propensity score’s ability to correct bias from non-random treatment assignment that systematic reviews have been conducted to assess threats to causal inference.7,20 The assumption is untestable in practice unless one has a semi-randomized study to serve as a validation dataset. Specifically, Yang et al.,37 state that the assumption “…has no testable implications” and that “in a particular application the assumption is a substantive one, and often a controversial one.” As warned by Hill,36 “Some manifestations of bad practice in propensity-score matching appear to have arisen from a failure to correctly define confounders.” Thus, the assumption must be justified both quantitatively and qualitatively, that is, by the data itself, and by subject matter experts.
One solution to make this difficult assumption more “plausibly true” is to collect as many baseline variables as possible, thereby increasing the dimensionality of the covariate space used in estimating the propensity score.10,11,39,40 Note that in acute care settings, one must ensure that all covariates included are truly pre-treatment covariates; since treatment is often administered rapidly, some seemingly baseline measurements may actually be measured post-treatment.7 The inclusion of many covariates into the propensity score model does not harm the analysis in the usual way we understand in model building, because in modeling the propensity score, accurate prediction of treatment supersedes model generalizeability. Since the propensity score focuses on predicting the probability of treatment in the population based on the observed sample, the more pre-treatment covariates included in the propensity model, the better the prediction. This fact is an important one and may be difficult to explain to subject matter experts who, for other applications of statistical modeling, are taught to favor model parsimony.
Computing and Using the Propensity Score
Once the assumptions are investigated and upheld, the propensity scores are computed and used to make inference. Specifying the correct propensity model is a component of propensity scoring but is outside the scope of this paper. In many applications, fitting a logistic regression with treatment as the modeled outcome, and all confounders as predictors is effective. Recently, machine learning methods have been used to compute the propensity score.17,18,41 There are 3 recommended ways to adjust for the propensity score: 1. Matching patients across treatment groups who have similar propensity scores, 2. Inverse probability weighting of all patients, 3. Stratification by propensity score. We refer the reader to two reviews of the large body of adjustment literature.16,17
Results
Proposed Interim Analysis and Remedial guidelines for a Prospective Observational Study
The below are guidelines for an interim analysis plan for a non-randomized observational study that intends to invoke propensity scoring for the primary analysis. At the midterm of data collection:
Estimate propensity scores.
Assess overlap between treatment and reference groups.
If there is evidence of lack of overlap, examine covariate distributions to assess issues with the study design, such as omitted covariates or selection bias.
Assess covariate balance.
Explore unexpected behavior in propensity scores, i.e., deviations from the two assumptions during enrollment.
One may repeat this at quarter 3, depending on the length of enrollment. Note that in the first quarter, there will not be sufficient data to test assumptions; this time should instead be used to prepare analytic code. Since the propensity score is the probability of treatment assignment, does not use outcome data, and since balance- checking does not invoke statistical tests or p-values, there is no “alpha-spending” as occurs with interim analyses of outcome data in RCTs.
Proposed Remedy for Lack of Overlap in Covariate Space: Application to PROHS
Vincent,42 Grzybowsky,43 and Yang, et al.,37 propose ad hoc remedies for constructing subsamples with better overlap in settings where the overlap assumption is violated. The most common remedy is to trim the tails of the distribution of propensity scores.44 However, such ad hoc methods may throw away the majority of the data such that generalizability to the population and covariate space of interest is questionable.36,45 In some cases, trimming will not be possible due to extensive lack of overlap. Interim analysis should assess overlap – if it appears so extensive that trimming likely cannot be applied, stop enrollment and investigate the source; i.e., determine adherence to protocols, whether protocols differ across study groups/sites, reconsider patient inclusion criteria, and reconcile where possible. We note that new research recognizes trimming at arbitrary cutpoints decreases sample size and may introduce bias, for which novel weighting remedies have been very recently proposed; while these are beyond the scope of this paper, it is critical that trimming be guided by the appropriate statistical literature.45
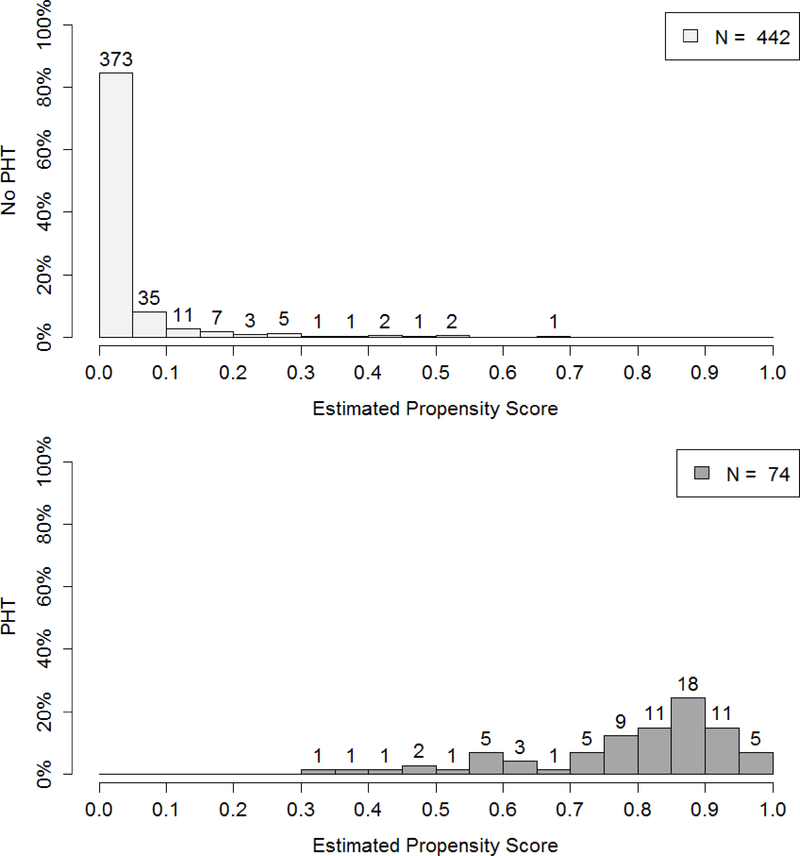
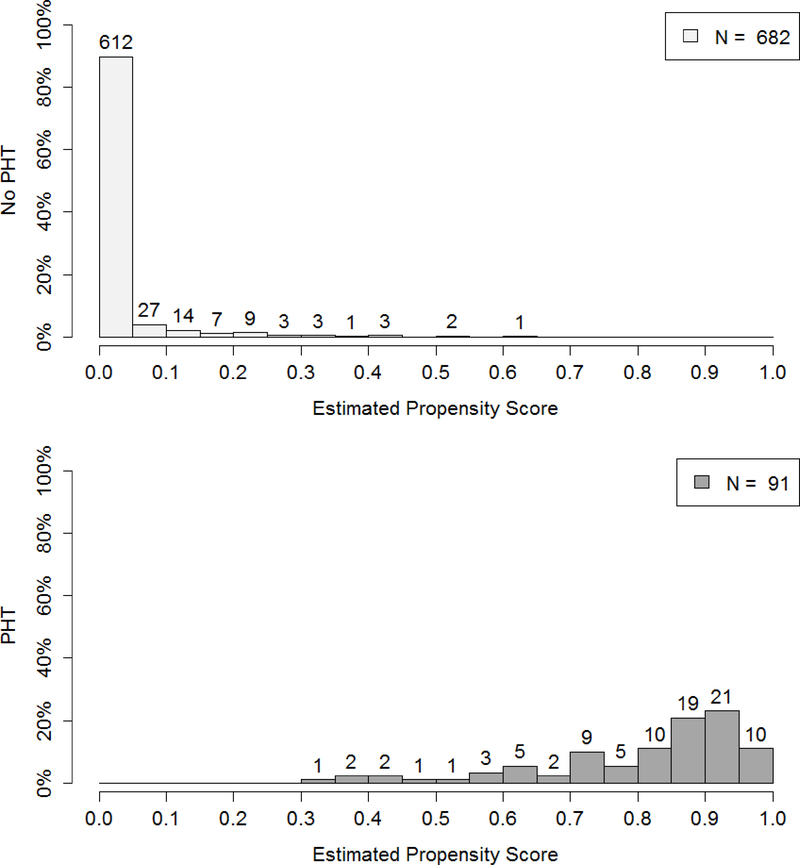
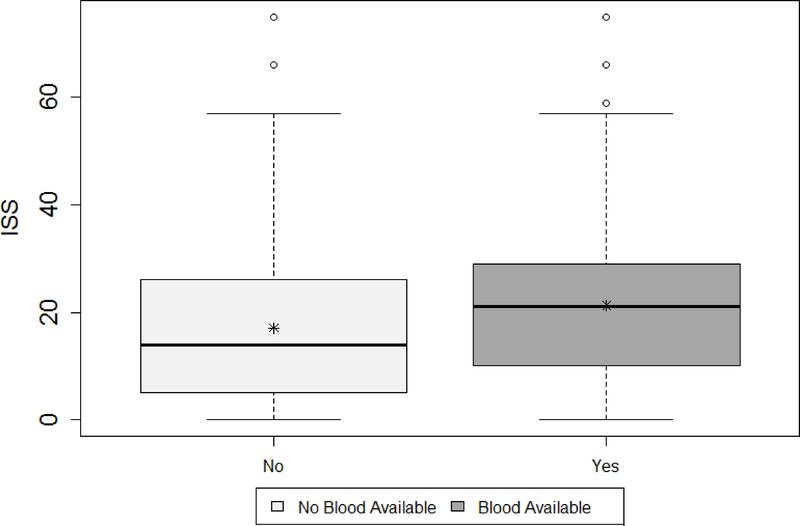
Figure 2 demonstrates the lack of midterm and quarter 3 overlap from PROHS, for those who did and did not receive PHT. At midterm, 442 patients who did not receive PHT, 373 had 0 predicted probability of PHT from the propensity model. In contrast those receiving a PHT were much more evenly distributed in their probability of getting PHT. This clear lack of overlap in the propensity score and therefore covariate space for patients receiving and not receiving PHT demonstrates that reasonable trimming would not improve overlap. It was then determined that site differences were the likely cause of overlap, given that the distribution of injury severity score (ISS) differed by blood availability on the helicopter (a site variable, Figure 3). One possible remedy would have been to add sites at interim to capture data from missing populations (note, this was not performed). The lack of overlap was not remedied by final analysis (Figure 1, previously described).
Figure 2.
Interim analysis: distribution of propensity scores in no PHT (top panel) and PHT (bottom panel) groups for midterm (top) and quarter 3 (bottom) interim analyses, resulting from the generalized boosting propensity model (GBM).
Figure 3.
Distribution of ISS by blood availability upon completion of the PROHS.
Proposed Remedy for Violation of the Unconfoundendess Assumption: Application to PROHS
This assumption has no testable criteria so must be clinically guided via collection of all known potential confounders. At both interim and final analysis, sensitivity to the assumption that all confounders are measured should be evaluated by assessing balance of baseline confounders in the matched/weighted samples. This is achieved by comparing standardized mean differences (which should be less than 0.1), using histograms, QQ plots, and plotting empirical cumulative distribution functions by treatment group for continuous variables, and/or by constructing frequency tables by treatment group for categorical variables. If balance in the distributions of covariates is not achieved, there are likely unmeasured confounders, or the distribution of confounders in the sample is too narrow.
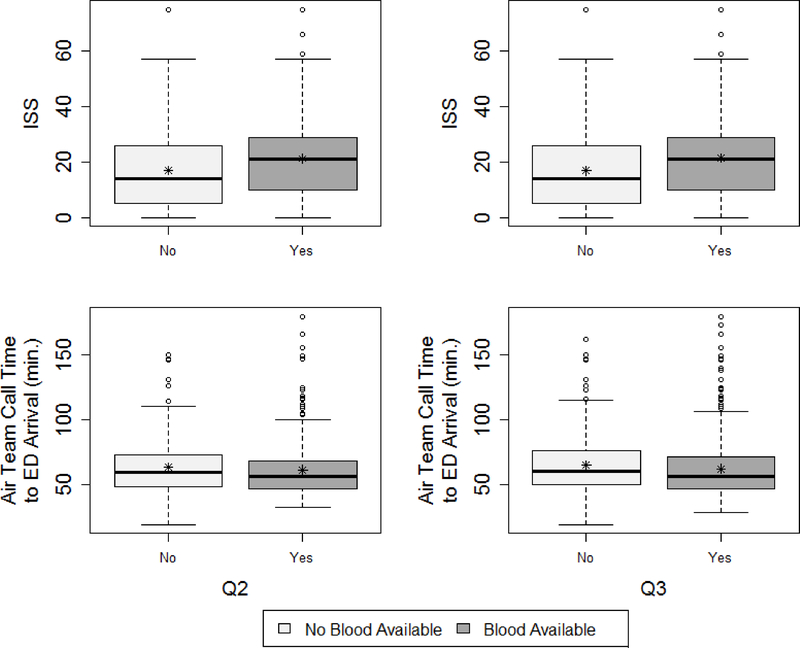
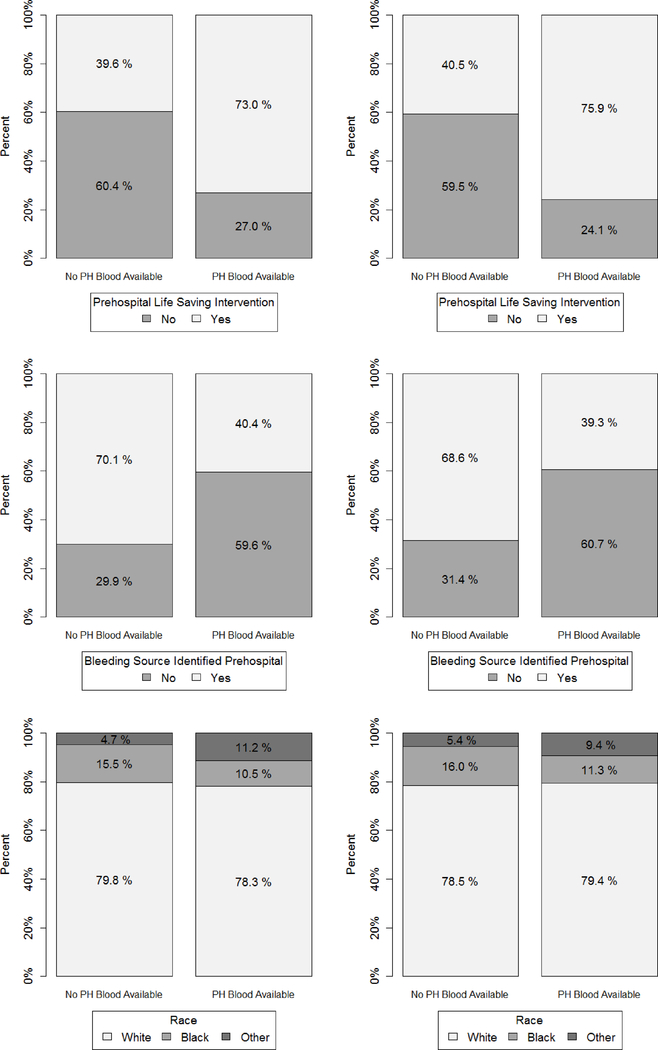
Figures 4 and 5 show that imbalance across treatment groups after propensity matching existed in PROHS both at midterm and quarter 3 analysis. For example, ISS distribution was higher in the PHT vs no PHT helicopters, and the PHT helicopter patients were much more likely to receive a life-saving intervention at both midterm (75.0% vs 39.6%) and quarter 3 (75.9% vs 40.5%). Remedies at midterm analysis would have been to determine omitted confounders and add them to the protocol for the remainder of recruitment, to target recruitment strategies to enroll patients with more varied covariate distributions, or add PHT protocols to more helicopters. Balance for important covariates such as ISS were not rectified at final analysis.3
Figure 4.
Interim analysis: Distributions of important continuous baseline confounders for midterm (left) and quarter 3 (right) by blood availability on helicopter.
Figure 5.
Interim analysis: Bar plots assessing balance on important select categorical baseline confounders for midterm (left) and quarter 3 (right).
Conclusions and Limitations
This paper outlines an interim monitoring plan for non-randomized prospective studies in acute care medicine. A dearth of attention has been paid to designing high quality studies that will make use of propensity scoring while adequately attending to limitations due to the stringent assumptions of overlap and unconfoundedness. Pre-planned propensity score analyses bring a level of uncertainty to any study. For this reason, guidelines for interim monitoring will allow us to evaluate whether the two key assumptions hold. Within the proposed interim monitoring, the outcome variable is never analyzed or considered. The is akin to checking or updating randomization procedures in an RCT, which do not require the use of alpha spending functions.
There are several limitations of the approach. First, even if balance is achieved, it does not guarantee all confounders are measured. Second, the chosen interim propensity model could be different from the final propensity model – thus, midterm analysis does not provide definitive information about the propensity score distribution. Third, power is much lower at midterm than final analysis, which can be partially mitigated by a 3rd quarter check. However, the approach still represents an opportunity to reduce biases inherent in analyses of non-randomized prospective studies.
Acknowledgements
This work was supported by NIH/NHLBI U01HL77863.
Sources of Funding:
NIH/NIGMS T32 GM074902
NIH/NHLBI U01HL77864
Footnotes
Conflicts of Interest:
All authors declare that they have no conflicts of interest relevant to the manuscript.
References
- 1.Curry N, Hopewell S, Doree C, Hyde C, Brohi K, Stanworth S. The acute management of trauma hemorrhage: A systematic review of randomized controlled trials. Crit Care. 2011;15(2):R92. [DOI] [PMC free article] [PubMed] [Google Scholar]
- 2.Lazaridis C, Maas AI, Souter MJ, Martin RH, Chesnut RM, DeSantis SM, Sung G, Leroux PD, Suarez JI, and Second Neurocritical Care Research Conference Investigators. Alternative clinical trial design in neurocritical care. Neurocrit Care. 2015;22(3):378–384.25894451 [Google Scholar]
- 3.Holcomb JB, Swartz MD, DeSantis SM, Greene TJ, Fox EE, Stein DM, Bulger EM, Kerby JD, Goodman M, Schreiber MA, et al. Multicenter observational prehospital resuscitation on helicopter study. J Trauma Acute Care Surg. 2017;83(1 Suppl 1):S83–S91. [DOI] [PMC free article] [PubMed] [Google Scholar]
- 4.del Junco DJ, Fox EE, Camp EA, Rahbar MH, Holcomb JB, PROMMTT Study Group. Seven deadly sins in trauma outcomes research: An epidemiologic post mortem for major causes of bias. J Trauma Acute Care Surg. 2013;75(1 Suppl 1):S97–103. [DOI] [PMC free article] [PubMed] [Google Scholar]
- 5.Joseph B, Aziz H, Pandit V, Kulvatunyou N, Sadoun M, Tang A, O’Keeffe T, Gries L, Green DJ, Friese RS, et al. Prospective validation of the brain injury guidelines: Managing traumatic brain injury without neurosurgical consultation. J Trauma Acute Care Surg. 2014;77(6):984–988. [DOI] [PubMed] [Google Scholar]
- 6.Brown JB, Cohen MJ, Minei JP, Maier RV, West MA, Billiar TR, Peitzman AB, Moore EE, Cuschieri J, Sperry JL, et al. Goal-directed resuscitation in the prehospital setting: A propensity-adjusted analysis. J Trauma Acute Care Surg. 2013;74(5):1207–12; discussion 1212–4. [DOI] [PMC free article] [PubMed] [Google Scholar]
- 7.Greene TJ, DeSantis SM, Fox EE, Wade CE, Holcomb JB, Swartz MD. Utilizing propensity score analyses in prehospital blood product transfusion studies: Lessons learned and moving toward best practice. Mil Med. 2018;183(suppl_1):124–133. [DOI] [PMC free article] [PubMed] [Google Scholar]
- 8.Holcomb JB, del Junco DJ, Fox EE, Wade CE, Cohen MJ, Schreiber MA, Alarcon LH, Bai Y, Brasel KJ, Bulger EM, et al. The prospective, observational, multicenter, major trauma transfusion (PROMMTT) study: Comparative effectiveness of a time-varying treatment with competing risks. JAMA Surg. 2013;148(2):127–136. [DOI] [PMC free article] [PubMed] [Google Scholar]
- 9.Stuart EA. Matching methods for causal inference: A review and a look forward. Stat Sci. 2010;25(1):1–21. [DOI] [PMC free article] [PubMed] [Google Scholar]
- 10.Rosenbaum PRRD. The central role of the propensity score in observational studies for causal effects. Biometrika. 1983:41–55. [Google Scholar]
- 11.Rosenbaum PRRD. Reducing bias in observational studies using subclassification on the propensity score. JASA. 1984;79(387):516–524. [Google Scholar]
- 12.Rosenbaum PR. Model-based direct adjustment. JASA. 1987;82(398):387–394. [Google Scholar]
- 13.D’Agostino R Tutorial in biostatistics: Propensity score methods for bias reduction in the comparison of a treatment to a non-randomized control group. Stat Med. 1998;17(19):2265–2281. [DOI] [PubMed] [Google Scholar]
- 14.Yanovitzky I, Zanutto E, Hornik R. Estimating causal effects of public health education campaigns using propensity score methodology. Eval Program Plann. 2005;28(2):209–220. [Google Scholar]
- 15.Austin PC, Grootendorst P, Anderson GM. A comparison of the ability of different propensity score models to balance measured variables between treated and untreated subjects: A monte carlo study. Stat Med. 2007;26(4):734–753. [DOI] [PubMed] [Google Scholar]
- 16.Austin PC. An introduction to propensity score methods for reducing the effects of confounding in observational studies. Multivar Behav Res. 2011;46(3):399–424. [DOI] [PMC free article] [PubMed] [Google Scholar]
- 17.McCaffrey DF, Ridgeway G, Morral AR. Propensity score estimation with boosted regression for evaluating causal effects in observational studies. Psychol Methods. 2004;9(4):403–425. [DOI] [PubMed] [Google Scholar]
- 18.McCaffrey DF, Griffin BA, Almirall D, Slaughter ME, Ramchand R, Burgette LF. A tutorial on propensity score estimation for multiple treatments using generalized boosted models. Stat Med. 2013;32(19):3388–3414. [DOI] [PMC free article] [PubMed] [Google Scholar]
- 19.Bosco JL, Silliman RA, Thwin SS, Geiger AM, Buist DS, Prout MN, Yood MU, Haque R, Wei F, Lash TL. A most stubborn bias: No adjustment method fully resolves confounding by indication in observational studies. J Clin Epidemiol. 2010;63(1):64–74. [DOI] [PMC free article] [PubMed] [Google Scholar]
- 20.Streeter AJ, Lin NX, Crathorne L, Haasova M, Hyde C, Melzer D, Henley WE. Adjusting for unmeasured confounding in nonrandomized longitudinal studies: A methodological review. J Clin Epidemiol. 2017;87:23–34. [DOI] [PMC free article] [PubMed] [Google Scholar]
- 21.Greenland S Quantifying biases in causal models: Classical confounding vs collider-stratification bias. Epidemiology. 2003;14(3):300–306. [PubMed] [Google Scholar]
- 22.Mangano DT, Tudor IC, Dietzel C. Multicenter Study of Perioperative Ischemia Research Group, Ischemia Research and Education Foundation. The risk associated with aprotinin in cardiac surgery. NEJM. 2006;354:353–365. [DOI] [PubMed] [Google Scholar]
- 23.Schneeweiss S, Seeger JD, Landon J, Walker AM. Aprotinin during coronary-artery bypass grafting and risk of death. N Engl J Med. 2008;358(8):771–783. [DOI] [PubMed] [Google Scholar]
- 24.Shaw AD, Stafford-Smith M, White WD, Phillips-Bute B, Swaminathan M, Milano C, Welsby IJ, Aronson S, Mathew JP, Peterson ED, et al. The effect of aprotinin on outcome after coronary-artery bypass grafting. N Engl J Med. 2008;358(8):784–793. [DOI] [PubMed] [Google Scholar]
- 25.DeSantis SM, Toole JM, Kratz JM, Uber WE, Wheat MJ, Stroud MR, Ikonomidis JS, Spinale FG. Early postoperative outcomes and blood product utilization in adult cardiac surgery: The post-aprotinin era. Circulation. 2011;124(11 Suppl):S62–9. [DOI] [PMC free article] [PubMed] [Google Scholar]
- 26.O’Reilly DJ, Morrison JJ, Jansen JO, Apodaca AN, Rasmussen TE, Midwinter MJ. Prehospital blood transfusion in the en route management of severe combat trauma: A matched cohort study. J Trauma Acute Care Surg. 2014;77(3 Suppl 2):S114–20. [DOI] [PubMed] [Google Scholar]
- 27.Edwards FH, Shahian DM, Grau-Sepulveda MV, Grover FL, Mayer JE, O’Brien SM, DeLong E, Peterson ED, McKay C, Shaw RE, et al. Composite outcomes in coronary bypass surgery versus percutaneous intervention. Ann Thorac Surg. 2014;97(6):1983–8; discussion 1988–90. [DOI] [PMC free article] [PubMed] [Google Scholar]
- 28.Brown JB, Sperry JL, Fombona A, Billiar TR, Peitzman AB, Guyette FX. Pre-trauma center red blood cell transfusion is associated with improved early outcomes in air medical trauma patients. J Am Coll Surg. 2015;220(5):797–808. [DOI] [PMC free article] [PubMed] [Google Scholar]
- 29.Miller BT, Du L, Krzyzaniak MJ, Gunter OL, Nunez TC. Blood transfusion: In the air tonight? J Trauma Acute Care Surg. 2016;81(1):15–20. [DOI] [PubMed] [Google Scholar]
- 30.Seeger JD, Bartels DB, Huybrechts K, Bykov K, Zint K, Schneeweiss S. Monitoring the safety and effectiveness of dabigatran and warfarin in routine care: An interim analysis using US healthcare utilization data. Circulation. 2013;128(Suppl 22):A15187. [Google Scholar]
- 31.Gilmanov D, Bevilacqua S, Murzi M, Cerillo AG, Kallushi E, Miceli A, Glauber M. Minimally invasive and conventional aortic valve replacement: A propensity score analysis. Ann Thorac Surg. 2013;96(3):837–843. [DOI] [PubMed] [Google Scholar]
- 32.Vallarino C, Perez A, Fusco G, Liang H, Bron M, Manne S, Joseph G, Yu S. Comparing pioglitazone to insulin with respect to cancer, cardiovascular and bone fracture endpoints, using propensity score weights. Clin Drug Investig. 2013;33(9):621–631. [DOI] [PMC free article] [PubMed] [Google Scholar]
- 33.Smith JATP. Reconciling conflicting evidence on the performance of propensity-score matching methods. Am Econ Rev. 2001;91(2):112–118. [Google Scholar]
- 34.Heckman JJ, Ichimura H, Todd PE. Matching as an econometric evaluation estimator. Rev Econ Stud. 1998;65(2):261–294. [Google Scholar]
- 35.Agodini RDM. Are experiments the only option? A look at dropout prevention programs. Rev Econ Stat. 2004;86(1):180–194. [Google Scholar]
- 36.Hill J Discussion of research using propensity-score matching: Comments on ‘A critical appraisal of propensity-score matching in the medical literature between 1996 and 2003’ by peter austin. Stat Med. 2008;27:2055–2061. [DOI] [PubMed] [Google Scholar]
- 37.Yang S, Imbens GW, Cui Z, Faries DE, Kadziola Z. Propensity score matching and subclassification in observational studies with multi-level treatments. Biometrics. 2016;72(4):1055–1065. [DOI] [PubMed] [Google Scholar]
- 38.Caliendo MKS. Some practical guidance for the implementation of propensity score matching. J Econ Surv. 2008;22(1):31–72. [Google Scholar]
- 39.Rubin DB, Thomas N. Matching using estimated propensity scores: Relating theory to practice. Biometrics. 1996;52(1):249–264. [PubMed] [Google Scholar]
- 40.Rubin DB. On principles for modeling propensity scores in medical research. Pharmacoepidem Dr S. 2004;13(12):855–857. [DOI] [PubMed] [Google Scholar]
- 41.Cheng J, Combs M, Lendle SD, Franklin JM, Wyss R, Schneeweiss S, van der Laan MJ. Propensity score prediction for electronic healthcare databases using super learner and high-dimensional propensity score methods. Cornell University Library. 2017. [DOI] [PMC free article] [PubMed] [Google Scholar]
- 42.Vincent JL, Baron JF, Reinhart K, Gattinoni L, Thijs L, Webb A, Meier-Hellmann A, Nollet G, Peres-Bota D, ABC Anemia and Blood Transfusion in Critical Care Investigators. Anemia and blood transfusion in critically ill patients. JAMA. 2002;288(12):1499–1507. [DOI] [PubMed] [Google Scholar]
- 43.Grzybowski M, Clements EA, Parsons L, Welch R, Tintinalli AT, Ross MA, Zalenski RJ. Mortality benefit of immediate revascularization of acute ST-segment elevation myocardial infarction in patients with contraindications to thrombolytic therapy: A propensity analysis. JAMA. 2003;290(14):1891–1898. [DOI] [PubMed] [Google Scholar]
- 44.Crump RK, Hotz JV, Imbens GW, Mitnik OA. Dealing with limited overlap in estimation of average treatment effects. Biometrika. 2009;asn055. [Google Scholar]
- 45.Li F, Thomas LE, Li F. Addressing extreme propensity scores via the overlap weights. Am J Epidemiol. 2019;188(1):250–257. [DOI] [PubMed] [Google Scholar]


