Background:
Newer designs and techniques of total ankle arthroplasty (TAA) have challenged the assumption of ankle arthrodesis (AA) as the primary treatment for end-stage ankle arthritis. The objective of this study was to compare physical and mental function, ankle-specific function, pain intensity, and rates of revision surgery and minor complications between these 2 procedures and to explore heterogeneous treatment effects due to age, body mass index (BMI), patient sex, comorbidities, and employment on patients treated by 1 of these 2 methods.
Methods:
This was a multisite prospective cohort study comparing outcomes of surgical treatment of ankle arthritis. Subjects who presented after nonoperative management had failed received either TAA or AA using standard-of-treatment care and rehabilitation. Outcomes included the Foot and Ankle Ability Measure (FAAM), Short Form-36 (SF-36) Physical and Mental Component Summary (PCS and MCS) scores, pain, ankle-related adverse events, and treatment success.
Results:
Five hundred and seventeen participants underwent surgery and completed a baseline assessment. At 24 months, the mean improvement in FAAM activities of daily living (ADL) and SF-36 PCS scores was significantly greater in the TAA group than in the AA group, with a difference between groups of 9 points (95% confidence interval [CI] = 3, 15) and 4 points (95% CI = 1, 7), respectively. The crude incidence risks of revision surgery and complications were greater in the AA group; however, these differences were no longer significant after adjusting for age, sex, BMI, and Functional Comorbidity Index (FCI). The treatment success rate was greater after TAA than after AA for those with an FCI of 4 (80% versus 62%) and not fully employed (81% versus 58%) but similar for those with an FCI score of 2 (81% versus 77%) and full-time employment (79% versus 78%).
Conclusions:
At 2-year follow-up, both AA and TAA were effective. Improvement in several patient-reported outcomes was greater after TAA than after AA, without a significant difference in the rates of revision surgery and complications.
Level of Evidence:
Therapeutic Level II. See Instructions for Authors for a complete description of levels of evidence.
Ankle osteoarthritis is estimated to occur in 6% of the general population1. Currently, treatment selection is based on surgeon training and surgeon/patient preference without evidence to assist in the decision. There has been a substantial upward trend in total ankle replacement (TAA) while ankle arthrodesis (AA) rates have remained static2. Several systematic reviews3-7 suggest a significant gap in the comparative effectiveness and safety evidence for these 2 alternatives.
Some researchers have argued, without evidence, that the ideal patient for TAA is older, thinner, and more sedentary than the ideal patient for AA8. Some surgeons have found that young, active patients are choosing TAA because they believe that sparing the motion of the ankle will allow them to remain active8,9.
This study evaluated TAA and AA groups from preoperatively to 24 months after surgery to (1) compare changes in overall physical and mental function, ankle-specific function, and pain intensity; (2) compare the rates of major revisions, minor revisions, and minor complications; and (3) explore heterogeneous treatment effects due to age, body mass index (BMI), patient sex, comorbidities, and employment.
Materials and Methods
This prospective cohort study included 6 sites with recruitment beginning in May 2012 and ending in May 2015. The study was conducted in accordance with the procedures approved by human subjects review boards at each participating institution and was registered in ClinicalTrials.gov (NCT01620541).
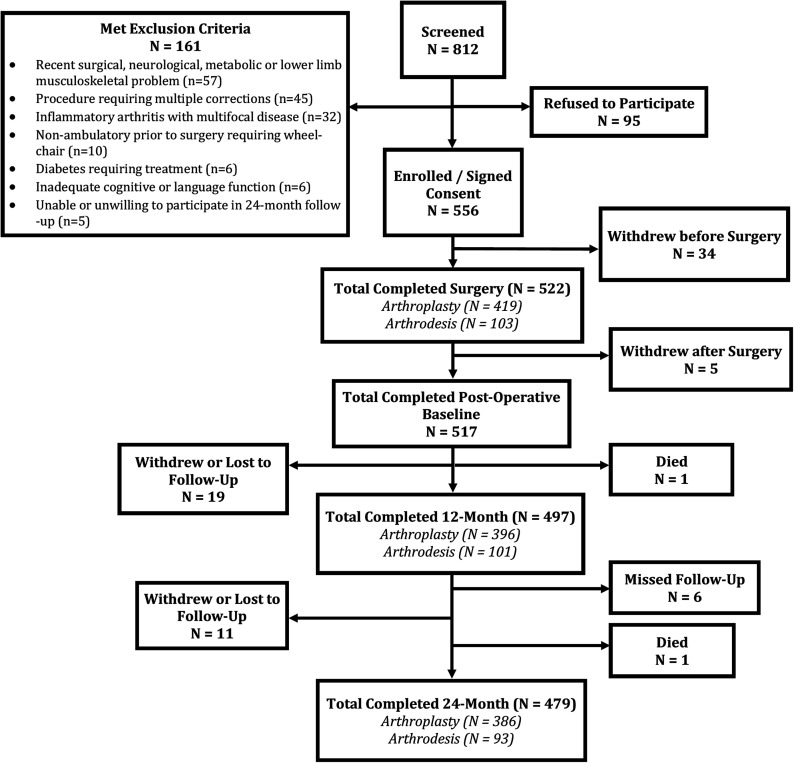
Inclusion criteria ensured that patients had had unsuccessful nonoperative management and were eligible for both treatments while exclusion criteria were disabilities or diseases other than osteoarthritis that affected ambulatory function, including metabolic, neurologic, or musculoskeletal diseases such as hip or knee osteoarthritis. We also excluded operations requiring multiple planned corrective procedures, patients treated for diabetes or multifocal inflammatory disease, those with inadequate cognitive function, and those who were unwilling to participate. Eight hundred and twelve consecutive patients were screened for participation, and 522 consented to participate in the study and underwent the surgery at one of the study centers. Reasons for non-inclusion are listed in Figure 1. Those who withdrew after consenting but before surgery did so because they opted not to have surgery or to seek it elsewhere.
Fig. 1.
STROBE (Strengthening the Reporting of Observational Studies in Epidemiology) diagram of the patients who were screened, enrolled, and seen at 12-month and 24-month follow-up.
Several baseline risk factors were collected through interview and medical record review, including demographics, ankle-specific characteristics (e.g., subluxation and alignment based on the tibial-axis-to-talus ratio10), osteoarthritis severity according to the Kellgren-Lawrence grading scale11, the Functional Comorbidity Index (FCI)12, and alcohol and tobacco use (Table I).
TABLE I.
Comparison of Baseline Characteristics Between TAA and AA Groups
| Characteristic | TAA* (N = 414) | AA (N = 103) | P Value | Total (N = 517) |
| Male sex† | 237 (57) | 61 (59) | 0.72 | 298 (58) |
| Age‡ (yr) | 63.2 ± 9.7 | 54.2 ± 12.7 | <0.01 | 61.4 ± 10.9 |
| BMI‡ (kg/m2) | 29.9 ± 5.5 | 33.1 ± 7.2 | <0.01 | 30.5 ± 6.0 |
| Race† | 0.78 | |||
| White/Caucasian | 403 (97) | 100 (97) | 503 (97) | |
| Non-white | 11 (3) | 3 (3) | 14 (3) | |
| Marital status (married)† | 327 (79) | 71 (69) | 0.08 | 398 (77) |
| College graduate† | 246 (59) | 58 (56) | 0.53 | 304 (59) |
| Full-time employment† | 155 (37) | 53 (51)§ | 0.01 | 208 (40) |
| Income (≥$75,001)† | 193 (47) | 33 (32) | <0.01 | 226 (44) |
| Cause of end-stage ankle arthritis† | 0.05 | |||
| Posttraumatic | 213 (51) | 70 (68) | 283 (55) | |
| Recurrent sprains | 53 (13) | 10 (10) | 63 (12) | |
| Degenerative | 71 (17) | 10 (10) | 81 (16) | |
| Instability | 50 (12) | 6 (6) | 56 (11) | |
| Misalignment | 16 (4) | 3 (3) | 19 (4) | |
| Other | 11 (3) | 4 (4) | 15 (3) | |
| Previous foot/ankle surgery† | 237 (57) | 77 (75) | <0.01 | 314 (61) |
| Radiographic findings | ||||
| Osteoarthritis severity grade† | 0.13 | |||
| 0-1 | 4 (1) | 2 (2) | 6 (1) | |
| 2 | 21 (5) | 9 (9) | 30 (6) | |
| 3 | 93 (22) | 29 (28) | 122 (24) | |
| 4 | 296 (71) | 63 (61) | 359 (69) | |
| Alignment‡ (°) | 8.7 ± 8.8 | 9.2 ± 9.3 | 0.64 | 8.8 ± 8.9 |
| Subluxation‡ (°) | 16.4 ± 18.6# | 13.5 ± 17.8 | 0.15 | 15.8 ± 18.4 |
| Medical history/comorbidities | ||||
| Osteoporosis† | 43 (10) | 5 (5) | 0.08 | 48 (9) |
| Depression and/or anxiety† | 31 (7) | 22 (21) | <0.01 | 53 (10) |
| Degenerative disc disease† | 75 (18) | 23 (22) | 0.33 | 98 (19) |
| FCI‡ | 2.7 ± 1.5 | 3.4 ± 2.1 | <0.01 | 2.9 ± 1.7 |
| Current smoker† | 8 (2) | 10 (10) | <0.01 | 18 (3) |
| Current alcohol use ≥6 times/wk† | 61 (15) | 11 (11) | 0.19 | 72 (14) |
Of the 414 TAAs, 211 (51.0%) were a Salto Talaris Ankle (Integra LifeSciences); 174 (42.0%), an INBONE Total Ankle System (Wright Medical); 23 (5.6%), a STAR (Scandinavian Total Ankle Replacement) Total Ankle Replacement (Stryker); 5 (1.2%), a Trabecular Metal Total Ankle (Zimmer Biomet); and 1 (0.2%), other.
The values are given as the number with the percentage in parentheses.
The values are given as the mean and standard deviation.
Data missing for 1 patient.
Data missing for 2 patients.
Both procedures were performed following the standard of care. A previous study demonstrated that implant survival rates after TAA were significantly higher after the surgeon’s first 30 procedures13, which was the minimum threshold for surgeons participating in our study. The study was designed as a comprehensive cohort, with patients first asked to be randomized to a treatment group and, if they were not willing, then treated with their preference. Participating surgeons agreed that only subjects eligible for both treatments would be enrolled as defined by our inclusion and exclusion criteria. Subjects were informed that both treatments were approved and neither was considered a “better” intervention. Because no patient agreed to randomization, treatment choices were based on patient preference.
Outcomes were measured at 6, 12, and 24 months after surgery. The primary outcomes included the Foot and Ankle Ability Measure (FAAM)14, the Short Form-36 (SF-36) Physical and Mental Component Summary (PCS and MCS) scores, the Chronic Pain Grade (CPG)15, and the FCI12.
The FAAM, which measures several functional categories, is easily scored and has been validated against the SF-36 PCS score14. It is reproducible, internally consistent, and responsive14. It consists of 29 items measuring 2 separate subscales: activities of daily living (ADL) and sports. All scores are standardized (0% to 100%), with higher percentages representing greater function. Its minimal clinically important difference is 9 points16.
The SF-36 is a generic health survey with 36 questions. We assessed the PCS and MCS scores.
Pain was assessed using 2 questions from the CPG15, including intensity of present ankle pain and intensity of worst ankle pain in the past 6 months.
Secondary outcomes included ankle adverse events, which were rigorously collected and monitored by a data safety monitoring board17. We classified these as (1) major revisions (reoperations requiring non-weight-bearing and/or removal of the implant), (2) minor revisions (reoperations not requiring non-weight-bearing or implant removal), and (3) minor complications (no reoperation)17.
We created a “treatment success” variable for the subgroup analysis. This was defined as a minimal clinically important improvement in the FAAM ADL score without a minor or major revision.
Statistical Analysis
Group differences in continuous and categorical variables were assessed using 2-sample t tests and chi-square tests, respectively. Potential confounders were rigorously evaluated. The traditional confounders (age, sex, and BMI) were included as covariates in all analyses. All other potential confounders were included in each regression analysis if they were deemed to have a potential effect on outcome on the basis of an a priori literature review and clinical experience, were unequally distributed between surgical groups (p < 0.10), and were associated with the outcome (p < 0.10). These included the cause of the arthritis, prior surgery, employment status, depression and/or anxiety, and current smoking.
Linear mixed effects regression was used to determine if there were differences in postoperative improvement in each continuous outcome between the surgical procedures. Patient-reported outcomes (FAAM ADL, FAAM Sports, SF-36 PCS, SF-36 MCS, present pain, and worst pain) were the dependent variables. The study visit (baseline or 6, 12, or 24 months posttreatment), surgical procedure, and potential confounders were the independent fixed main effects. All models included main-effect variables-by-study-visit interactions to estimate the difference in postoperative improvement by surgical procedure while adjusting for improvement due to the potential confounders. The surgical institution and patient were random effects. Means and 95% confidence intervals (CIs) for improvement stratified by surgical procedure and differences in improvement by surgical procedure were estimated using simultaneous inference18.
To estimate the effect of the surgical procedure on categorical outcomes (ankle adverse events and treatment success), we performed logistic regression of categorical outcome (the dependent variable) on surgical procedure, with the covariates of age, BMI, sex, and those variables identified as potential confounders. Results are summarized with odds ratios (ORs) and 95% CIs.
To determine if age, BMI, sex, FCI score, or employment (employed versus not employed) subgroups experienced different treatment success outcomes on the basis of the surgical procedure, a 2-way interaction term (surgical procedure by subgroup) was added to the logistic regression model of treatment success, with each subgroup interaction tested in a separate model. If the interaction term was significant, post-hoc analyses were carried out to estimate treatment success and 95% CIs across surgical procedures and selected levels of the subgroup based on quartiles for the continuous variables (age, BMI, or FCI score) and to test for differences in improvement by surgery type stratified by the subgroup.
Significance was set at p < 0.05. Analyses were carried out using Stata 9.1 (StataCorp) and R 3.3.219 with additional packages: lme420, multcomp18, lsmeans21, nnet22, and ggplot223.
Results
Of the 522 participants who consented and had surgery, 419 underwent TAA and 103 underwent AA. Five patients withdrew immediately after undergoing TAA, leaving 517 who completed the full baseline assessment. Follow-up scores were available for 504 (97%), 497 (96%), and 479 (93%) of the patients at 6, 12, and 24 months, with 386 (93%) in the TAA group and 93 (90%) in the AA group, respectively, followed at 24 months (Fig. 1).
The 2 groups were not significantly different with regard to sex, race, marital status, education, severity of osteoarthritis, alignment, osteoporosis, degenerative disc disease, or alcohol use (Table I), and there was no significant difference in preoperative patient-reported measures (Table II). Patients who received TAA were older, had a lower BMI, had higher income, had lower FCI scores, were employed less, and had lower rates of posttraumatic end-stage ankle arthritis, previous ankle surgery, anxiety and/or depression, and smoking.
TABLE II.
Change in Outcome Measures from Preoperative to 6, 12, and 24 Months, and Comparison of These Changes Between TAA and AA Groups*
| TAA (N = 414) | AA (N = 103) | TAA Minus AA | |
| No. of patients | |||
| Preop. | 414 | 103 | |
| 6 mo | 406 | 98 | |
| 12 mo | 396 | 101 | |
| 24 mo | 386 | 93 | |
| FAAM ADL† | |||
| Preop. | 46.7 ± 1.2 | 48.6 ± 1.9 | −1.9 ± 2.0 (−7.4, 3.6) |
| 6 mo vs. preop. | 31.2 ± 0.9 (28.9, 33.6) | 19.7 ± 1.9 (14.6, 24.7) | 11.6 ± 2.1 (5.8, 17.3) |
| 12 mo vs. preop. | 34.7 ± 0.9 (32.3, 37.1) | 23.1 ± 1.9 (18.0, 28.1) | 11.6 ± 2.1 (5.9, 17.3) |
| 24 mo vs. preop. | 35.0 ± 0.9 (32.6, 37.4) | 26.3 ± 1.9 (21.1, 31.5) | 8.7 ± 2.2 (2.8, 14.5) |
| P value | <0.0001 | <0.0001 | <0.0001 |
| FAAM Sports† | |||
| Preop. | 19.8 ± 2.0 | 21.9 ± 2.9 | −2.1 ± 2.8 (−9.6, 5.5) |
| 6 mo vs. preop. | 33.0 ± 1.3 (29.5, 36.5) | 20.6 ± 2.8 (13.1, 28.0) | 12.4 ± 3.1 (4.0, 20.9) |
| 12 mo vs. preop. | 39.4 ± 1.3 (35.8, 42.9) | 23.2 ± 2.8 (15.7, 30.7) | 16.2 ± 3.1 (7.7, 24.7) |
| 24 mo vs. preop. | 39.7 ± 1.3 (36.0, 43.3) | 31.6 ± 2.8 (23.9, 39.2) | 8.1 ± 3.2 (−0.6, 16.8) |
| P value | <0.0001 | <0.0001 | <0.0001 |
| SF-36 PCS† | |||
| Preop. | 34.1 ± 0.5 | 35.8 ± 0.9 | −1.6 ± 1.0 (−4.4, 1.1) |
| 6 mo vs. preop. | 11.6 ± 0.4 (10.5, 12.8) | 7.7 ± 0.9 (5.3, 10.2) | 3.9 ± 1.0 (1.1, 6.7) |
| 12 mo vs. preop. | 12.9 ± 0.4 (11.7, 14.0) | 8.0 ± 0.9 (5.6, 10.5) | 4.8 ± 1.0 (2.1, 7.6) |
| 24 mo vs. preop. | 12.3 ± 0.4 (11.2, 13.5) | 8.2 ± 0.9 (5.7, 10.7) | 4.1 ± 1.0 (1.3, 6.9) |
| P value | <0.0001 | <0.0001 | <0.0001 |
| SF-36 MCS† | |||
| Preop. | 55.5 ± 0.5 | 54.0 ± 0.9 | 1.5 ± 1.0 (−1.3, 4.2) |
| 6 mo vs. preop. | 0.8 ± 0.4 (−0.3, 2.0) | −1.0 ± 0.9 (−3.4, 1.5) | 1.8 ± 1.0 (−1.0, 4.6) |
| 12 mo vs. preop. | 1.0 ± 0.4 (−0.1, 2.2) | 0.8 ± 0.9 (−1.7, 3.3) | 0.3 ± 1.0 (−2.6, 3.1) |
| 24 mo vs. preop. | 0.8 ± 0.4 (−0.4, 1.9) | 1.9 ± 0.9 (−0.6, 4.5) | −1.2 ± 1.1 (−4.1, 1.7) |
| P value | 0.46 | 0.010 | 0.081 |
| Present pain† | |||
| Preop. | 5.1 ± 0.2 | 5.4 ± 0.3 | −0.3 ± 0.3 (−1.0, 0.4) |
| 12 mo vs. preop. | −3.8 ± 0.1 (−4.2, −3.5) | −3.7 ± 0.3 (−4.4, −2.9) | −0.1 ± 0.3 (−1.0, 0.7) |
| 24 mo vs. preop. | −3.8 ± 0.1 (−4.1, −3.4) | −3.6 ± 0.3 (−4.3, −2.8) | −0.2 ± 0.3 (−1.0, 0.7) |
| P value | <0.0001 | <0.0001 | 0.84 |
| Worst pain† | |||
| Preop. | 8.5 ± 0.2 | 8.4 ± 0.3 | 0.1 ± 0.3 (−0.6, 0.9) |
| 12 mo vs. preop. | −4.9 ± 0.1 (−5.3, −4.6) | −4.1 ± 0.3 (−4.9, −3.3) | −0.9 ± 0.3 (−1.7, 0.0) |
| 24 mo vs. preop. | −5.4 ± 0.1 (−5.8, −5.1) | −4.3 ± 0.3 (−5.1, −3.6) | −1.1 ± 0.3 (−2.0, −0.2) |
| P value | <0.0001 | <0.0001 | 0.003 |
Linear mixed effects regression of outcome on study visit-by-surgery type interaction. All models included confounders of age, sex, and BMI. Additional confounders include arthritis cause and previous surgery for FAAM ADL; employment for FAAM Sport; employment, depression and/or anxiety history, and current smoking for SF-36 MCS; and previous surgery, depression and/or anxiety history, FCI, and current smoking for present pain. Site and patient within site were modeled as random. The p values were derived with the omnibus test to determine significant improvement in outcome across the study follow-up period (first 2 columns) or the differences in improvement by surgery type (third column). Differences in bold are significant (p < 0.05) after adjustment for multiple comparisons within the same model.
The scores are given as the mean and standard deviation with or without the 95% CI in parentheses.
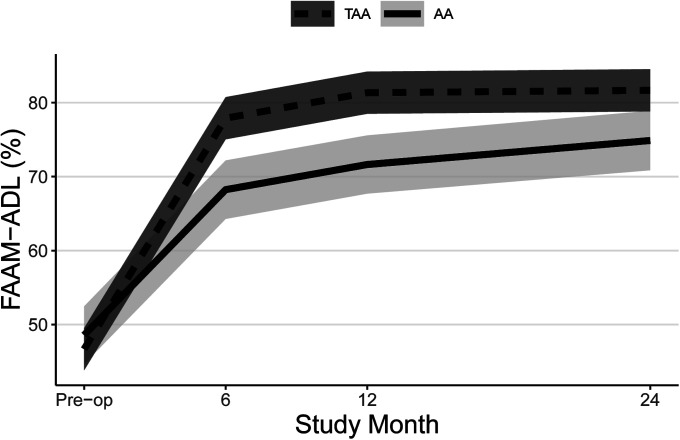
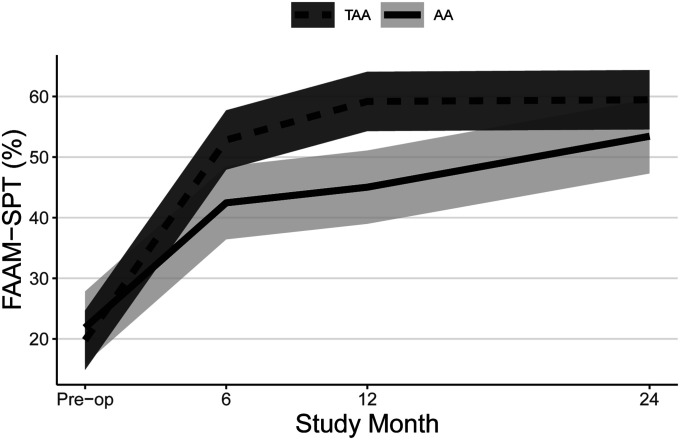
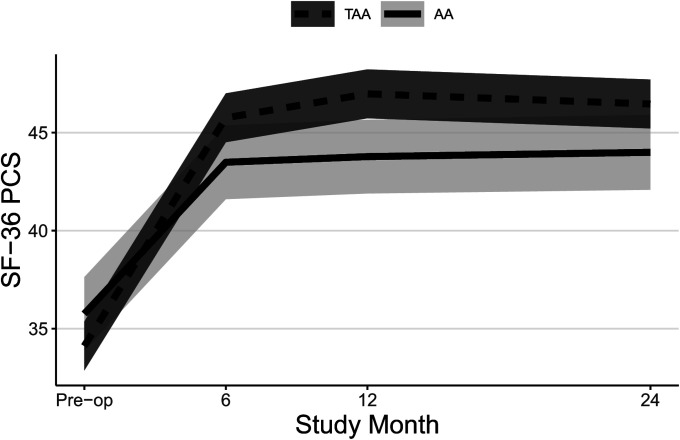
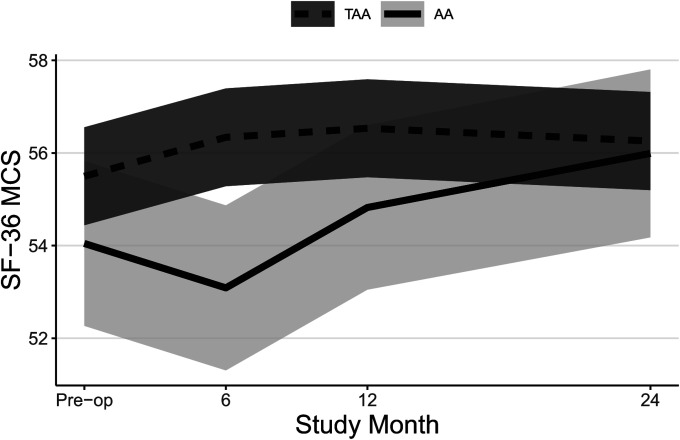
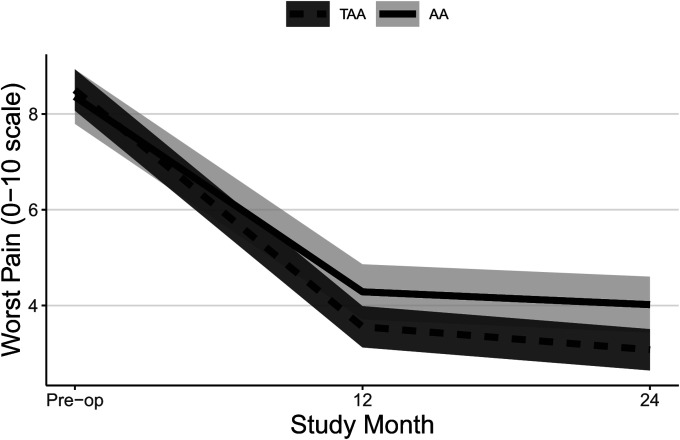
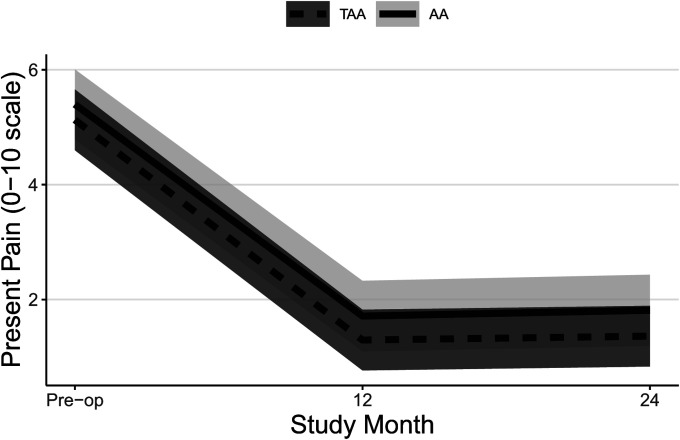
Both groups experienced significant improvements in FAAM ADL and Sports subscale scores (Table II, Figs. 2-A and 2-B, and Appendix Figs. 1-A and 1-B) and SF-36 PCS scores (Table II, Fig. 3-A, and Appendix Fig. 2-A) at all time points, and patients who underwent TAA demonstrated significantly greater improvement after adjustment for potential confounders. At 24 months, the mean improvement in the FAAM ADL and SF-36 PCS scores was significantly greater for the TAA group than for the AA group, with mean differences between groups of 9 points (95% CI = 3, 15) and 4 points (95% CI = 1, 7), respectively. While the TAA group had significantly greater improvement in the FAAM Sports scores than the AA group at 6 and 12 months, by 24 months the difference in improvement (8 points, 95% CI = −1, 17) was not quite clinically relevant. Neither group had a significant change in their SF-36 MCS scores (Table II, Fig. 3-B, and Appendix Fig. 2-B). Both groups had a significant improvement in their pain scores at all time points. The TAA group had significantly greater improvement in the score for worst pain at 24 months (Table II, Fig. 4-A, and Appendix Fig. 3-A), but the scores for present pain did not differ significantly between groups (Table II, Fig. 4-B, and Appendix Fig. 3-B). The greatest improvements occurred in the first 6 months for the FAAM and SF-36 PCS scores and in the first 12 months for pain scores, with more modest improvement thereafter. At 24 months, the incidence risk of any ankle adverse event was 22% (n = 23) for the patients who underwent AA compared with 12% (n = 48) for the TAA group (Table III and Appendix Tables S1A and S1B). However, when we controlled for age, BMI, sex, and FCI, the increased risk of an ankle adverse event was no longer significant (adjusted incidence risks: 18% compared with 12%, OR = 1.7, 95% CI = 0.90 to 3.1; p = 0.11). A detailed list of these adverse events by surgical procedure is presented in the Appendix.
Figs. 2-A and 2-B Mean trajectory for FAAM ADL (Fig. 2-A) and FAAM Sports (SPT) (Fig. 2-B) scores (%) by study visit and surgery type with 95% CIs. Estimates were obtained from linear mixed effects regression of outcome on study visit, surgery type, and visit-by-surgery type interaction. All models included confounders of age, sex, and BMI. Additional confounders include the cause of the end-stage ankle arthritis and previous surgery for FAAM ADL and employment for FAAM Sports.
Fig. 2-A.
Fig. 2-B.
Figs. 3-A and 3-B Mean trajectory for SF-36 PCS (Fig. 3-A) and SF-36 MCS (Fig. 3-B) scores by study visit and surgery type with 95% CIs. Estimates were obtained from linear mixed effects regression of outcome on study visit, surgery type, and visit-by-surgery type interaction. All models included confounders of age, sex, and BMI. Additional confounders included employment, a history of depression and/or anxiety, and current smoking for SF-36 MCS.
Fig. 3-A.
Fig. 3-B.
Figs. 4-A and 4-B Mean trajectory for worst pain (Fig. 4-A) and present pain (Fig. 4-B) scores by study visit and surgery type with 95% CIs. Estimates were obtained from linear mixed effects regression of outcome on study visit, surgery type, and visit-by-surgery type interaction. All models included confounders of age, sex, and BMI. Additional confounders included previous surgery and/or a history of depression and/or anxiety, FCI, and current smoking for present pain.
Fig. 4-A.
Fig. 4-B.
TABLE III.
Comparison of Adverse Events Within First 24 Months Between TAA and AA Groups
| Adverse Event* | No. (%) | P Value | Relative Risk (95% CI) for TAA Vs. AA | |
| TAA (N = 414) | AA (N = 103) | |||
| Minor complication | 18 (4.3) | 4 (3.9) | 0.83 | 0.89 (0.31, 2.6) |
| Minor revision | 17 (4.1) | 13 (12.6) | <0.001 | 3.1 (1.5, 6.1) |
| Major revision | 13 (3.1) | 6 (5.8) | 0.20 | 1.8 (0.72, 4.8) |
| Total events | 48 (11.6) | 23 (22.3) | 0.005 | 1.9 (1.2, 3.0) |
Minor complications were defined as adverse events not requiring a reoperation; minor revisions, as reoperations not requiring non-weight-bearing or implant removal; and major revisions, as reoperations requiring non-weight-bearing and/or removal of the implant.
The 24-month treatment success rate was significantly higher (p = 0.016) for TAA (81%, 95% CI = 76%, 84%) than for AA (68%, 95% CI = 58%, 77%) (OR = 1.9, 95% CI = 1.1, 3.2) after adjusting for age, sex, BMI, and FCI. For 24-month treatment success by surgical procedure, heterogeneity of treatment effect among prespecified subgroups was found for the FCI score and employment (p < 0.05, Table IV). Treatment success differed according to surgical procedure in patients with a higher FCI (i.e., an index of 4), with an 80% success rate in the TAA group versus a 62% rate in the AA group, but not for those with a lower FCI (i.e., 2) with an 81% success rate in the TAA group versus a 77% rate in the AA group. Similarly, treatment success differed by surgical procedure for those without full-time employment (81% in the TAA group versus 58% in the AA group) but not for those with full-time employment (79% versus 78%). While no significant heterogeneity of treatment effect was observed for age, BMI, or sex, TAA had higher success rates than AA in males and heavier patients (Table IV).
TABLE IV.
Predicted Treatment Success Rates by Surgery Type (TAA Versus AA) and Effect Modifiers*
| Effect Modifier | % Success (95% CI) | OR (95% CI) for TAA Vs. AA | P Value† | |
| TAA (N = 414) | AA (N = 103) | |||
| Age | ||||
| 50 yr | 76 (69, 83) | 66 (56, 75) | 1.7 (0.92, 3.0) | 0.34 |
| 70 yr | 83 (78, 87) | 67 (50, 80) | 2.5 (1.2, 5.1) | |
| BMI | ||||
| 25 kg/m2 | 79 (73, 84) | 75 (61, 86) | 1.2 (0.58, 2.6) | 0.10 |
| 35 kg/m2 | 82 (76, 87) | 67 (55, 76) | 2.3 (1.3, 4.1) | |
| Sex | ||||
| Male | 80 (74, 85) | 61 (48, 72) | 2.6 (1.4, 4.9) | 0.12 |
| Female | 81 (75, 86) | 79 (64, 89) | 1.2 (0.51, 2.7) | |
| FCI | ||||
| 2 | 81 (76, 85) | 77 (65, 86) | 1.3 (0.66, 2.4) | 0.012 |
| 4 | 80 (75, 85) | 62 (51, 73) | 2.5 (1.4, 4.4) | |
| Employment | ||||
| Employed | 79 (72, 85) | 78 (65, 88) | 1.1 (0.49, 2.3) | 0.029 |
| Not employed | 81 (76, 86) | 58 (43, 71) | 3.1 (1.6, 6.2) | |
Estimated from logistic regression of treatment success on effect modifier-by-surgery type interaction. All models included confounders of age, sex, BMI, and FCI.
The p values represent the significance of the effect modifier-by-surgery type interaction. Differences in bold are significant (p < 0.05) after adjusting for multiple comparisons within the same model.
Discussion
With no viable surgical alternatives, AA was long considered the treatment for end-stage ankle arthritis. TAA is a more recent option, and its utilization is increasing2. There is limited comparative data on these 2 treatments. Daniels et al. compared 232 TAAs and 89 AAs from 4 centers at a postoperative mean of 5.5 years24. Both groups reported improvements in the Ankle Osteoarthritis Score (AOS). While no significant difference was detected between groups, the change in AOS must be large to reflect clinically meaningful change25. Saltzman et al. compared 158 TAAs and 66 AAs and found a higher risk of unplanned secondary surgery but a greater improvement in the Buechel-Pappas functional score in the TAA group26. There was no difference in pain relief. Benich et al. compared change scores for pain and function as measured with the SF-36 and Musculoskeletal Function Assessment at 3 years after treatment and found greater improvement in their TAA group compared with their AA group27.
Authors of a recent meta-analysis5 evaluating 10 studies concluded that TAA and AA produce similar outcomes, especially at short-term follow-up, with an increased risk of complications after TAA. These studies were limited by several methodological weaknesses, and the authors recommended additional high-quality research comparing these 2 treatments over a longer follow-up.
A recently published cost-benefit analysis estimated that, compared with nonoperative treatment, TAA resulted in a $5,900 lifetime cost savings and AA, in a $800 lifetime cost savings28. The authors concluded that continued research is needed to define appropriate subgroups of patients who would likely derive the greatest clinical benefit from TAA.
In the current study, both groups experienced significant improvements in several validated patient-reported outcomes except for the SF-36 MCS. The majority of these improvements occurred in the first 6 to 12 months. The TAA group experienced greater gains in almost all outcomes. To reduce the importance of differences in baseline severity, we used the change from baseline as our outcome rather than population averages and eliminated other systemic issues such as inflammatory arthritis or recent surgery. To reduce the impact of surgeon inexperience, we required a defined level of experience for participation.
With respect to ankle adverse events, the crude incidence risk was greater in the AA group; however, this difference was no longer significant after adjusting for potential confounders. These findings are consistent with our previously reported 12-month results17.
The evaluation of the heterogeneity of treatment effects has been encouraged by many proponents of comparative effectiveness research. Not all patients benefit to the same degree from a medical treatment intervention. This can make it difficult for the patient and clinician to choose the most appropriate treatment intervention. We identified heterogeneity of treatment effects across subgroups of treatment responders using an outcome that we defined (not reported previously in the literature) as “treatment success.” Our a priori hypotheses were based on clinical experience and widely held clinical beliefs regarding treatment selection. We thought that patients who have more comorbidities and those who are not employed respond best to TAA in terms of the results at 24 months after surgery. Those with fewer comorbidities (i.e., healthier) and who are employed respond similarly to either treatment. It may be that patients who have vulnerabilities (which may be associated with a lack of full-time employment and/or more comorbidities) have better success with TAA.
We did not confirm the widely held beliefs that patients who are younger, heavier, or more active should undergo AA, although the effects of BMI and younger age on implant durability are not likely to be seen in the first 2 years of follow-up.
Our heterogeneity of treatment effect analysis should be interpreted with caution. While we prespecified subgroups on the basis of clinical experience, there is scant literature to support these hypotheses. The findings are borderline significant—i.e., potentially due to chance alone. Therefore, we consider our findings hypothesis-generating, and we believe that they should be confirmed by longer follow-up.
This study has limitations. First, it was initially designed as a Brewin-Bradley partially randomized preference trial. Subjects were informed that both treatments were approved and that neither was considered a “better” intervention. Despite this, patients were unwilling to agree to randomization, which forced a change to a cohort design. As a result, an imbalance in the study groups in some baseline characteristics was observed. This may have been due to bias in provider preference, in the patients’ previsit perceptions, or in the patients’ selection of a surgeon with ankle replacement expertise, which is not universally available. These imbalances may lead to confounding; however, there was little statistical confounding as results for patient-reported outcomes were consistent whether or not there was adjustment for confounders.
There is strong evidence that observational studies, if conducted with a rigor similar to that used in a clinical trial, can approximate the results of a randomized trial29-32. Despite these examples, we acknowledge that an observational study cannot eliminate all bias that would be mitigated by a randomized trial. There is still the possibility of residual confounding due to unmeasured confounders such as restricted motion and other factors not captured. Therefore, investigators in future studies should continue encouraging random allocation and/or other methods to control for confounding, such as propensity scoring or causal analysis methods.
Another important limitation of this study is the 2-year follow-up. Although most improvement occurred within 6 months after treatment, both of these procedures are intended to provide benefit for a much longer duration. It is not clear if these differences will be sustained. This short follow-up cannot address wear of the implants or wear of the surrounding joints. Further long-term follow-up will be reported in subsequent publications.
The improvement between the preoperative and postoperative status was greater for the TAA group than for the AA group in terms of the FAAM scores, SF-36 PCS scores, and treatment success rates. Preliminary results suggest that there are specific subgroups of patients who may respond more favorably to TAA than others.
Appendix
Supporting material provided by the authors is posted with the online version of this article as a data supplement at jbjs.org (http://links.lww.com/JBJS/F396).
Acknowledgments
Note: The study team thanks the research coordinators who were responsible for obtaining informed consent, data collection, and managing study operations: Marisa Benich, Debra Brovelli, Amber Curtis, Michelle Padley, Becky Stone, Jennifer Hicks, Erin Zimmerman, Alan Wesley, and Jacynda Wheeler. They also thank Ian Ellis for data entry and data management.
Footnotes
Investigation performed at Center for Limb Loss and MoBility (CLiMB), VA Puget Sound Health Care System, Seattle, Washington
A commentary by Ronald W. Smith, MD, is linked to the online version of this article at jbjs.org.
Disclosure: This project was funded by National Institutes of Health (NIH) grant number R01 AR056316. The NIH played no role in the investigation. On the Disclosure of Potential Conflicts of Interest forms, which are provided with the online version of the article, one or more of the authors checked “yes” to indicate that the author had a relevant financial relationship in the biomedical arena outside the submitted work (http://links.lww.com/JBJS/F395).
Data Sharing
A data-sharing statement is provided with the online version of the article (http://links.lww.com/JBJS/F397).
References
- 1.Huch K, Kuettner KE, Dieppe P. Osteoarthritis in ankle and knee joints. Semin Arthritis Rheum. 1997. February;26(4):667-74. [DOI] [PubMed] [Google Scholar]
- 2.Pugely AJ, Lu X, Amendola A, Callaghan JJ, Martin CT, Cram P. Trends in the use of total ankle replacement and ankle arthrodesis in the United States Medicare population. Foot Ankle Int. 2014. March;35(3):207-15. Epub 2013 Oct 31. [DOI] [PubMed] [Google Scholar]
- 3.Haddad SL, Coetzee JC, Estok R, Fahrbach K, Banel D, Nalysnyk L. Intermediate and long-term outcomes of total ankle arthroplasty and ankle arthrodesis. A systematic review of the literature. J Bone Joint Surg Am. 2007. September;89(9):1899-905. [DOI] [PubMed] [Google Scholar]
- 4.Jordan RW, Chahal GS, Chapman A. Is end-stage ankle arthrosis best managed with total ankle replacement or arthrodesis? A systematic review. Adv Orthop. 2014;2014:986285 Epub 2014 Aug 21. [DOI] [PMC free article] [PubMed] [Google Scholar]
- 5.Kim HJ, Suh DH, Yang JH, Lee JW, Kim HJ, Ahn HS, Han SW, Choi GW. Total ankle arthroplasty versus ankle arthrodesis for the treatment of end-stage ankle arthritis: a meta-analysis of comparative studies. Int Orthop. 2017. January;41(1):101-9. Epub 2016 Oct 7. [DOI] [PubMed] [Google Scholar]
- 6.Lawton CD, Butler BA, Dekker RG, 2nd, Prescott A, Kadakia AR. Total ankle arthroplasty versus ankle arthrodesis-a comparison of outcomes over the last decade. J Orthop Surg Res. 2017. May 18;12(1):76. [DOI] [PMC free article] [PubMed] [Google Scholar]
- 7.Maffulli N, Longo UG, Locher J, Romeo G, Salvatore G, Denaro V. Outcome of ankle arthrodesis and ankle prosthesis: a review of the current status. Br Med Bull. 2017. December 1;124(1):91-112. [DOI] [PubMed] [Google Scholar]
- 8.Wood PL, Clough TM, Smith R. The present state of ankle arthroplasty. Foot Ankle Surg. 2008;14(3):115-9. Epub 2008 Jul 7. [DOI] [PubMed] [Google Scholar]
- 9.Bonnin MP, Laurent JR, Casillas M. Ankle function and sports activity after total ankle arthroplasty. Foot Ankle Int. 2009. October;30(10):933-44. [DOI] [PubMed] [Google Scholar]
- 10.Tochigi Y, Suh JS, Amendola A, Pedersen DR, Saltzman CL. Ankle alignment on lateral radiographs. Part 1: sensitivity of measures to perturbations of ankle positioning. Foot Ankle Int. 2006. February;27(2):82-7. [DOI] [PMC free article] [PubMed] [Google Scholar]
- 11.Holzer N, Salvo D, Marijnissen AC, Vincken KL, Ahmad AC, Serra E, Hoffmeyer P, Stern R, Lübbeke A, Assal M. Radiographic evaluation of posttraumatic osteoarthritis of the ankle: the Kellgren-Lawrence scale is reliable and correlates with clinical symptoms. Osteoarthritis Cartilage. 2015. March;23(3):363-9. Epub 2014 Nov 15. [DOI] [PubMed] [Google Scholar]
- 12.Groll DL, To T, Bombardier C, Wright JG. The development of a comorbidity index with physical function as the outcome. J Clin Epidemiol. 2005. June;58(6):595-602. [DOI] [PubMed] [Google Scholar]
- 13.Henricson A, Skoog A, Carlsson A. The Swedish Ankle Arthroplasty Register: an analysis of 531 arthroplasties between 1993 and 2005. Acta Orthop. 2007. October;78(5):569-74. [DOI] [PubMed] [Google Scholar]
- 14.Martin RL, Irrgang JJ, Burdett RG, Conti SF, Van Swearingen JM. Evidence of validity for the Foot and Ankle Ability Measure (FAAM). Foot Ankle Int. 2005. November;26(11):968-83. [DOI] [PubMed] [Google Scholar]
- 15.Smith BH, Penny KI, Purves AM, Munro C, Wilson B, Grimshaw J, Chambers WA, Smith WC. The Chronic Pain Grade questionnaire: validation and reliability in postal research. Pain. 1997. June;71(2):141-7. [DOI] [PubMed] [Google Scholar]
- 16.Kivlan BR, Martin RL, Wukich DK. Responsiveness of the Foot and Ankle Ability Measure (FAAM) in individuals with diabetes. Foot (Edinb). 2011. June;21(2):84-7. Epub 2011 May 7. [DOI] [PubMed] [Google Scholar]
- 17.Norvell DC, Shofer JB, Hansen ST, Davitt J, Anderson JG, Bohay D, Coetzee JC, Maskill J, Brage M, Houghton M, Ledoux WR, Sangeorzan BJ. Frequency and impact of adverse events in patients undergoing surgery for end-stage ankle arthritis. Foot Ankle Int. 2018. September;39(9):1028-38. Epub 2018 May 31. [DOI] [PMC free article] [PubMed] [Google Scholar]
- 18.Hothorn T, Bretz F, Westfall P. Simultaneous inference in general parametric models. Biom J. 2008. June;50(3):346-63. [DOI] [PubMed] [Google Scholar]
- 19.R: a language and environment for statistical computing. R Foundation for Statistical Computing. 2016. [Google Scholar]
- 20.Bates D, Maechler M, Bolker B, Walker S. Fitting linear mixed-effects models using lme4. J Stat Softw. 2015;67(1):1-48. [Google Scholar]
- 21.Lenth RV. Least-squares means: the R package lsmeans. J Stat Softw. 2016;69(1). [Google Scholar]
- 22.Venables WN, Ripley BD. Tree-based methods. In: Modern applied statistics with S. Springer; 2002. p 251-70. [Google Scholar]
- 23.Wickham H. ggplot2: elegant graphics for data analysis. Springer; 2009. [Google Scholar]
- 24.Daniels TR, Younger AS, Penner M, Wing K, Dryden PJ, Wong H, Glazebrook M. Intermediate-term results of total ankle replacement and ankle arthrodesis: a COFAS multicenter study. J Bone Joint Surg Am. 2014. January 15;96(2):135-42. [DOI] [PubMed] [Google Scholar]
- 25.Coe MP, Sutherland JM, Penner MJ, Younger A, Wing KJ. Minimal clinically important difference and the effect of clinical variables on the Ankle Osteoarthritis Scale in surgically treated end-stage ankle arthritis. J Bone Joint Surg Am. 2015. May 20;97(10):818-23. [DOI] [PubMed] [Google Scholar]
- 26.Saltzman CL, Mann RA, Ahrens JE, Amendola A, Anderson RB, Berlet GC, Brodsky JW, Chou LB, Clanton TO, Deland JT, Deorio JK, Horton GA, Lee TH, Mann JA, Nunley JA, Thordarson DB, Walling AK, Wapner KL, Coughlin MJ. Prospective controlled trial of STAR total ankle replacement versus ankle fusion: initial results. Foot Ankle Int. 2009. July;30(7):579-96. [DOI] [PubMed] [Google Scholar]
- 27.Benich MR, Ledoux WR, Orendurff MS, Shofer JB, Hansen ST, Davitt J, Anderson JG, Bohay D, Coetzee JC, Maskill J, Brage M, Houghton M, Sangeorzan BJ. Comparison of treatment outcomes of arthrodesis and two generations of ankle replacement implants. J Bone Joint Surg Am. 2017. November 1;99(21):1792-800. [DOI] [PubMed] [Google Scholar]
- 28.Nwachukwu BU, McLawhorn AS, Simon MS, Hamid KS, Demetracopoulos CA, Deland JT, Ellis SJ. Management of end-stage ankle arthritis: cost-utility analysis using direct and indirect costs. J Bone Joint Surg Am. 2015. July 15;97(14):1159-72. [DOI] [PubMed] [Google Scholar]
- 29.Berger ML, Dreyer N, Anderson F, Towse A, Sedrakyan A, Normand SL. Prospective observational studies to assess comparative effectiveness: the ISPOR Good Research Practices Task Force report. Value Health. 2012. Mar-Apr;15(2):217-30. [DOI] [PubMed] [Google Scholar]
- 30.Benson K, Hartz AJ. A comparison of observational studies and randomized, controlled trials. N Engl J Med. 2000. June 22;342(25):1878-86. [DOI] [PubMed] [Google Scholar]
- 31.Concato J, Lawler EV, Lew RA, Gaziano JM, Aslan M, Huang GD. Observational methods in comparative effectiveness research. Am J Med. 2010. December;123(12)(Suppl 1):e16-23. [DOI] [PubMed] [Google Scholar]
- 32.Kitsios GD, Dahabreh IJ, Abu Dabrh AM, Thaler DE, Kent DM. Patent foramen ovale closure and medical treatments for secondary stroke prevention: a systematic review of observational and randomized evidence. Stroke. 2012. February;43(2):422-31. Epub 2011 Dec 15. [DOI] [PMC free article] [PubMed] [Google Scholar]
Associated Data
This section collects any data citations, data availability statements, or supplementary materials included in this article.
Data Availability Statement
A data-sharing statement is provided with the online version of the article (http://links.lww.com/JBJS/F397).


