Abstract
The intraspecies genomic diversity of the single‐strand RNA (+) virus species hepatitis A virus (Hepatovirus), hepatitis C virus (Hepacivirus), and hepatitis E virus (Orthohepevirus) was compared. These viral species all can cause liver inflammation (hepatitis), but share no gene similarity. The codon usage of human hepatitis A virus (HAV) is suboptimal for replication in its host, a characteristic it shares with taxonomically related rodent, simian, and bat hepatitis A virus species. We found this codon usage to be strikingly similar to that of Triatoma virus that infects blood‐sucking kissing bugs. The codon usage of that virus is well adapted to its insect host. The codon usage of HAV is also similar to other invertebrate viruses of various taxonomic families. An evolutionary ancestor of HAV and related virus species is hypothesized to be an insect virus that underwent a host jump to infect mammals. The similarity between HAV and invertebrate viruses goes beyond codon usage, as they also share amino acid composition characteristics, while not sharing direct sequence homology. In contrast, hepatitis C virus and hepatitis E virus are highly similar in codon usage preference, nucleotide composition, and amino acid composition, and share these characteristics with Human pegivirus A, West Nile virus, and Zika virus. We present evidence that these observations are only partly explained by differences in nucleotide composition of the complete viral codon regions. We consider the combination of nucleotide composition, amino acid composition, and codon usage preference suitable to provide information on possible evolutionary similarities between distant virus species that cannot be investigated by phylogeny.
Keywords: codon bias, comparative genomics, evolution, Hepactovirus A, hepatitis A virus
Codon usage plots of hepatitis A virus (HAV) compared with that of other virus species may suggest HAV originated from an insect virus.

1. INTRODUCTION
Several viral species can cause liver inflammation (hepatitis) in humans. Three of the more common hepatitis viruses contain a genome of positive strand ssRNA: hepatitis A virus (HAV, also known as Hepatovirus A, a Hepatovirus, member of Picornaviridae), hepatitis C virus (HCV Hepacivirus C, a Flaviviridae member), and hepatitis E virus (HEV Orthohepevirus A, of the Hepeviridae family). Other viral species causing human hepatitis can contain an ssRNA(‐) genome (e.g., hepatitis D virus) or are retro‐transcribing viruses (such as the hepatitis B virus). Despite their shared replication strategy, host specificity and tissue tropism, HAV, HCV, and HEV share very little sequence conservation, indicative of their independent evolutionary origins. We compared the genome sequences of a large number of these three viral species to evaluate commonalities and differences between and within the respective clades.
The genome of HAV is approximately 7.5 kb long and encodes a polyprotein that is processed into four structural and six nonstructural proteins by a proteinase (recently reviewed in McKnight & Lemon, 2018). In lack of the cap assembly that is common in other RNA virus species, translation of HAV is initiated by a secondary structure formed by the 5′‐untranscribed region of the RNA genome, which functions as a ribosome entry site (McKnight & Lemon, 2018; Vaughan et al., 2014). Of note is that the codon use of HAV is quite distinct from that of its host, a property that is also reflected by its low GC content (37%); as a consequence, this virus is slow to replicate in human cells. The virus is transmitted via the fecal–oral route, and the relative high stability of unenveloped virus particles in the environment enables transmission via fecally contaminated food and water. Yearly, approximately 1.5 million clinical cases of HAV occur globally, although at least ten times as many new undocumented infections may occur, as suggested by serological evidence (reviewed in Vaughan et al., 2014). The infection is mostly self‐limiting and results in lifelong immunity.
In contrast, infection with HCV is often chronic, and this parentally transmitted virus is one of the leading causes of chronic liver disease. It is responsible for approximately 180 million infections worldwide, with 3 million new infections occurring annually (Preciado et al., 2014). The virus can be transmitted via unsafe medical practices including blood transfusions and needle reuse. As a result, developing countries present higher incidences than developed countries, with vast differences between countries (reviewed in Ansaldi, Orsi, Sticchi, Bruzzone, & Icardi, 2014). The genome of HCV is about 9.6 kb, has a GC content of 56% and codes for a polypeptide that after processing results in 10 mature proteins.
Hepatitis E virus is the latest discovered virus of the three species considered here, but it actually is the most common cause of acute viral hepatitis in humans (Kamar et al., 2017), with an estimated 20 million novel infections worldwide, of which 3 million are symptomatic and around 70,000 are lethal; these may be underestimates, even in developed countries (Webb & Dalton, 2019). Hepatitis E virus is spread via the fecal–oral route as well as by animal contact or via contaminated food of animal origin; parenteral transmission has also been described. Most infections are self‐limiting. The genome of HEV is 7.2 kb with a GC content of 56%, and the 5′‐untranscribed region is capped. The ssRNA(+) genome encodes a large polypeptide of which it is uncertain whether it is active as such or first processed into separate proteins with distinct functions, and 2 shorter proteins, translated from partly overlapping open reading frames (recently reviewed in Primadharsini, Nagashima, & Okamoto, 2019).
All three viral species are subdivided into genotypes and subtypes therein, based on hypervariable regions of their genomes. For HAV, three genotypes that infect humans (I, II and II, each with subtypes A and B) are recognized, and these belong to a single serotype. Three more genotypes are specific to the simian host (Costa‐Mattioli et al., 2003), while a previously described genotype VII is reclassified as IIB. A substitution rate of 9.76 × 10⁻⁴ substitutions per site per year (ssy) was calculated, based on complete VP1 sequences from French genotype IA isolates (Moratorio et al., 2007), but this may be an overestimate, as an analysis of complete genome sequences from multiple countries produced an estimate of 1.00 × 10⁻⁴ ssy (Kulkarni, Walimbe, Cherian, & Arankalle, 2009). Thus, the range is likely to be around one in ten thousand substitutions per site per year, or roughly one or two substitutions per viral genome per year. This reflects the slow evolutionary rate of this virus. A last common ancestor of human HAV and the simian genotypes was estimated to have existed between 1,250 and 3,500 years ago (Kulkarni et al., 2009). However, human HAV is presumed to have originated from a rodent virus as a result of a host jump (Dexler et al., 2015).
The genomic variation of HCV is much more extensive than that of HAV. HCV is subdivided in at least 7 major genotypes, with multiple subtypes therein (Simmonds et al., 2005; Smith et al., 2014). Genetic diversity between the HCV genotypes is about 30%, while subtypes within a given genotype differ by 15%–25% (Hartlage, Cullen, & Kapoor, 2016; Preciado et al., 2014). The different genotypes roughly coincide with geographical distribution, with genotypes 1, 2, and 3 being globally detected; genotypes 4 and 5 are more prevalent in Africa and the Middle East, and genotype 6 is found in Southeast Asia, as is reviewed elsewhere (Ansaldi et al., 2014). The RNA‐dependent RNA polymerase of HCV lacks proof‐reading activity, resulting in a high mutational rate of 10–5–10–4 nucleotides per replication cycle (Duffy, Shackelton, & Holmes, 2008), thus producing a heterogenic quasi‐species population within infected individuals. Estimates for individual nucleotides produced a substitution rate of between 1.40 and 1.72 × 10⁻³ ssy (Takahashi et al., 2004), which is 10 times higher than that of HAV. Hepacivirus species have now also been isolated from dogs, horses, and other mammals, which poses the possibility that HCV originated from a nonprimate host. In particular, a virus replicating in the equine host might have either made a natural host jump or it may have been aided by medical practices with horse‐derived products (Hartlage et al., 2016).
There are currently 8 recognized genotypes within HEV (Smith et al., 2016), of which genotypes 1 and 2 are exclusively found in humans, while genotypes 3 and 4 are shared between humans and other mammalian hosts, in particular pig/wild boar and rabbits. Genotypes that have not been described in humans but are isolated from other mammals (e.g., camels) are not considered here. The substitution rate of HEV was estimated between 3 and 5 × 10⁻³ ssy with differences observed between genotypes (Brayne, Dearlove, Lester, Kosakovsky Pond, & Frost, 2017).
Here, we compare the genotype groupings of all three viral species utilizing several thousand genome sequences downloaded from public databases. The phylogenetic analysis was restricted to human isolates, except for HEV for which pig/wild boar and rabbit isolates were included. Their codon usage and amino acid frequencies were compared, and viral genomes of other species were then included to provide insights toward the possible evolutionary origin of HAV.
2. METHODS
2.1. Hepatitis virus datasets
In March 2019, over 5,000 viral genomes of HAV, HCV, and HEV were downloaded from Genbank to assess their inter‐ and intraspecies relationships. The size of downloaded sequences was restricted to 7,000–7,900 bp for HAV, 9,000–9,990 bp for HCV, and 7,000–7,800 bp for HEV. Animal isolates were excluded, except for swine/wild boar/rabbit HEV isolates. Sequences with ambiguous nucleotide stretches >2 were removed. Finally, redundancy was removed. A provisional phylogenetic tree was constructed (see below), and exceptionally long branches were checked in detail; these were without exception isolates of animal origin, which were subsequently removed. The final datasets contained 134 HAV genomes, 2,542 HCV genomes, and 557 HEV genomes.
2.2. Phylogenetic analysis
The genomes were aligned by MAFFT (Yamada, Tomii, & Katoh, 2016), and FastTree was used to build phylogenetic maximum‐likelihood (ML) trees (Price, Dehal, & Arkin, 2009). This infers approximately maximum‐likelihood phylogenetic trees and is much faster than other algorithms; we used the generalized time‐reversible (GTR) model of nucleotide evolution and the Shimodaira‐Hasegawa test for statistical confidence of internal nodes. Information on genotypes and subtypes that were included in GenBank annotations was used to map these on the trees. For visual representation, the HCV and HEV trees are shown after collapsing branches at 90% identity.
2.3. Codon usage analysis
Codon usage tables were also calculated for representative genomes for each genotype per species, as there were only minor differences between genotypes within a species, using the Codon Usage Calculator (https://www.biologicscorp.com/tools/CodonUsageCalculator) and averaged results were plotted in net plots with Excel. The codons of overlapping coding regions in HepE were first removed for this analysis, and their effect was assessed by a separate analysis where they were added in both frames, which did not affect the overall results. For these analyses, the open reading frames were extracted from the following genomes: For 6 genomes of HAV: AB623053.1 (genotype IA), M14707.1 (IB), AY644676.1 (IIA), AY644670.1 (IIB), FJ360731.1 (IIIA), and AB300205.1 (IIIB); for 6 genomes of HCV: EU781811.1 (1a), KF676352.1 (2a), KY620493.1 (3a), DQ418788.1 (4a), KJ925147.1 (5a), and DQ480522.1 (6a); for 9 genomes of HEV: LC225387.1/human (1a), MH809516.1/human (2a), KX462160.1/human, MF444099.1/human, EU375463.1/swine, MH184584.1/swine, JX565469.1/rabbit (all 3a), HQ634346.1/human, and DQ279091.1/swine (both 4a). Other virus species included for comparison are listed in Table 1. In the table and throughout the text, Uracil (present in RNA) is written as Thymine (T) as this is the nucleotide used in genome data. If all four nucleotides are evenly distributed, 25% would be expected for each. Overrepresented nucleotides (more then 30%) are shaded green, and underrepresented nucleotides (less than 20%) are shaded gray in the table.
Table 1.
Virus species included for comparison of codon usage and amino acid frequencies
| Virus name | Accession nr. | Taxonomy | Host | %A* | %C* | %T* | %G* |
|---|---|---|---|---|---|---|---|
| Hepatitis A virus (HAV) | average of 6 genotypes |
Picornaviridae Hepatovirus |
Homo sapiens | 30.0 | 15.7 | 32.5 | 21.8 |
| Hepatitis C virus (HCV) | average of 6 genotypes |
Flaviviridae Hepacivirus |
Homo sapiens | 20.9 | 29.2 | 22.1 | 27.7 |
| Hepatitis E virus (HEV) | average of 9 genotypes |
Hepeviridae Orthohepevirus |
Homo sapiens, Sus scrofa, other mammals | 18.0 | 30.0 | 25.7 | 26.3 |
| Simian hepatitis A virus (gt V) | EU140838.1 |
Picornaviridae Hepatovirus |
Macaca mulatta (rhesus monkey) | 29.5 | 15.7 | 32.8 | 22.0 |
| Rodent Hepatovirus | KT452637.1 |
Picornaviridae Hepatovirus |
Microtus arvalis (common vole) | 31.4 | 14.3 | 33.9 | 20.4 |
| Rodent Hepatovirus | KT452644.1 |
Picornaviridae Hepatovirus |
Cricetulus migratorius (gray dwarf hamster) | 30.9 | 14.5 | 34.3 | 20.3 |
| Bat Hepatovirus | KT452714.1 |
Picornaviridae Hepatovirus |
Eidolon helvum (fruit bat) |
32.7 | 15.4 | 31.5 | 20.4 |
| Bat Hepatovirus | KT452730.1 |
Picornaviridae Hepatovirus |
Coleura afra (African sheath‐tailed bat) |
31.5 | 16.1 | 31.3 | 21.1 |
| Human Rhinovirus C | NC_009996.1 |
Picornaviridae Enterovirus |
Homo sapiens | 31.8 | 21.7 | 26.2 | 20.3 |
| Human Cosavirus B1 | NC_012801.1 |
Picornaviridae Cosavirus |
Homo sapiens | 28.9 | 22.8 | 28.0 | 20.3 |
| Human Coronavirus | NC_002645.1 |
Coronavirinae Alphacoronavirus |
Homo sapiens | 27.1 | 16.7 | 34.6 | 21.6 |
| Human pegivirus A (HPgV) | NC_001837.1 | Flaviviridae Pegivirus | Homo sapiens | 18.0 | 26.9 | 23.2 | 31.9 |
| West Nile virus (WNV) | NC_001563.2 |
Flaviviridae Flavivirus |
Homo sapiens (mosquito vector) | 27.3 | 22.7 | 21.7 | 28.3 |
| Zika virus | NC_012532.1 |
Flaviviridae Flavivirus |
Sentinel monkey (humans via mosquito vector) | 27.8 | 21.6 | 21.5 | 29.1 |
| Norwalk virus (norovirus) | NC_001959.2 |
Caliciviridae Norovirus |
Homo sapiens | 29.3 | 23.0 | 22.2 | 25.5 |
| Triatoma virus | AF178440.1 |
Dicistroviridae Triatovirus |
Triatoma infestans (kissing bug) |
29.0 | 16.3 | 35.0 | 19.7 |
| Cricket paralysis virus (CrAV) | AF218039.1 |
Dicistroviridae Cripavirus |
Teleogryllus spp. (Australian crickets) | 33.1 | 18.3 | 27.6 | 21.0 |
| Israeli acute paralysis virus (IAPV) | NC_009025.1 |
Dicistroviridae Aparavirus |
Apidae sp. (bees) |
32.7 | 17.0 | 29.4 | 20.7 |
| Varroa destructor virus | NC_006494.1 |
Iflaviridae Iflavirus |
Varroa destructor (parasitic bee mite) | 29.0 | 16.3 | 31.5 | 23.2 |
| Acinetobacter phage AP205 | NC_002700.2 |
Leviviridae Levivirus |
Acinetobacter sp. | 26.5 | 22.5 | 29.5 | 21.5 |
| Enterobacter phage MS2 | NC_001417.2 |
Leviviridae Levivirus |
Enterobacter sp. | 27.7 | 25.8 | 21.5 | 25.0 |
Of coding region only. Overrepresented nucleotides (>30%) are shown in green, and underrepresented nucleotides (<20%) are shown in gray.
For comparisons of amino acid composition between polypeptides, the polypeptides and complete open reading frames of the virus species listed above were compared and the analysis was extended to virus species of other families as listed in Table 1.
The effective number of codons (ENC) was calculated using DAMBE (Xia, 2013).
3. RESULTS AND DISCUSSION
The three viral species HAV, HCV, and HEV are not phylogenetically related. Separate phylogenetic trees were produced for the three viral species, with 134 HAV genomes, 2,542 HCV genomes, and 557 HEV genomes, as shown in Figure 1. All trees were drawn to scale, to illustrate the much lower genomic diversity of HAV compared with the other two species. The trees for HCV and HEV were collapsed at 90% identity for graphical representation. The HAV branches remained un‐collapsed, since the shown branches per genotype all have a similarity >90%. The genomic diversity of HEV is higher than that of HAV but lower than that of HCV, as illustrated by the branch lengths of the trees. The produced HAV tree is in good agreement with previously published data (Vaughan et al., 2014), although we did not include simian serotypes IV to VI. Our HCV tree that was based on 2,542 genomes is also mostly in agreement with previous publications that used smaller datasets. A neighbor joining (NJ) tree based on 162 genome sequences (Jackowiak et al., 2014) already identified a relationship between genotype 1 (Gt1) and Gt4, which is also visible in Figure 1; these two genotypes have evolved later than the other genotypes (Preciado et al., 2014). The relationship between Gt2 and Gt7 was also noted before. However, our data produced a better resolution of genotypes than the NJ tree published by Jackowiak and colleagues. An ML tree based on 129 genome sequences (Smith et al., 2014) also did not fully resolve the branch of Gt1 and Gt4 with respect to the other genotypes. It is unclear on what data the tree shown in a review article (Preciado et al., 2014) was based, in which Gt1 and Gt4 were separated. In our tree, the branch leading to Gt1 and Gt4 is placed between Gt3 and Gt6/Gt8. Upon closer investigation of HCV genomes for which a subtype was specified in their Genbank annotation, only a few annotations did not match the current nomenclature, all of which were given a genotype before standardization of the nomenclature (Tokita et al., 1996). This illustrates that historical Genbank annotations must be interpreted with caution. The six genotypes of HEV are also well resolved in Figure 1, but the subtypes within these genotypes are not. Notably, one collapsed branch contained members of subtypes 1a, 1b, 1c, 1d, and 1f, whose close distances have been noted before (Smith et al., 2016). On the other hand, the genetic diversity within Gt3 is extensive, even if rabbit isolates are ignored (Figure 1). Based on their overall genomic similarity, members of Gt3 could be considered to belong to multiple genotypes that could be newly defined. This was observed by Smith and colleagues as well, but they decided to keep the nomenclature of genotypes 1–4 as proposed by Lu, Li, and Hagedorn (2006), since this was already well established. As a result, there is no consistent degree of similarity within the different genotypes and their subtypes for HEV, in contrast to the more transparent nomenclature of HCV.
Figure 1.
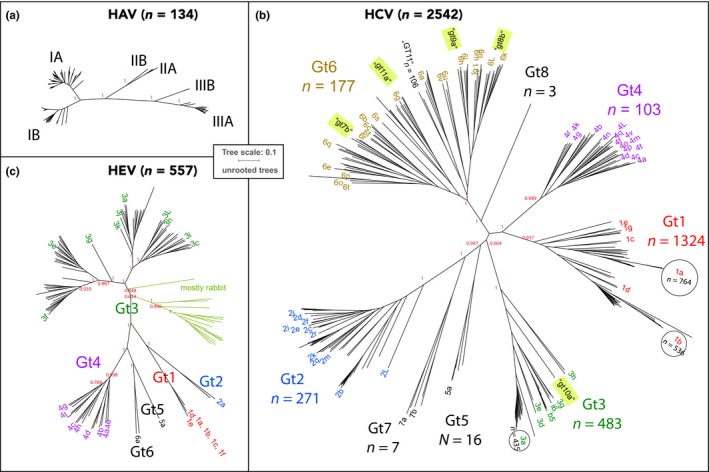
Phylogenetic trees of HAV, HCV, and HEV genomes. All ML trees are unrooted and shown at the same scale. The trees are based on 134 HAV genomes (a), 2,542 HCV genomes (b), and 557 HEV genomes (c). The trees of (b) and (c) are shown after collapsing branches at 90% identity. The number of branch members >100 is indicated in circles in the HCV tree. Only human isolates are shown, with the exception of HEV which also contains rabbit and pig/wild boar isolates. Bootstrap values are indicated for nodes connecting the various genotypes
The codon usage of the three viral species was next analyzed. Typically, codon usage is expressed as relative synonymous codon usage (RSCU), which calculates the over‐ or underabundance of specific codons relative to their expected frequencies based on the nucleotide composition of an open reading frame (ORF). For instance, codon use of HEV was analyzed by RCSU (Hu et al., 2011). Appendix Figure A1 compares the RSCU values of the three viral species, plotted in a wheel plot. This identified differences in codon usage between HAV on the one hand and HCV/HEV on the other hand. The codon usage of HAV is suboptimal for replication in the human host, while the codon usage of HCV is highly adapted to that of human cells, as has been described before (Pintó, Aragonès, Costafreda, Ribes, & Bosch, 2007). RCSU values are an excellent means to compare codon usage of individual genes within a given (prokaryotic) genome, as cells typically control gene expression by minor codon preferences (Sharp & Li, 1986). However, when comparing virus proteomes with large differences in codon usage, we consider it useful to look at this usage without correcting for nucleotide composition differences, as a dependence exists between nucleotide composition and codon usage preferences. Thus, we calculated codon usage as the fraction of used codons per given amino acid. Without a correction for nucleotide composition, the differences between HAV and HCV/HEV is amplified, and now the values can be compared with the overall codon usage of human cells (Figure 2). As can be seen, two trends describe the deoptimized codon use of HAV: (a) the virus strongly prefers codons with T over C at the third (wobble) position, while for human cells it is the other way round; this is clearly visible for Cys, Asp, Phe, Asn, and Tyr (Figure 2c). These are all amino acids for which only two codons are available, but the same third‐base preference for T can also be seen for Ala and Pro; (b) A weaker preference for codons having A at the third position is visible for Lys, Gly, and Arg. The deoptimized codon usage is still evident when only those amino acids are considered that occur at a high frequency (>4.5%) in the polypeptide of HAV (Figure 2d). That HAV strongly prefers T at the third position may be partly responsible for its high T‐content (32.8% on average, Table 1), but this is not a general rule. For instance, rabies virus (a negative strand ssRNA virus) prefers codons ending in G while its genome contains only 22.7% G (Zhang et al., 2018).
Figure 2.
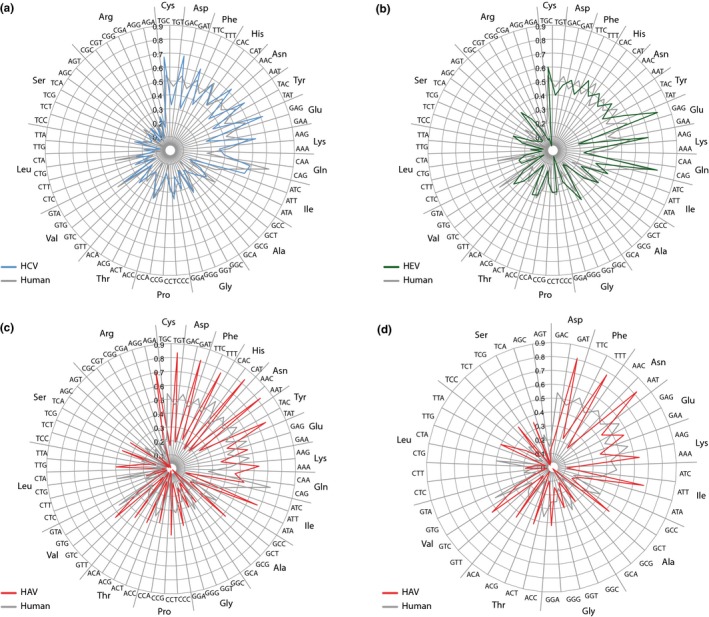
Codon usage wheel plots of HCV, HEV, and HAV, compared with human codon usage. The viral codon usage shown is a calculated average of (a) 6 HCV genomes representing genotypes 1a, 2a, 3a, 4a, 5a and 6a', (b) 9 HEV genomes of genotypes 1‐4 of human, swine and rabit origines, and (c) 6 HAV genomes of genotypes IA, IB, IIA, IIB, IIIA and IIIB. Panel (d) shows the HAV codon usage for those amino acids used at frequencies >45% only. The codons are sorted for amino acids, with, from top clockwise, amino acids with 2, 3, 4, and 6 codons. Nonvariable amino acids are excluded
Various explanations have been proposed for the observed codon usage of HAV. Vaughan and coworkers proposed that it slows down translation of proteins, resulting in better competition for loaded tRNAs during translation of virus proteins against that of host proteins (Vaughan et al., 2014). However, most variation is in the third‐base wobble, in which case there would be little selection for less commonly used tRNAs and amino‐acyltransferases. Nevertheless, nonpreferred third bases can slow down the translation machinery, which presumably allows better protein folding of the capsid protein (Pintó et al., 2018). Costafreda and coworkers have shown that selection for deoptimized HAV codons was related to transcription efficiency, antigenicity of capsid protein, plaque size, and survival rates of virions (Costafreda et al., 2014). However, it is hard to envisage how this situation might have evolved when an ancestor of HAV had a codon usage that was better adapted to the mammalian host. In general, the direction of virus evolution would be toward more efficient, not toward less efficient translation and replication in a given host, as it would result in more (or more rapid) virion production. Moreover, if the selective pressure would mostly apply to optimal folding of the capsid protein, only that coding region of the genome would depend on using deoptimized codons, but the virus proteome is consistently using codons that human cells do not prefer, over its complete ORF length This is shown in Appendix Figure A2. We consider the most likely explanation for the current codon usage of HAV that it is a remnant of an ancestor virus that replicated in a host with a codon usage preference different to that of humans.
The most likely direct ancestor of HAV was a virus replicating in rodents, although simian HAV is more closely related to human HAV than rodent hepatoviruses are (Dexler et al., 2015). The codon usage in simian HAV (genotype V) strongly resembles that of human HAV, as do rodent hepatoviral species (Appendix Figure A3 panel a). Since Dexler and colleagues had proposed that rodent HAV species may have originated from an ancestor replicating in bats, we further assessed the codon usage of hepatovirus from bat species. Two of the currently 7 available genome sequences of bat hepatovirus were selected, one from a fruit‐eating bat and one from an insectivore species (Table 1). The latter (African sheath‐tailed bat) is widespread in Africa and prefers a diet of beetles and lepidopterans (McWilliam, 1987). Both investigated bat hepatovirus species had a codon usage extremely similar to that of the other analyzed hepatovirus species (Figure A3 panel a). Thus, possibly the selection mechanism proposed for HAV that resulted in de‐optimized codon use for its human host also applies to these other hepatoviruses that replicate in other mammalian hosts.
Alternatively, a possible ancestor with a codon usage that was adapted to an alternative host must be sought in a more distant evolutionary history. If such an ancestor virus once existed, it more likely replicated in a host with a GC content much lower than that of mammals, as the overall codon usage of mammalian cells does not vary much between species. Instead, codon usage in mammals is primarily governed by within‐genome variation in GC content, and only weakly, if at all, correlates to gene expression and tRNA content (Galtier et al., 2018).
We first assessed the possibility that a putative ancestor of HAV and other hepatoviruses was a virus propagating in bacteria that had a GC content in the range of the HAV genome. If a putative bacteriophage was the ancestor of HAV and other hepatoviral species, a host and kingdom jump would most likely have taken place in the gut. Therefore, to test this hypothesis, we compared the codon usage of three species of bacteria that are abundant in a mammalian gut and have a GC content around 37% (the current base G + C composition of HAV), for which we chose Acinetobacter baumannii, a member of the Gram‐negative class Gammaproteobacteria (Whitman et al., 2018); Enterococcus faecium, a Gram‐positive Firmicute in the class Baccilli; and Prevotella oralis, a Gram‐negative member of the class Bacteroidia. In Appendix Figure A4, it is shown that the best match in codon use between HAV and these bacterial species was found for E. faecalis.
Bacteriophages with an ssRNA (+) genome have been described, for instance bacteriophage MS2, which infects Escherichia coli and other members of Enterobacteriaceae. It is an icosahedral virus, just like HAV is. Another example is phage AP205 that propagates in Acinetobacter species (Klovins, Overbeek, Worm, Ackermann, & Duin, 2002). Single‐strand RNA bacteriophages are typically members of the Leviviridae family (Olsthoorn & van Duin, 2011) that bear no sequence resemblance to HAV. So far, a bacteriophage with structural or sequence similarity to HAV has not been described, but it should be noted that RNA phages have not been extensively studied or described, and this type of bacteriophages suffers from underreporting (Callanan et al., 2018).
Another possibility of an ancestral virus for HAV was assessed based on the reported structural similarity between HAV and insect viruses that are members of Dicistroviridae (also Picornavirales; Wang et al., 2015). In particular, Wang and colleagues observed structural similarity between HAV and triatoma virus that replicates in triatomines (kissing bugs, Czibener, Torre, Muscio, Ugalde, & Scodeller, 2000) and with cricket paralysis virus (CrPV) that propagates in cricket species endemic to Australia (Wilson, Powell, Hoover, & Sarnow, 2000). When we compared codon usage of HAV to that of these two viral species, a striking similarity was observed. In particular, the codon use of triatoma virus is highly similar to that of HAV (Figure 3) and that similarity is higher than that of HAV to CrPV or to the tested potential bacterial hosts. Figure 3c further demonstrates that the codon usage of triatoma virus is well adapted to its natural insect host, Triatoma infestans.
Figure 3.
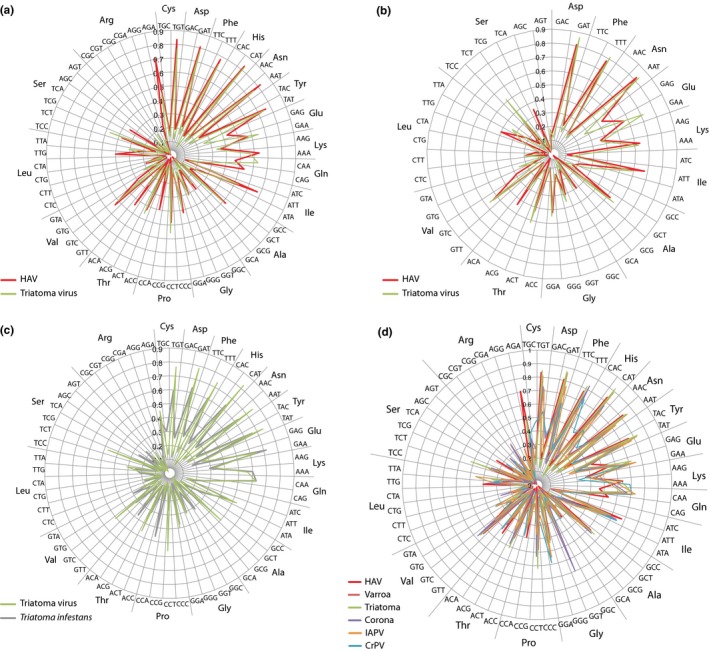
Codon usage plots of HAV compared with other viruses. The codon usage of HAV is compared with that of triatoma virus (a, b) for all variable codons (a) and for those amino acids with a frequency >4.5% in the HAV proteome (b). The codon usage of triatoma virus and its natural host are compared in panel (c). In panel (d), the comparison is extended to other virus species sharing codon usage with HAV. IAPV: Israeli acute paralysis virus. CrPV: Cricket paralysis virus. For more information on these other virus species see Table 1
We next tested if the similarity in codon usage is restricted to HAV, its direct cousins, possible ancestors, and the two insect virus species. That was not the case, as another Dicistroviridae member, Israel acute paralysis virus, showed the same pattern. Even an insect virus not belonging to Dicistroviridae, varroa destructor virus (Iflaviridae, replicating in the varroa mite that is parasitic to bees) produced a very similar codon usage plot (Figure 3d). We then extended the comparison to other ss(+)RNA virus families and identified an equally strong similarity to human coronavirus, a Nidovirales member. Coronaviruses are not known to replicate in insects, but it has been proposed that they might have an insect virus as their ancestor (Nga et al., 2011; Zirkel et al., 2011).
This is not to say that HCV and HEV are exceptional with respect to their codon usage. Other Picornaviridae members such as human cosavirus or rhinovirus have codon preferences that more resemble HCV and HEV than HAV (Appendix Figure A3 panel b), although between these species slightly more variation is observed for single codons than we observe for HAV and the virus species shown in Figure 3d. These two Picornaviridae illustrate that the observed distinction in codon usage does not follow taxonomic divisions, as they do not group with HAV and other Picornavirales. Norovirus (a Caliciviridae member) also matches the HCV/HEV codon usage pattern. Human pegivirus (HPgV), which is also known by the alternative names hepatitis G virus or GB virus C, is also included in this comparison. The virus rarely infects hepatocytes and its role in human disease is still being discussed (Marano et al., 2017). Its codon usage also resembles that of HCV and HEV, although it is a member of the Flavivridae (Table 1). Zika virus and West Nile virus (also Flaviviridae) are transmitted by mosquitoes; however, they do not have an insect‐like signature as their codon usage is also similar to that of HCV and HEV (Figure A3).
The effective number of codons (ENC) was also calculated, using the method by Xia (Xia, 2013) which is an improved version of the original method by Wright (Wright, 1990). A theoretical proteome under maximal codon bias that would only use a single codon for each of the 20 amino acids would result in an EcN score of 20, while a proteome using all 61 possible codons free of any bias would score 61. The values obtained are shown in Appendix Table A1; HAV had a score of 46.9, HEV scored 51.9, and HCV scored 54.0. The insect virus species varied from 45.0 (triatoma virus) to 52.6 (cricket paralysis virus). The highest score was reported for norovirus (58.3) and the lowest for rodent hepatovirus (43.1). These results support the view that a codon bias exists for HAV, but it seems an even stronger bias exists for rodent hepatovirus and for triatomavirus, although codon usage of the latter is well adapted to its host.
Since codon preference is related to nucleotide composition, this parameter was next compared for all coding regions of the virus species included in the comparison. Nucleotide composition is normally expressed as %GC, but for single‐strand genomes, the contribution of individual bases was also assessed (Figure 4). Either analysis clearly divided the various virus species into two groups, with HAV, the insect viruses and coronavirus, rhinovirus, and cosavirus being more AT rich and relatively low in C (panel 4A), while Zikavirus, WNV, norovirus, and HPgV grouped with HCV and HEV and were all rich in G and C (panel 4B). Simian, rodent, and bat hepatovirus were very similar to HAV. These were not included in panel 4A for clarity, but their similarity in base composition can be seen in Table 1. In terms of %GC versus %AT, rhinovirus and cosavirus were closer to HAV than they were to HCV/HEV (panel 4C) although in terms of their codon usage preference, they clearly did not belong to the HAV group. This shows that the codon usage findings only partly correlate with nucleotide composition.
Figure 4.
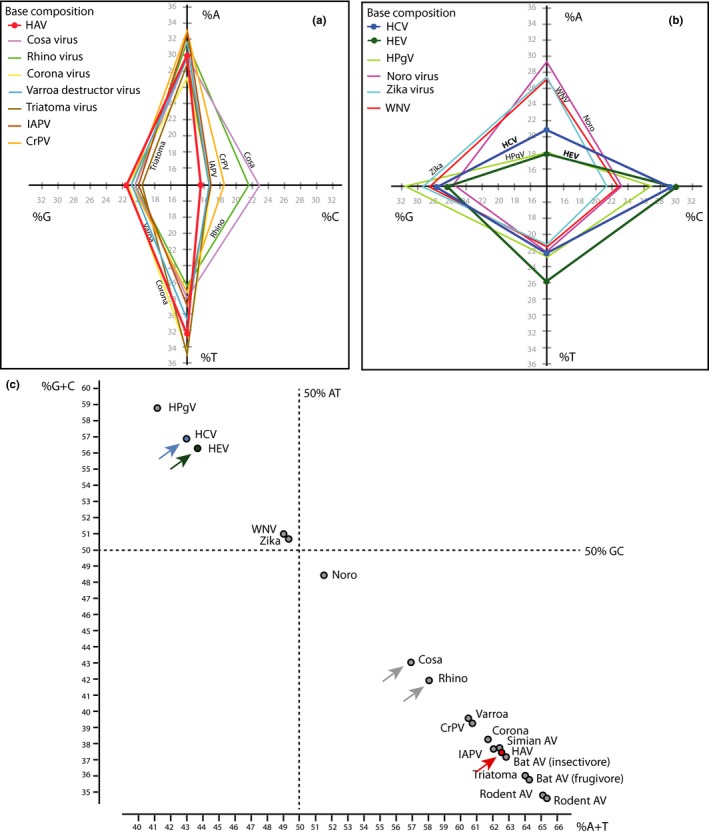
Base composition of the various virus species. Individual base frequency is compared for AT‐rich genomes (protein‐coding regions only) of the HAV group (panel a) and of GC‐rich genomes of the HCV/HEV group (panel b). The % GC content of the genomes is compared in panel (c). This placed cosavirus and rhinovirus closer to the HAV group than to the HCV/HEV group (gray arrows). HAV is shown in red, HCV in blue and HEV in green, with colored arrows for clarity
We next assessed if preference for a certain base at a certain position in the codon correlated with nucleotide composition. For this, the frequency at which a base was found at the first, second, and third position was plotted against the percentage of that base in the complete proteome‐coding region of the genome, for each of the analyzed virus species (Figure 5). Any deviation from the x = y axis identifies an under‐ or overabundance of that nucleotide at that position. A consistent overrepresentation of G at the fisrt position was observed in all analyzed virus species. An underrepresentation of G at the second, and of T at the first position was also consistently observed. The striking preference of HAV for T at the third position is clearly visible, as is the avoidance of C at that same position. That HAV also has a notable preference for C at the second position had not been apparent from the wheel plot of Figure 2. In none of these analyses did HAV behave differently from some or all of the other analyzed genomes.
Figure 5.
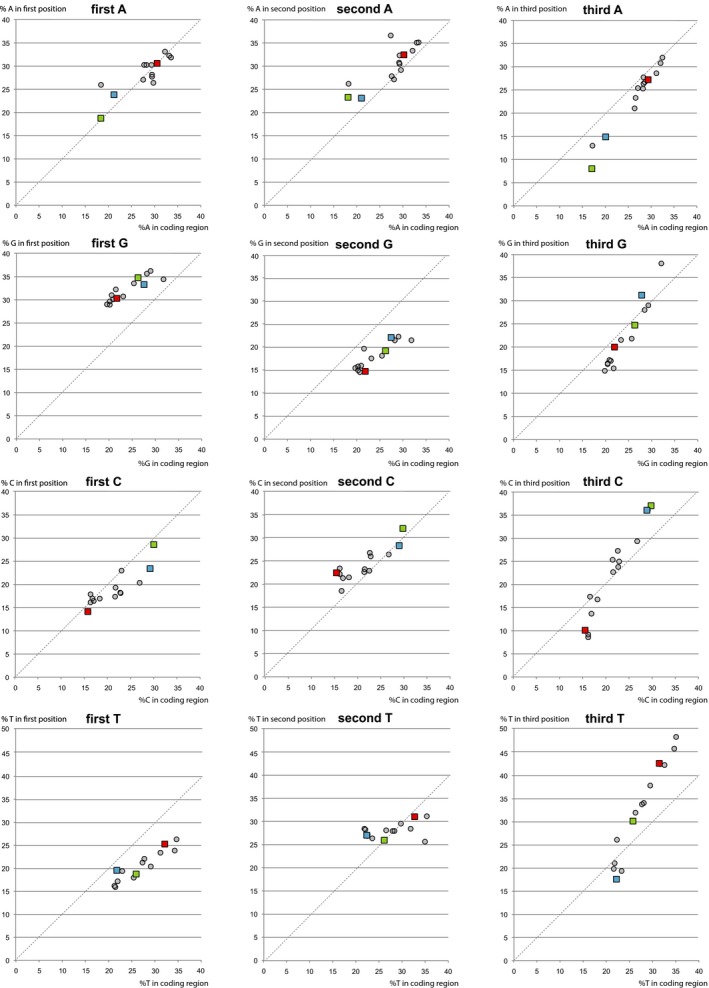
Correlation between base position in codons and the total base composition. The frequency of a base found at first (left), second (middle), or third (right) position is plotted against the frequency of that base in the complete coding sequence of each virus species. HAV is shown as red, HCV as blue and HEV as green squares. The other virus species are shown as gray dots. Points above the X = Y line (dotted) represent overrepreseentation of that base for that position
Finally, because of lack of sequence similarity between the various virus species, the amino acid composition of their proteomes was compared, as this is even less dependent of nucleotide composition than codon usage preference is. Again, this comparison segregated the analyzed virus proteomes into two groups, one containing virus species with an amino acid frequency more HAV‐like and the other group more resembling HCV and HEV (Figure 6). The insect virus proteomes of triatoma virus, IAPV, CrPV, and varroa destructor virus have amino acid frequencies similar to that of HAV. In addition, cosavirus, norovirus and rhinovirus have amino acid frequencies resembling HAV, while their codon usage is more similar to that of HCV/HEV and their nucleotide composition is less rich in A and T. Zikavirus, HPgV, and WNV more resembled HCV and HEV in terms of amino acid composition (Figure 6 panel b).
Figure 6.
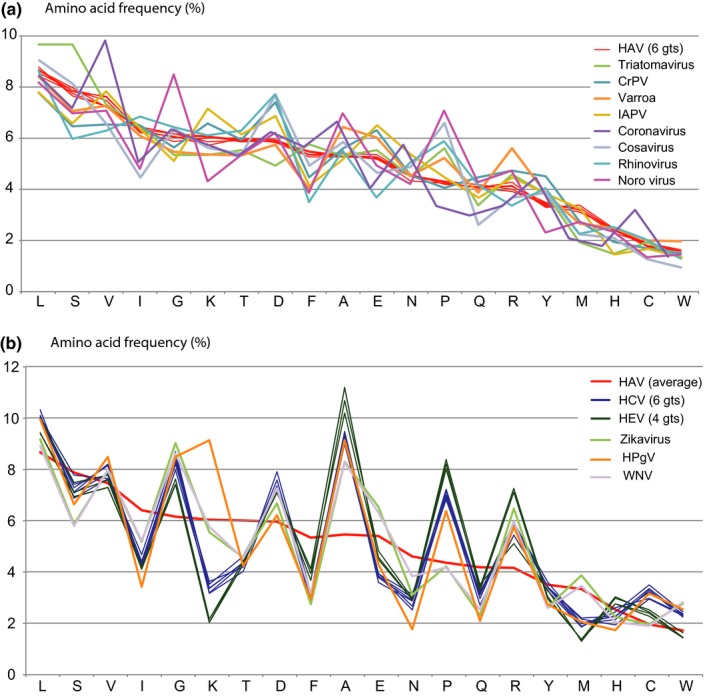
Amino acid frequency in the proteomes of the various virus species. The frequency of amino acids in the proteome of 6 HAV genotypes is similar to that of 8 other virus species (a) while three other virus proteomes more resemble the average of HCV and HEV (b). In both panels, the amino acids are ordered for decreasing frequency in HAV. The average amino acid frequency of HAV is added to panel (b) for comparison
In summary, HAV shares a high AT‐content in its coding regions with positive ssRNA invertebrate virus species (triatoma virus, CrPV, IAPV, and varroa destructor virus) and with coronavirus, as shown in Figure 4. These virus species also display a conserved codon preference (Figure 3d) and share a similarity in amino acid frequency for their total proteome (Figure 6a). HCV and HEV form a separate group together with Zika virus, HPgV, and WNV in terms of their amino acid frequencies (Figure 6b). The proteome constituents of rhinovirus, cosavirus, and Zika virus are more like HAV than HEV/HCV (Figure 6a), while their codon usage resembles that of HEV/HCV (Figure A3 panel b). These findings indicate that codon usage preference can vary between viruses with similar amino acid frequency, and these parameters are not completely dictated by nucleotide composition.
In all analyses presented here, HCV and HEV group together, although these virus species do not share sequence similarity and are not classified in the same taxonomic families (Table 1). A structural similarity between HEV and Caliciviridae (to which norovirus belongs) has been noted before (Bradley, 1990), but it is apparent that HCV also bears resemblance to Flaviviridae, as not only exemplified by HCV but also by the other Flaviviridae included here (HPgV, Zika virus and WNV).
A full explanation for the observations regarding HAV cannot be given, but it opens the intriguing possibility that HAV, its close relatives simian, rodent, and bat hepatovirus, and the insect virus species analyzed here are somehow related, and might even have shared a common ancestor. That ancestor might have been an insect virus that underwent a host jump to bats, after it was passed on to rodents and eventually simians and humans. The jump from insect to bat may have occurred in the blood (in case a blood‐sucking insect was the source) or in the gut of insectivorous bats. A candidate for this putative common ancestor has not been identified, as no invertebrate virus is yet described with sequence similarity to HAV, but its existence can be hypothesized. In contrast, HEV and HCV seem to have a common ancestor not related to that of HAV and form a different group of (human) ssRNA(+) virus species that includes Zika virus, HPgV, and WNV, while a striking resemblance between HEV and HCV for all analyzed parameters is observed. An alternative explanation for the observed similarities is that the various virus species found to share the identified features with virus species of different taxonomic families have undergone parallel evolution that drove these species toward identical amino acid frequencies and conserved codon use, even if (as in the case of human vs. insect viruses) their hosts have alternative codon preferences. We consider that second possibility less likely.
4. CONCLUSIONS
Although no sequence similarity is detected between the various virus species compared here, in combination the presented data make it plausible that an ancestor virus of HAV and other hepatoviral species was an insect virus, with a codon use adapted to that host, whose signature is still visible in current HAV genome. We consider it possible that a blood‐sucking insect such as triatomes, which feeds on mammals, may have been the source for a virus crossing host species. Alternatively, a host jump may have taken place in the gut of insectivorous bats. More speculative is the possibility that in a long evolutionary past all these virus species may have originated from bacteriophages that propagated in Gram‐negative AT‐rich bacteria, with which they still share codon preference and amino acid frequency.
CONFLICT OF INTEREST
None declared.
AUTHOR CONTRIBUTIONS
TMW designed the study, produced Figures 2, 3, 4, 5, 6, wrote the first draft of the manuscript, and interpreted the data; S‐RJ produced and curated the required datasets and produced Figure 1; MR advised on software tools for all figures, interpreted the data, and edited the manuscript; DWU ensured funding, advised on all figures, interpreted the data, and edited the manuscript.
ETHICS STATEMENT
None required.
ACKNOWLEDGMENT
This research was supported by NIH/NIGMS grant 1P20GM121293 and from the Helen Adams & Arkansas Research Alliance Endowment in the Department of Biomedical Informatics, College of Medicine at UAMS.
APPENDIX 1.
Table A1.
Effective number of codons in the proteomes of the virus species analyzed
| Virus name | ENC‐observed | ENC‐expected | obs/exp |
|---|---|---|---|
| Hepatitis A Virus (HAV) | 46.9 | 52.3 | 0.897 |
| Hepatitis C Virus (HCV) | 54.0 | 55.0 | 0.982 |
| Hepatitis E Virus (HEV) | 51.9 | 55.3 | 0.937 |
| Simian Hepatitis A virus | 46.7 | 52.0 | 0.899 |
| Rodent hepatovirus (vole) | 43.1 | 47.8 | 0.901 |
| Bat hepatovirus (insectivore) | 49.3 | 54.8 | 0.900 |
| Human Rhinovirus C | 56.1 | 60.0 | 0.935 |
| Human Cosavirus B1 | 55.4 | 60.1 | 0.921 |
| Human Coronavirus | 47.0 | 51.6 | 0.911 |
| Human pegivirus A | 54.5 | 56.2 | 0.969 |
| West Nile virus | 57.0 | 62.3 | 0.915 |
| Zika virus | 56.6 | 62.2 | 0.910 |
| Norwalk virus (norovirus) | 58.3 | 62.3 | 0.937 |
| Triatoma virus | 45.0 | 48.0 | 0.937 |
| Cricket paralysis virus | 52.6 | 57.4 | 0.917 |
| Israeli acute paralysis virus | 51.5 | 55.1 | 0.934 |
| Varroa destructor virus | 50.6 | 52.0 | 0.972 |
All values were calculated with DAMBE (Xia, 2013)
Figure A1.
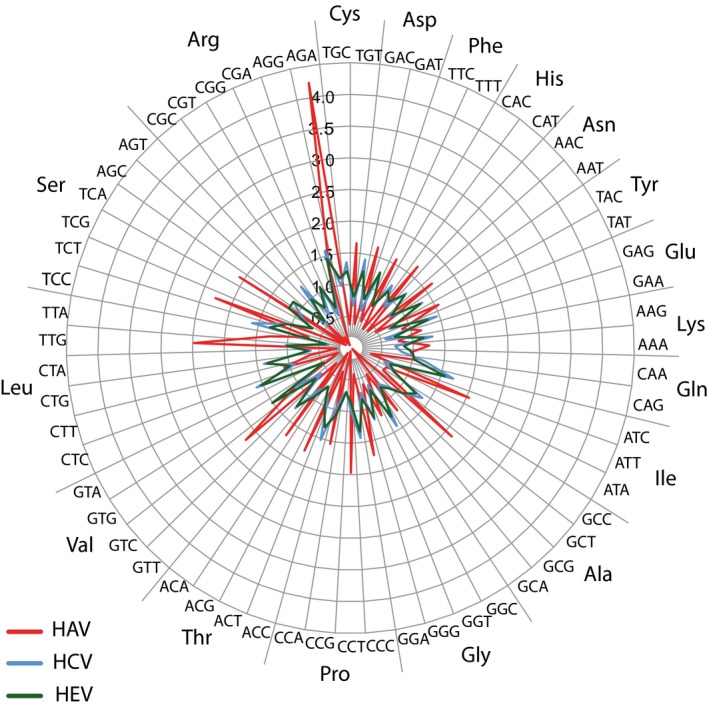
Comparison of relative synonymous codon usage (RSCU) of HAV, HCV, and HEV. These values represent the over or underabundance of a given codon, with reference to the expected frequency based on nucleotide composition. The results are based on the average values of 6 HCV genomes of genotypes 1a, 2a, 3a, 4a, 5a, and 6a, respectively, 9 HEV genomes of genotypes 1–4 of human, swine and rabbit origines, and 6 HAV genomes of genotypes IA, IB, IIA, IIB, IIIA, and IIIB. The codons are sorted for amino acids, with, from top clockwise, amino acids coded by 2, 3, 4, and 6 codons. Nonvariable amino acids are excluded
Figure A2.

Frequency of strongly preferred HAV codons that are avoided in human cells, scored over a window of 10 amino acids along the HAV polypeptide. The position of mature structural (capsid) proteins in black and of non‐structural proteins in gray is shown below the graph for reference
Figure A3.
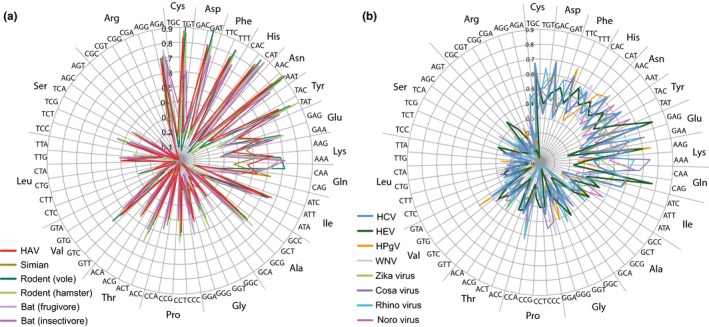
Codon usage plots of HEV and HAV compared with other viruses. The codon usage of HAV (a) is compared with simian hepatovirus, two rodent hepatovirus species, and two bat species. The codon usage of HCV and HEV (b) is compared with that of other human ssRNA(+) virus species, whose details are given in Table 1
Figure A4.
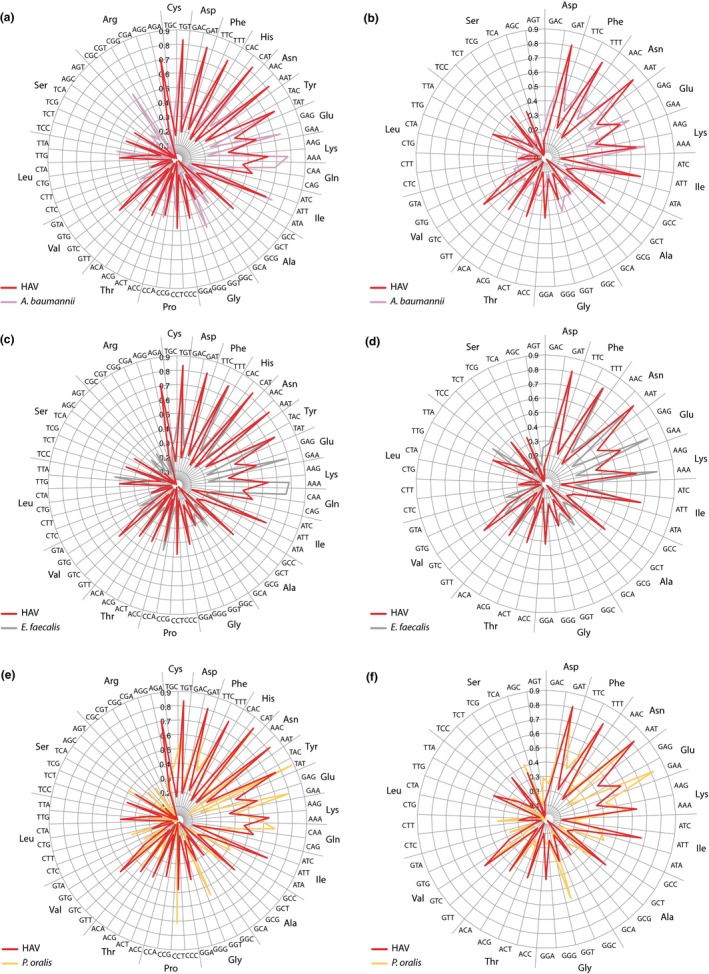
Codon usage plots of HAV compared with bacteria with a similar GC content. Shown are comparisons with the Proteobacterium Acinetobacter maumannii (a, b), the Firmicute Enterococcus faeclis (c, d), and the Bacteroidetes Prevotella oralis (c, d). Panels a, c, and e show all amino acids with variable codon use, while b, d, and f only show those amino acids with a frequency >4.5% in the HAV proteome
Wassenaar TM, Jun S‐R, Robeson M, Ussery DW. Comparative genomics of hepatitis A virus, hepatitis C virus, and hepatitis E virus provides insights into the evolutionary history of Hepatovirus species. MicrobiologyOpen. 2020;9:e973 10.1002/mbo3.973
DATA AVAILABILITY STATEMENT
All sequences used for comparisons are publicly available at GenBank. The data used for generation of the figures are available from the corresponding author upon request.
REFERENCES
- Ansaldi, F. , Orsi, A. , Sticchi, L. , Bruzzone, B. , & Icardi, G. (2014). Hepatitis C virus in the new era: Perspectives in epidemiology, prevention, diagnostics and predictors of response to therapy. World Journal of Gastroenterology, 20(29), 9633–9652. 10.3748/wjg.v20.i29.9633 [DOI] [PMC free article] [PubMed] [Google Scholar]
- Bradley, D. W. (1990). Enterically‐transmitted non‐A, non‐B hepatitis. British Medical Bulletin, 46(2), 442–461. 10.1093/oxfordjournals.bmb.a072409 [DOI] [PubMed] [Google Scholar]
- Brayne, A. B. , Dearlove, B. L. , Lester, J. S. , Kosakovsky Pond, S. L. , & Frost, S. D. W. (2017). Genotype‐specific evolution of hepatitis E virus. Journal of Virology, 91(9), e02241-16 10.1128/JVI.02241-16 [DOI] [PMC free article] [PubMed] [Google Scholar]
- Callanan, J. , Stockdale, S. R. , Shkoporov, A. , Draper, L. A. , Ross, R. P. , & Hill, C. (2018). RNA phage biology in a metagenomic era. Viruses, 10(7), 386. 10.3390/v10070386 [DOI] [PMC free article] [PubMed] [Google Scholar]
- Costafreda, M. I. , Pérez‐Rodriguez, F. J. , D'Andrea, L. , Guix, S. , Ribes, E. , Bosch, A. , & Pintó, R. M. (2014). Hepatitis A virus adaptation to cellular shutoff is driven by dynamic adjustments of codon usage and results in the selection of populations with altered capsids. Journal of Virology, 88(9), 5029–5041. 10.1128/JVI.00087-14 [DOI] [PMC free article] [PubMed] [Google Scholar]
- Costa‐Mattioli, M. , Ferré, V. , Casane, D. , Perez‐Bercoff, R. , Coste‐Burel, M. , Imbert‐Marcille, B. M. , … Cristina, J. (2003). Evidence of recombination in natural populations of hepatitis A virus. Virology, 311(1), 51–59. 10.1016/S0042-6822(03)00109-0 [DOI] [PubMed] [Google Scholar]
- Czibener, C. , La Torre, J. L. , Muscio, O. A. , Ugalde, R. A. , & Scodeller, E. A. (2000). Nucleotide sequence analysis of Triatoma virus shows that it is a member of a novel group of insect RNA viruses. Journal of General Virology, 81(Pt 4), 1149–1154. 10.1099/0022-1317-81-4-1149 [DOI] [PubMed] [Google Scholar]
- Dexler, J. F. , Corman, V. M. , Lukashev, A. N. , van den Brand, J. M. , Gmyl, A. P. , Brünink, S. , …Hepatovirus Ecology Consortium . (2015). Evolutionary origins of hepatitis A virus in small mammals. Proceedings of the National Academy of Sciences, 112(49), 15190–15195. 10.1073/pnas.1516992112 [DOI] [PMC free article] [PubMed] [Google Scholar]
- Duffy, S. , Shackelton, L. A. , & Holmes, E. C. (2008). Rates of evolutionary change in viruses: Patterns and determinants. Nature Reviews Genetics, 9(4), 267–276. 10.1038/nrg2323 [DOI] [PubMed] [Google Scholar]
- Galtier, N. , Roux, C. , Rousselle, M. , Romiguier, J. , Figuet, E. , Glémin, S. , … Duret, L. (2018). Codon usage bias in animals: Disentangling the effects of natural selection, effective population size, and gc‐biased gene conversion. Molecular Biology and Evolution, 35(5), 1092–1103. 10.1093/molbev/msy015 [DOI] [PubMed] [Google Scholar]
- Hartlage, A. S. , Cullen, J. M. , & Kapoor, A. (2016). The strange, expanding world of animal hepaciviruses. Annual Review of Virology, 3(1), 53–75. 10.1146/annurev-virology-100114-055104 [DOI] [PMC free article] [PubMed] [Google Scholar]
- Hu, J. S. , Wang, Q. Q. , Zhang, J. , Chen, H. T. , Xu, Z. W. , Zhu, L. , … Liu, Y. S. (2011). The characteristic of codon usage pattern and its evolution of hepatitis C virus. Infection, Genetics and Evolution, 11(8), 2098–2102. 10.1016/j.meegid.2011.08.025 [DOI] [PubMed] [Google Scholar]
- Jackowiak, P. , Kuls, K. , Budzko, L. , Mania, A. , Figlerowicz, M. , & Figlerowicz, M. (2014). Phylogeny and molecular evolution of the hepatitis C virus. Infection, Genetics and Evolution, 21, 67–82. 10.1016/j.meegid.2013.10.021 [DOI] [PubMed] [Google Scholar]
- Kamar, N. , Izopet, J. , Pavio, N. , Aggarwal, R. , Labrique, A. , Wedemeyer, H. , & Dalton, H. R. (2017). Hepatitis E virus infection. Nature Reviews Disease Primers, 3, 17086 10.1038/nrdp.2017.86 [DOI] [PubMed] [Google Scholar]
- Klovins, J. , Overbeek, G. P. , van den Worm, S. H. , Ackermann, H. W. , & van Duin, J. (2002). Nucleotide sequence of a ssRNA phage from Acinetobacter: Kinship to coliphages. Journal of General Virology, 83(Pt 6), 1523–1533. 10.1099/0022-1317-83-6-1523 [DOI] [PubMed] [Google Scholar]
- Kulkarni, M. A. , Walimbe, A. M. , Cherian, S. , & Arankalle, V. A. (2009). Full length genomes of genotype IIIA Hepatitis A Virus strains (1995–2008) from India and estimates of the evolutionary rates and ages. Infection, Genetics and Evolution, 9(6), 1287–1294. 10.1016/j.meegid.2009.08.009 [DOI] [PubMed] [Google Scholar]
- Lu, L. , Li, C. , & Hagedorn, C. H. (2006). Phylogenetic analysis of global hepatitis E virus sequences: Genetic diversity, subtypes and zoonosis. Reviews in Medical Virology, 16(1), 5–36. 10.1002/rmv.482 [DOI] [PubMed] [Google Scholar]
- Marano, G. , Franchini, M. , Farina, B. , Piccinini, V. , & Pupella, S. , Vaglio, S. , … Liumbruno, G. M. (2017). The human pegivirus: A new name for an "ancient" virus. Can transfusion medicine come up with something new? Acta Virologica, 61(4), 401–412. [DOI] [PubMed] [Google Scholar]
- McKnight, K. L. , & Lemon, S. M. (2018). Hepatitis A virus genome organization and replication strategy. Cold Spring Harbor Perspectives in Medicine, 8(12), a033480 10.1101/cshperspect.a033480 [DOI] [PMC free article] [PubMed] [Google Scholar]
- McWilliam, A. N. (1987). The reproductive cycle and social biology of Coleura afra in a seasonal environment In Fenton M. B., Racey P. A., & Rayner J. M. V. (Eds.), Recent advances in the Study of Bats (pp. 281–298). Cambridge, UK: Cambridge University Press. [Google Scholar]
- Moratorio, G. , Costa‐Mattioli, M. , Piovani, R. , Romero, H. , Musto, H. , & Cristina, J. (2007). Bayesian coalescent inference of hepatitis A virus populations: Evolutionary rates and patterns. Journal of General Virology, 88(Pt 11), 3039–3042. 10.1099/vir.0.83038-0 [DOI] [PubMed] [Google Scholar]
- Nga, P. T. , Parquet Mdel, C. , Lauber, C. , Parida, M. , Nabeshima, T. , Yu, F. , … Gorbalenya, A. E. (2011). Discovery of the first insect nidovirus, a missing evolutionary link in the emergence of the largest RNA virus genomes. PLoS Path, 7(9), e1002215 10.1371/journal.ppat.1002215 [DOI] [PMC free article] [PubMed] [Google Scholar]
- Olsthoorn, R. , & Van Duin, J. (2011). Bacteriophages with ssRNA. Wiley Online Library; 10.1002/9780470015902.a0000778.pub3 [DOI] [Google Scholar]
- Pintó, R. M. , Aragonès, L. , Costafreda, M. I. , Ribes, E. , & Bosch, A. (2007). Codon usage and replicative strategies of hepatitis A virus. Virus Research, 127(2), 158–163. 10.1016/j.virusres.2007.04.010 [DOI] [PubMed] [Google Scholar]
- Pintó, R. M. , Pérez‐Rodríguez, F. J. , D'Andrea, L. , de Castellarnau, M. , Guix, S. , & Bosch, A. (2018). Hepatitis A virus codon usage: Implications for translation kinetics and capsid folding. Cold Spring Harbor Perspectives in Medicine, 8(10), a031781 10.1101/cshperspect.a031781 [DOI] [PMC free article] [PubMed] [Google Scholar]
- Preciado, M. V. , Valva, P. , Escobar‐Gutierrez, A. , Rahal, P. , Ruiz‐Tovar, K. , Yamasaki, L. , … Cruz‐Rivera, M. (2014). Hepatitis C virus molecular evolution: Transmission, disease progression and antiviral therapy. World Journal of Gastroenterology, 20(43), 15992–16013. 10.3748/wjg.v20.i43.15992 [DOI] [PMC free article] [PubMed] [Google Scholar]
- Price, M. N. , Dehal, P. S. , & Arkin, A. P. (2009). FastTree: Computing large minimum evolution trees with profiles instead of a distance matrix. Molecular Biology and Evolution, 26(7), 1641–1650. 10.1093/molbev/msp077 [DOI] [PMC free article] [PubMed] [Google Scholar]
- Primadharsini, P. P. , Nagashima, S. , & Okamoto, H. (2019). Genetic variability and evolution of hepatitis E virus. Viruses, 11(5), 456 10.3390/v11050456 [DOI] [PMC free article] [PubMed] [Google Scholar]
- Sharp, P. M. , & Li, W. H. (1986). An evolutionary perspective on synonymous codon usage in unicellular organisms. Journal of Molecular Evolution, 24(1–2), 28–38. 10.1007/BF02099948 [DOI] [PubMed] [Google Scholar]
- Simmonds, P. , Bukh, J. , Combet, C. , Deléage, G. , Enomoto, N. , Feinstone, S. , … Widell, A. (2005). Consensus proposals for a unified system of nomenclature of hepatitis C virus genotypes. Hepatology, 42(4), 962–973. 10.1002/hep.20819 [DOI] [PubMed] [Google Scholar]
- Smith, D. B. , Bukh, J. , Kuiken, C. , Muerhoff, A. S. , Rice, C. M. , Stapleton, J. T. , & Simmonds, P. (2014). Expanded classification of hepatitis C virus into 7 genotypes and 67 subtypes: Updated criteria and genotype assignment web resource. Hepatology, 59(1), 318–327. 10.1002/hep.26744 [DOI] [PMC free article] [PubMed] [Google Scholar]
- Smith, D. B. , Simmonds, P. , Izopet, J. , Oliveira‐Filho, E. F. , Ulrich, R. G. , Johne, R. , … Purdy, M. A. (2016). Proposed reference sequences for hepatitis E virus subtypes. Journal of General Virology, 97(3), 537–542. 10.1099/jgv.0.000393 [DOI] [PMC free article] [PubMed] [Google Scholar]
- Takahashi, K. , Toyota, J. , Karino, Y. , Kang, J. H. , Maekubo, H. , Abe, N. , & Mishiro, S. (2004). Estimation of the mutation rate of hepatitis E virus based on a set of closely related 7.5‐year‐apart isolates from Sapporo, Japan. Hepatology Research, 29(4), 212–215. 10.1016/j.hepres.2004.04.004 [DOI] [PubMed] [Google Scholar]
- Tokita, H. , Okamoto, H. , Iizuka, H. , Kishimoto, J. , Tsuda, F. , Lesmana, L. A. , … Mayumi, M. (1996). Hepatitis C virus variants from Jakarta, Indonesia classifiable into novel genotypes in the second (2e and 2f), tenth (10a) and eleventh (11a) genetic groups. Journal of General Virology, 77(Pt 2), 293–301. 10.1099/0022-1317-77-2-293 [DOI] [PubMed] [Google Scholar]
- Vaughan, G. , Goncalves Rossi, L. M. , Forbi, J. C. , de Paula, V. S. , Purdy, M. A. , Xia, G. , & Khudyakov, Y. E. (2014). Hepatitis A virus: Host interactions, molecular epidemiology and evolution. Infection, Genetics and Evolution, 21, 227–243. 10.1016/j.meegid.2013.10.023 [DOI] [PubMed] [Google Scholar]
- Wang, X. , Ren, J. , Gao, Q. , Hu, Z. , Sun, Y. , Li, X. , … Fry, E. E. (2015). Hepatitis A virus and the origins of picornaviruses. Nature, 517(7532), 85–88. 10.1038/nature13806 [DOI] [PMC free article] [PubMed] [Google Scholar]
- Webb, G. W. , & Dalton, H. R. (2019). Hepatitis E: An underestimated emerging threat. Therapeutic Advances in Infectious Disease, 6, 204993611983716 10.1177/2049936119837162. eCollection 2019. [DOI] [PMC free article] [PubMed] [Google Scholar]
- Whitman, W. B. , Oren, A. , Chuvochina, M. , da Costa, M. S. , Garrity, G. M. , Rainey, F. A. , … Ventura, S. (2018). Proposal of the suffix ‐ota to denote phyla. Addendum to ‘Proposal to include the rank of phylum in the International Code of Nomenclature of Prokaryotes’. International Journal of Systematic and Evolutionary Microbiology, 68(3), 967–969. 10.1099/ijsem.0.002593 [DOI] [PubMed] [Google Scholar]
- Wilson, J. E. , Powell, M. J. , Hoover, S. E. , & Sarnow, P. (2000). Naturally occurring dicistronic cricket paralysis virus RNA is regulated by two internal ribosome entry sites. Molecular and Cellular Biology, 20(14), 4990–4999. 10.1128/MCB.20.14.4990-4999.2000 [DOI] [PMC free article] [PubMed] [Google Scholar]
- Wright, F. (1990). The ‘effective number of codons’ used in a gene. Gene, 87(1), 23–29. 10.1016/0378-1119(90)90491-9 [DOI] [PubMed] [Google Scholar]
- Xia, X. (2013). DAMBE5: A comprehensive software package for data analysis in molecular biology and evolution. Molecular Biology and Evolution, 30(7), 1720–1728. 10.1093/molbev/mst064 [DOI] [PMC free article] [PubMed] [Google Scholar]
- Yamada, K. D. , Tomii, K. , & Katoh, K. (2016). Application of the MAFFT sequence alignment program to large data—reexamination of the usefulness of chained guide trees. Bioinformatics, 32, 3246–3251. 10.1093/bioinformatics/btw412 [DOI] [PMC free article] [PubMed] [Google Scholar]
- Zhang, X. , Cai, Y. , Zhai, X. , Liu, J. , Zhao, W. , Ji, S. , … Zhou, J. (2018). Comprehensive analysis of codon usage on rabies virus and other lyssaviruses. International Journal of Molecular Sciences, 19(8), 2397 10.3390/ijms19082397 [DOI] [PMC free article] [PubMed] [Google Scholar]
- Zirkel, F. , Kurth, A. , Quan, P. L. , Briese, T. , Ellerbrok, H. , Pauli, G. , … Junglen, S. (2011). An insect nidovirus emerging from a primary tropical rainforest. MBio, 2(3), e00077–e111. 10.1128/mBio.00077-11 [DOI] [PMC free article] [PubMed] [Google Scholar]
Associated Data
This section collects any data citations, data availability statements, or supplementary materials included in this article.
Data Availability Statement
All sequences used for comparisons are publicly available at GenBank. The data used for generation of the figures are available from the corresponding author upon request.


