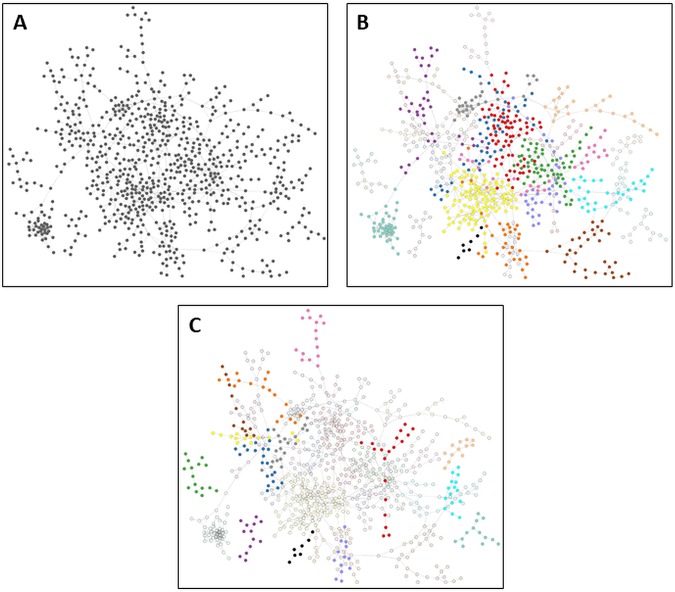
FIG 2.
Network clustering of genes. (A) All transcriptomic data were examined using CLR to infer a network that links genes based on coexpression. Each gray circle represents an N. gonorrhoeae gene, and each line represents an instance of coexpression between a gene pair. Networks were viewed using Cytoscape, which attempts to cluster groups of highly linked genes together. (B) Genes in the network were grouped into 1 of 26 modules (groups of highly coexpressed genes). The 13 largest modules shown are distinguished by color. Genes that are faded are in smaller modules, while genes that are colored black were not grouped into any module. (C) The remaining 13 smaller modules shown are distinguished by color. Genes that are faded are in larger modules, and genes that are colored black were not grouped into any module.

