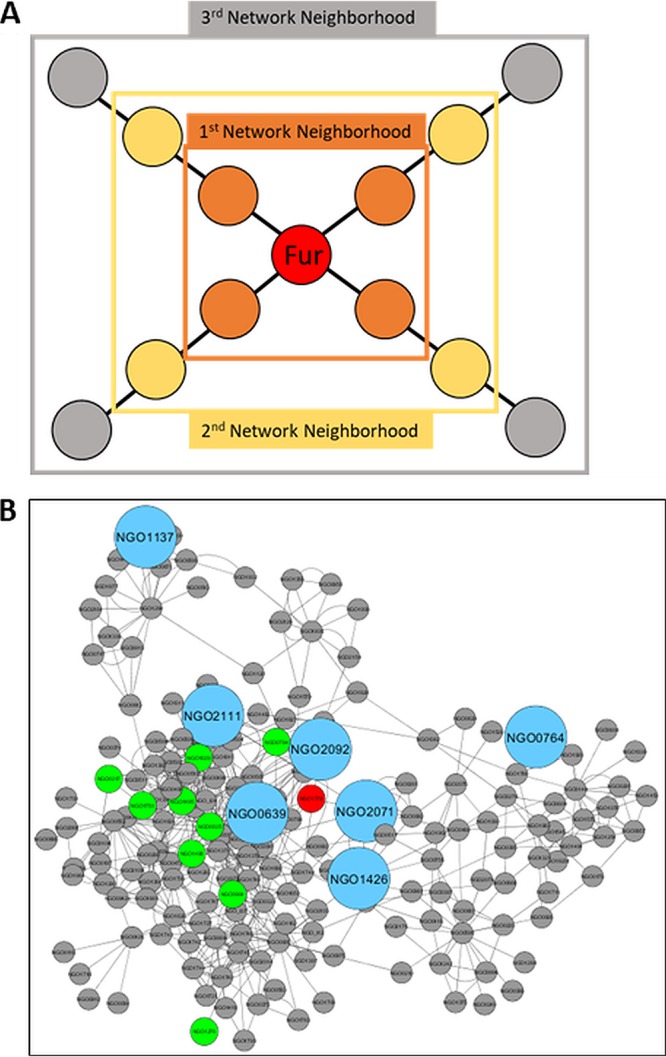
FIG 5.

Network neighborhood of Fur. (A) Schematic of how network neighborhood is defined. (B) The third network neighborhood of Fur in a network inferred using GENIE3. The fur gene is shown as a large red node, with known targets of Fur shown as larger green nodes and putative new targets of Fur, those that contain a Fur binding site and are within the network neighborhood, shown as much larger blue nodes.
