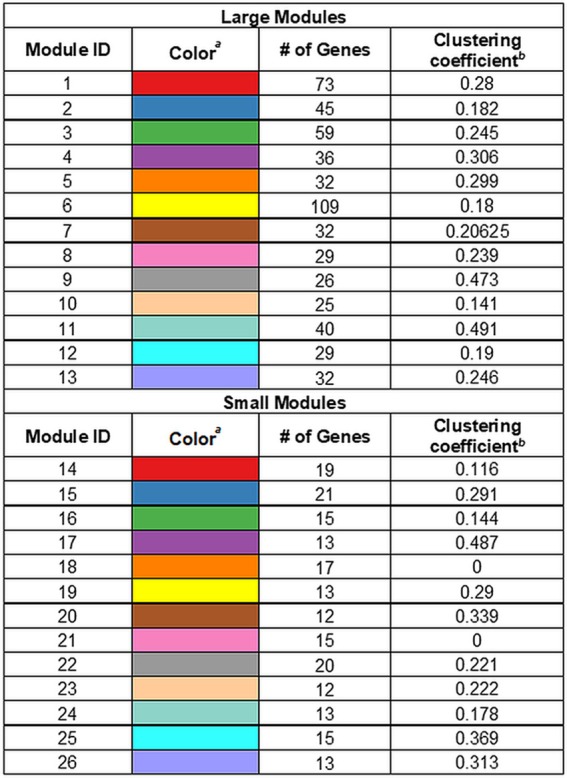
TABLE 1.
Network modules

The colors of the modules as depicted in Fig. 2 are shown.
The clustering coefficients of the modules are shown, a measure of the ratio of node triplets/edges in the module.
Network modules

The colors of the modules as depicted in Fig. 2 are shown.
The clustering coefficients of the modules are shown, a measure of the ratio of node triplets/edges in the module.