Automated diagnostic microscopy powered by deep learning is useful, particularly in rural areas. However, there is no general method for object detection of different cells. In this study, we developed GFS-ExtremeNet, a geometry-aware deep-learning method which is based on the detection of four extreme key points for each object (topmost, bottommost, rightmost, and leftmost) and its center point. A postprocessing step, namely, adjacency spectrum, was employed to measure whether the distances between the key points were below a certain threshold for a particular cell candidate. Our newly proposed geometry-aware deep-learning method outperformed other conventional object detection methods and could be applied to any type of cell with a certain geometrical order. Our GFS-ExtremeNet approach opens a new window for the development of an automated cell detection system.
KEYWORDS: ExtremeNet, adjacency spectrum, cell detection, geometry aware, microscopic image, protozoa
ABSTRACT
Analyzing cells and tissues under a microscope is a cornerstone of biological research and clinical practice. However, the challenge faced by conventional microscopy image analysis is the fact that cell recognition through a microscope is still time-consuming and lacks both accuracy and consistency. Despite enormous progress in computer-aided microscopy cell detection, especially with recent deep-learning-based techniques, it is still difficult to translate an established method directly to a new cell target without extensive modification. The morphology of a cell is complex and highly varied, but it has long been known that cells show a nonrandom geometrical order in which a distinct and defined shape can be formed in a given type of cell. Thus, we have proposed a geometry-aware deep-learning method, geometric-feature spectrum ExtremeNet (GFS-ExtremeNet), for cell detection. GFS-ExtremeNet is built on the framework of ExtremeNet with a collection of geometric features, resulting in the accurate detection of any given cell target. We obtained promising detection results with microscopic images of publicly available mammalian cell nuclei and newly collected protozoa, whose cell shapes and sizes varied. Even more striking, our method was able to detect unicellular parasites within red blood cells without misdiagnosis of each other.
IMPORTANCE Automated diagnostic microscopy powered by deep learning is useful, particularly in rural areas. However, there is no general method for object detection of different cells. In this study, we developed GFS-ExtremeNet, a geometry-aware deep-learning method which is based on the detection of four extreme key points for each object (topmost, bottommost, rightmost, and leftmost) and its center point. A postprocessing step, namely, adjacency spectrum, was employed to measure whether the distances between the key points were below a certain threshold for a particular cell candidate. Our newly proposed geometry-aware deep-learning method outperformed other conventional object detection methods and could be applied to any type of cell with a certain geometrical order. Our GFS-ExtremeNet approach opens a new window for the development of an automated cell detection system.
INTRODUCTION
Automatic detection of different types of cells in microscopy images are of significant interest to a wide range of biological research and clinical practices. Therefore, several computer-aided cell detection methods, ranging from decision trees to deep-learning-based techniques, have been proposed (1–4). In the early years, many efforts were devoted to extracting handcrafted features for cell detection and classification (1, 2). However, they faced several challenges, including incomplete feature representation, the high complexity of the detection methods, and low accuracies of detection. New methods using a deep-learning architecture are able to extract the depth features of images more comprehensively. Prior knowledge of the features to be selected is unnecessary; thus, the accuracy of detection is significantly improved by avoiding the misrepresentation of important features. However, the target is essentially detected as a point rather than a complex, ignoring details such as size and shape (3–5).
Object detection using deep learning is revolutionizing various areas, including entertainment (6), surveillance (7), and even self-driving automobiles (8). Deep-learning frameworks for object detection can be grouped into two different approaches: one-stage detection (e.g., single-shot detection [SSD], you only look once [YOLO], CornerNet, and ExtremeNet [9–12]) and two-stage detection (e.g., regional convolutional neural network [R-CNN] family, including R-CNN, Fast R-CNN, Faster R-CNN, and Mask R-CNN [13–16]). It is known that the two-stage approach is superior in detection and positioning accuracy, but the one-stage approach is faster in detection speed (12). Among the one-stage frameworks, ExtremeNet is considered to be the best model in terms of performance and accuracy (12). This approach employs an hourglass network as its backbone network for key-point detection, including extreme points and center points, and key points are combined with the method of exhaustion (12, 17).
For microscopic cell detection, ExtremeNet is prone to a combination error in the case of multiple cell targets and overlapping targets because the geometric correlation between every two key points is not considered in the key-point combination.
Recently, some implementations that include morphological features indicating the shapes of target cells in the deep-learning models were reported. Tofighi et al. (18) developed shape priors with convolutional neural networks (SP-CNN) by learning the shapes of cells. Falk et al. (5) reported a universal network (U-Net) using deep learning for cell counting, detection, and even shape measurements. Nevertheless, these implementations are still inept for new cell targets with a variety of cell shapes and sizes, resulting in imperfect localization and detection (3).
It has long been recognized that cells show distinct and defined geometric order of a given type. Cells are generally round, but the cells of some unicellular organisms show great variations in terms of shape and size. For example, protozoa and single-celled eukaryotes, including some parasites, exhibit morphological features distinct from those of mammalian cells (Fig. 1).
FIG 1.
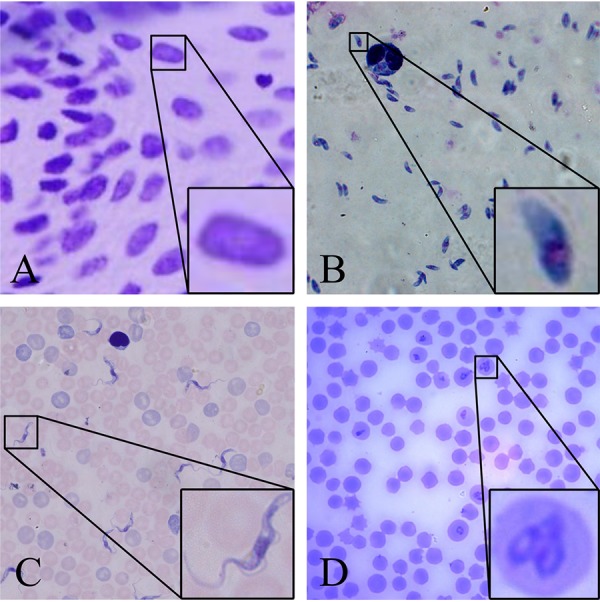
Examples of typical cell images under the microscope. The boxes frame a few targets that need to be detected and magnified. (A) Nucleus; (B) Toxoplasma; (C) Trypanosoma; (D) Babesia.
Herein, we propose a simple and efficient geometry-aware deep-learning approach for cell detection. By converting the thought that each cell has its own unique geometric order, we redesigned the ExtremeNet framework by incorporating a geometric-feature spectrum. We refer to this network as the geometric-feature spectrum ExtremeNet (GFS-ExtremeNet), which introduces geometric information into the key-point combination process to achieve improved accuracy in cell detection.
To illustrate this improved performance, we show the high accuracy and effectiveness of our GFS-ExtremeNet approach with the publicly available data set of mammalian cell nuclei (Fig. 1A) by outperforming other state-of-the-art alternatives (Table 1). In addition, we demonstrate the generality of our GFS-ExtremeNet model in solving complicated microscopic cell identification tasks with three newly collected unicellular parasitic protozoa, namely, Toxoplasma, Babesia, and Trypanosoma parasites. Toxoplasma is a single-cell protozoan parasite capable of infecting all warm-blooded animals as well as one-third of the world’s human population (19–21). The name Toxoplasma is derived from the Greek word toxon, meaning arc or bow shaped, in reference to the unique crescent shape of the parasite (Fig. 1B). Trypanosoma parasite, a unicellular protozoan, infects wild and domesticated animals and humans. In humans, Trypanosoma parasite is a causative agent of Chagas disease in Latin America and African sleeping sickness in sub-Saharan Africa (22), and these diseases are some of the most severe public health problems in these developing countries. In the blood plasma of patients, a Trypanosoma parasite forms a thin, flattened, and spindle-shaped body (Fig. 1C). Babesia, an intraerythrocytic protozoan parasite, is responsible for a malaria-like illness that imposes a significant health burden on animals and occasionally humans worldwide (23, 24). The Babesia parasites are characteristically pear shaped (Fig. 1D), and sometimes an irregularly shaped form may also be found within red blood cells (RBCs). Microscopy is the most commonly used method in the diagnosis and analysis of these parasites from infection samples. Identifying and analyzing the parasite cells accurately and efficiently can help reduce the disease burden, especially in areas with limited resources.
TABLE 1.
Results of GFS-ExtremeNet and baselines for the nucleus data set
| Approach | Method | Backbone | AP(0.5:0.95) | AP75 | AP50 |
|---|---|---|---|---|---|
| Two stage | Faster R-CNN | ResNet-101 | 21.45 | 23.96 | 35.89 |
| Mask R-CNN | ResNet-101 | 45.20 | 51.82 | 67.20 | |
| One stage | SSD | ResNet-101 | 14.32 | 11.42 | 32.54 |
| YOLOv3 | DarkNet-53 | 38.68 | 33.46 | 76.76 | |
| CornerNet | Hourglass-104 | 74.18 | 79.23 | 83.46 | |
| GFS-CornerNet | Hourglass-104 | 74.86 | 81.07 | 85.87 | |
| ExtremeNet | Hourglass-104 | 76.66 | 85.84 | 88.41 | |
| GFS-ExtremeNet | Hourglass-104 | 77.96 | 87.47 | 90.22 |
RESULTS
Comparison of different target detection models as the backbone network.
To compare various common target detection algorithms, we tested two-stage algorithms, namely, Faster R-CNN and Mask R-CNN, and one-stage algorithms, namely, SSD, YOLOv3, CornerNet, and ExtremeNet, on the nucleus data set. As shown in Table 1, ExtremeNet outperformed all other backbone methods in its AP(0.5:0.95), AP75, and AP50. AP(0.5:0.95) corresponds to the average precision (AP) for the intersection-over-union (IoU) threshold from 0.5 to 0.95, with a step size of 0.05. The IoU threshold was set to 0.5 (AP50) and 0.75 (AP75).
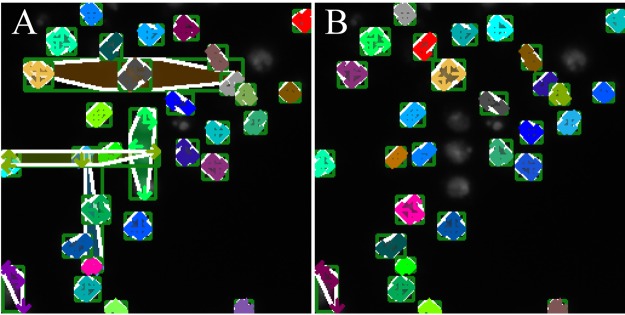
Although ExtremeNet has the best performance in the nucleus data set, this algorithm cannot be used directly for microscopic images. Because of the complexity of a microscope image, the distributions of cells are globally sparse and locally dense, with overlapping and juxtaposition. As a result, in the combination process of extreme points, the extreme point of a given target might be mistakenly paired with the adjacent extreme point of the other target, resulting in an incorrect recognition result (Fig. 2A). The reason for this erroneous result is that the algorithm generates only extreme points and center points without consideration for the relationship between the points. As a result, the points that have been combined are likely to be combined with other points again, resulting in an incorrect combination result. To overcome these drawbacks, we introduced a geometry-aware software into ExtremeNet by using the adjacency spectrum, namely, GFS-ExtremeNet. The improved detection results through GFS-ExtremeNet are shown in Table 1 and Fig. 2.
FIG 2.
GFS-ExtremeNet’s role in microscopic image detection. (A) ExtremeNet’s poor performance with microscopic images; (B) GFS-ExtremeNet’s improved detection result.
GFS-ExtremeNet.
It has long been recognized that cells show distinct and defined geometric order of a given type. Cells are generally round, but some unicellular organism cells show great variations in terms of shape and size.
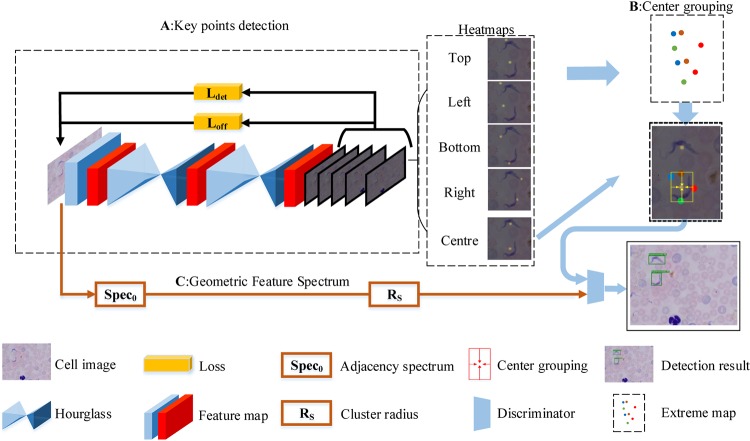
By considering the thought that each cell has its own unique geometric order, we redesigned ExtremeNet by incorporating a geometric feature, the adjacency spectrum (Fig. 3). We evaluated our proposed GFS-ExtremeNet method on the same publicly available nucleus data set. As can be seen from the results in Table 1, our GFS-ExtremeNet algorithm outperformed ExtremeNet.
FIG 3.
Schematic representation of the GFS-ExtremeNet algorithm in microscopic-image detection. Overall, this geometry-aware approach is divided into two parts. (A) The first part is using the hourglass network to extract the extreme and the center points of the target and generating heatmaps for those points. In addition, the relationship of the extreme points is measured and passed to the second stage in forming the adjacency spectrum. (B) The second part is the feature combination, mainly center grouping. (C) After the geometric relationship is combined, the adjacency spectrum is then used for verification to form the detection results.
In order to evaluate the effectiveness and generalization of the geometry-aware approach, we also tested the performance of the geometric-feature spectrum on CornerNet, which is another commonly used object detection framework. As shown in the Table 1, the performance of GFS-CornerNet was substantially reduced compared to that of GFS-ExtremeNet but better than that of CornerNet. These results illustrated the superiority of ExtremeNet and the importance of the geometric-feature spectrum.
Detection performance with parasite microscopic images.
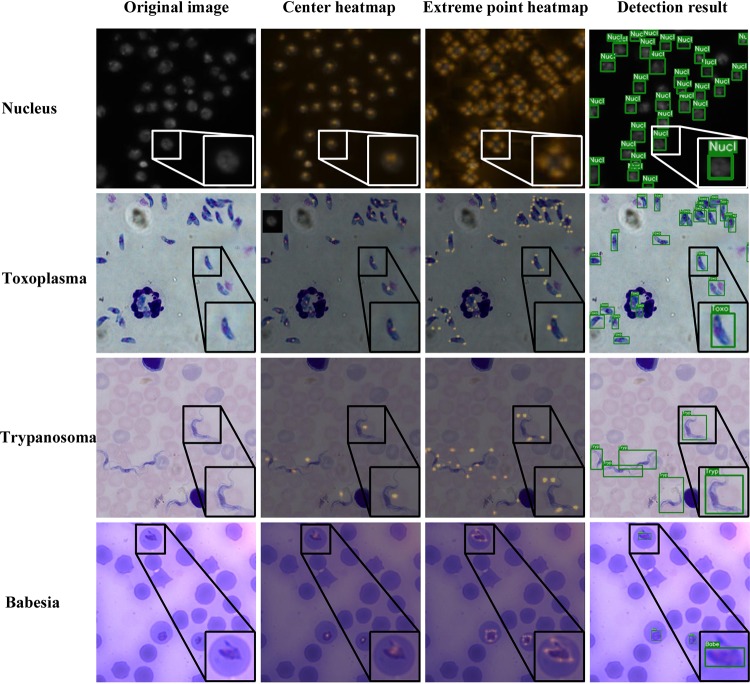
To investigate the generalizability of our system to the detection of different microscopic cell images, we conducted the same deep-learning framework analysis on several unicellular protozoon microscopic images, including banana-shaped Toxoplasma, spindle-shaped Trypanosoma parasite, and pear-shaped Babesia. Some examples of those microscopic images are shown in Fig. 4. From the first row of results in Fig. 4, we prove that our model performs satisfactorily in detecting nuclei, missing very few targets. From the second row of results, our GFS-ExtremeNet can successfully detect numerous overlapping and aggregated forms of Toxoplasma in the stained images, distinguishing them from host cells and debris. Trypanosoma parasite has an elongated and flattened leaf-like body with a flagellum on its end. The use of this parasite is to prove that our model can obtain acceptable results in cells with complicated shapes. As a result, the GFS-ExtremeNet algorithm detected all Trypanosoma parasites, not RBCs. All three types of cells mentioned above are isolated ones, which leads us to wonder if our model can detect organisms properly in even more difficult situations. The parasite Babesia, like the malaria agent, can reside and replicate within RBCs, representing a picture-in-a-picture situation. As shown in the last line of Fig. 4, a high accuracy of detection was obtained for this intraerythrocytic parasite.
FIG 4.
Detection results obtained by GFS-ExtremeNet. Examples of nuclei (Nucl), Toxoplasma (Toxo), Trypanosoma (Tryp), and Babesia (Babe) parasites are presented. The first-column images are the original images to be detected, the second-column images are the center-point heatmaps, and the third-column images are extreme-point heatmaps. The fourth-column images are the final test detection result, where the target is identified by the box frame, with the name and score of the target shown.
In comparison, we measured the AP(0.5:0.95), AP75, and AP50 values of different parasitic targets, including Toxoplasma, Trypanosoma, and Babesia, with both GFS-ExtremeNet and ExtremeNet (Table 2). As shown in Table 2, as with the nucleus data set, GFS-ExtremeNet outperformed ExtremeNet for all three parasites targets, indicating the irreplaceable role of the geometric-feature spectrum in cell detection.
TABLE 2.
Results of GFS-ExtremeNet and ExtremeNet on parasite microscopic imagesa
| Parasite | Model | AP(0.5:0.95) | AP75 | AP50 |
|---|---|---|---|---|
| Babesia | ExtremeNet | 35.87 | 23.18 | 72.90 |
| GFS-ExtremeNet | 37.14 | 24.55 | 74.16 | |
| Trypanosoma | ExtremeNet | 58.30 | 68.23 | 92.00 |
| GFS-ExtremeNet | 58.72 | 68.41 | 95.02 | |
| Toxoplasma | ExtremeNet | 30.91 | 22.60 | 68.47 |
| GFS-ExtremeNet | 32.70 | 23.50 | 69.77 |
The performances of GFS-ExtremeNet (with geometric-feature spectrum) and ExtremeNet (without geometric-feature spectrum) with three parasites targets were compared.
To visualize how capable the GFS-ExtremeNet model is in distinguishing between different parasites, we deployed a two-dimensional (2D) t-distributed stochastic neighbor embedding (t-SNE) plot to show cluster performance (Fig. 5). t-SNE can be used to visualize high-dimensional data in 2D, maintaining local structures. The t-SNE plot shows three separated distribution clusters, indicating that GFS-ExtremeNet can correctly distinguish different parasites.
FIG 5.
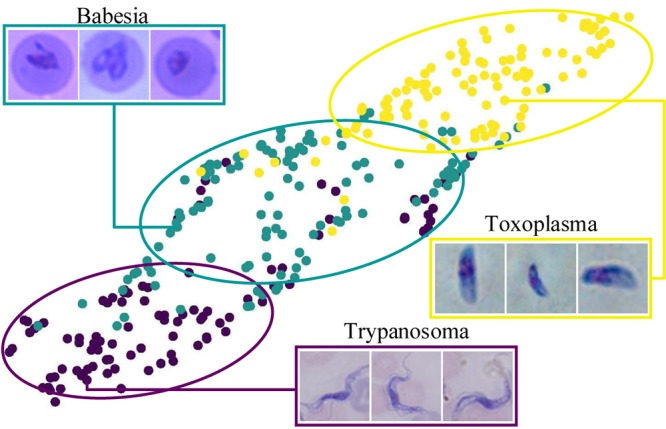
t-SNE plot of GFS-ExtremeNet. t-SNE provides a method to evaluate and refine the clustering of different parasite cells’ images. Data points are colored according to their labels.
The practicality of the model is largely determined by how well it will do when asked to make new predictions for data that it has not already seen. To avoid the bias of the images acquired, we gathered 10 different trypanosome images from the Internet, representing the data style in a variety of different situations. Our GFS-ExtremeNet model was able to achieve an average of 94.4% recognition accuracy with these new images.
In comparison with biologists.
To compare our GFS-ExtremeNet model with human biologists, the participants and the machine were provided with each of the 130 parasite images. Four experienced annotators commented on the images to identify the parasites independently (Fig. 6). Close analysis of the results reveals that the GFS-ExtremeNet model achieved 69.26% ± 3.68%, 70.22% ± 1.31%, and 95.89% ± 1.18% average accuracies for Babesia, Toxoplasma, and Trypanosoma, respectively, while humans achieved 68.25% ± 8.92%, 70.50% ± 9.57%, and 83.75% ± 3.86% average accuracies. As seen from this result, in terms of accuracy, the performance of GFS-ExtremeNet is similar to or better than that of humans. Moreover, the high error bar for humans indicates the variable performance of humans. It cannot be easy for inexperienced clinicians to distinguish between different cell targets and even between cells and artifacts (such as stain or platelet debris) by the physical examination of slides alone. Therefore, the detection accuracy highly depends on how well trained and experienced the professionals are. The deep-learning system may potentially aid clinicians in these examinations by providing automated, accurate, and timely testing.
FIG 6.
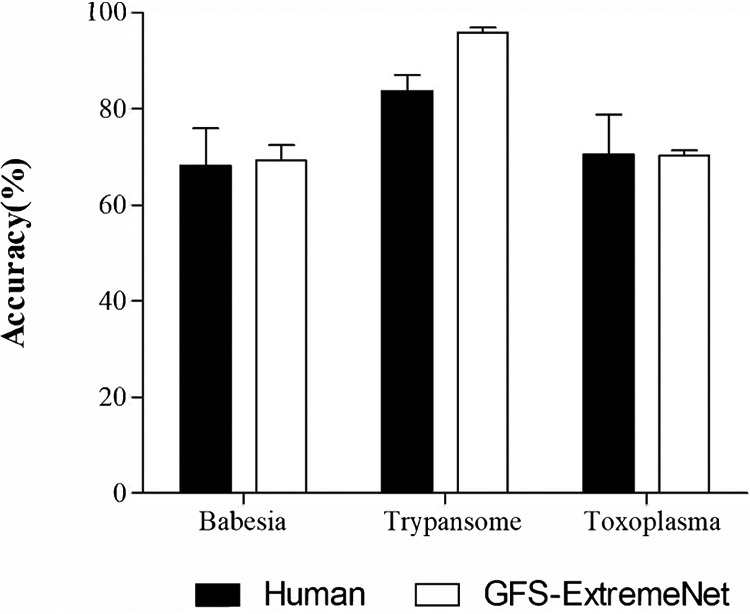
The accuracies of humans were compared to those of GFS-ExtremeNet. The performance of GFS-ExtremeNet is similar to or better than that of humans.
Discussion and conclusions.
Our study is the first to investigate a cell recognition task with the use of a geometric-feature spectrum as well as the first to propose a geometry-aware deep-learning approach. Cell shape and size can vary considerably, making an algorithm for reliable detection difficult. Parasites can live inside host cells and their shapes can overlap erythrocytes to make recognition even more difficult. Very few of the previous works considered the importance of shape in cell target detection. To address these challenges, we proposed the GFS-ExtremeNet model, enabling systematic learning of the features from a determined area within extreme points. Through experiments on publicly available and self-obtained microscopic cell images, we have successfully demonstrated that our GFS-ExtremeNet model can detect multiple cell types, including Babesia, Toxoplasma and Trypanosoma parasites, with high accuracy. However, the labeling of specific extreme points that best reflect the geometric features of a target of interest is a prerequisite for new-target training. It may limit the use of this method by a nonprofessional developer. As a result, the accuracy is highly dependent on the labeling of the extreme point in the innate area of data training. In the future, an automatic extreme-point detection method which will be able to reduce the time needed for labeling and be broadly applicable by the general public and inexperienced clinicians will be developed.
Moreover, the internal rules in our model for feature selection within the extreme boxes are not well understood. Traits such as color and texture might be also important for the deep-learning model to recognize the target. Therefore, to build a more reliable model, images from other testing scenarios need to be learned by the model.
Our model can be applied to any microscope image targets with certain geometric orders, showing promising and broader application potential for microscopic image analysis. This is immensely helpful in the development of an automated cell detection system with improved efficiency and a reduced error rate.
MATERIALS AND METHODS
Data set.
Four different microscopic image data sets, including images from nuclei, Toxoplasma, Trypanosoma, and Babesia, were used in this study. For nuclei, we used a publicly available data set to verify and compare the performance of our model with those of alternative models. A total of 670 whole-slide images (WSIs) with 29,461 nuclei were used, and images were split into train, test, and verification sets, with a ratio of 8:1:1. With complete annotations for object segmentation masks made, we found the extreme points in the four directions of the mask and used them as our annotations of targets.
The other three sets of parasite images were acquired with a bright-field light microscope (Olympus IX53) with 100× oil immersion objectives. In total, we collected 261 Toxoplasma, 480 Trypanosoma, and 567 Babesia WSIs. We used LabelMe (25) to obtain annotations of these parasites, and we then marked the four extreme points of each target.
Deep-learning methods for object detection.
Deep-learning methods for object detection can be grouped by two different approaches: one-stage detection and two-stage detection. Faster R-CNN and Mask R-CNN, two representative algorithms for two-stage detectors, are selected in this study. YOLO, SSD, CornerNet, and ExtremeNet, main representatives of one-stage algorithms, were also evaluated. The detailed algorithms and model setting followed those in previously described papers (9–12).
ExtremeNet.
ExtremeNet, one of the most state-of-art algorithms mainly converts the detection of key points to extreme points in four directions and a central point. In the first part, four extreme-point heatmaps and one center-point heatmap are detected by the standard key-point estimation network, the hourglass network (usually used in the human pose estimation field). In the second part, the extracted key points are combined through pure geometric theory, and a set of extreme points corresponding to a detection target are formed. The detailed algorithm is divided into two steps, key-point detection and center grouping (12). In key-point detection, the algorithm transforms the problem of target detection into key-point estimation, avoiding regional classification and feature learning. A multichannel heatmap was predicted using the fully convolutional encoder-decoder network. Using the hourglass network as the backbone, each heatmap was weighted point by point logically, the purpose of which was to reduce the number of false-negative results around the ground truth. The loss of the improved version was used in the training network, as follows:
where is the improved focal loss, is the length of the microscopic image (represented by pixels), is the width, and is the number of targets in the image. The value of is the predicted score of the location,  , in the heatmap through the network, and is the corresponding true value. Both and are hyper-parameters, equal to 2 and 4, respectively.
To improve the accuracy of target detection, a class-independent offset map was added to the algorithm to compensate for the resolution loss caused by the process of down-sampling. Smooth was used during offset map training  , as follows:
where is the smooth L1 loss, Δ(α) is the key point offset, is the coordinate of the key point, and is the down-sampling factor.
Under the supervision of the above two losses, and  , the network outputs four extreme-point heatmaps and one center map: .
As can be seen from the above and  , this key-point-based target detection algorithm has an advantage: a greatly reduce labeling time compared with those of other supervised methods. In the microscopic image, there is a large number of parasites with different shapes. The algorithm needs to manually mark only the four extreme points of each target. Because of the mentioned advantages, we used the hourglass network and the two losses of and in GFS-ExtremeNet.
In addition, we used the hourglass network as the backbone network. As used mainly in pose estimation, the basic network is a fully convolutional neural network. Given a single red, green, and blue (RGB) image, the network outputs the precise pixel position of the key points of the target using multiscale features to capture the spatial position of each joint point of the target. Its network structure is shaped like an hourglass, hence the name “hourglass network” (17).
For center grouping, ExtractPeak (12) first extracts all the extreme points in the heatmap, which are defined as the maximum values in the 3 by 3 sliding window, forming four sets of extreme points:  ,
,  ,
,  , and
, and  . The second step is brute-force algorithm in which the center point of each extreme-point combination,
  , is calculated. If the response at the corresponding position of the center map exceeds the present threshold,
  , then this set of five points is taken as a temporary result because of its geometric ignorance between adjacent key points, and the score of the candidate combination is the average of the five corresponding points.
Adjacency spectrum.
According to the shortcomings of ExtremeNet described above, from the perspective of graph theory, we introduced the adjacency spectrum into the key-point combination process of ExtremeNet to measure the geometric relationship of each key point of the target cell to the adjacency spectrum. The process of model building is as follows:
-
1.
The hourglass network extracts extreme points in four directions, as follows:
 , where
  is the top extreme point,
  is the left extreme point,
  is the bottom extreme point, and
  is the right extreme point.
 -
2.
According to graph theory, the graph
 is constructed by using the above four extreme points.
  is the node set in graph
  , and
, and  is the edge set formed by the connection of two adjacent nodes in
  . For example, is the graph constructed by four extreme points of the cell. has no directionality in our model, so is an undirected graph.
 -
3.The nth-order square matrix,
 , constructed based on
  , is called the adjacency matrix of graph
  and is denoted by
  , where The weight,
 , is expressed by the Euclidean distance,
  , between two points; that is,
  . The adjacency matrix is denoted
 -
4.Calculate the adjacency spectrum,
 , of graph from adjacency matrix
  . The characteristic polynomial corresponding to is
  , is the coefficient in the characteristic polynomial, and the calculated eigenvalues, of
  , form the adjacency spectrum, of
  , and the process is transformed into a solution of the characteristic equation
  ; that is,
 which solves for n complex roots, and
 are the n eigenvalues of the adjacency matrix minus those of the adjacency spectrum,
  .
.
GFS-ExtremeNet.
The architecture of the GFS-ExtremeNet algorithm is based on the basis of ExtremeNet with the introduction of the adjacency spectrum. In the first stage, parameters such as and in loss  , batch size, and the maximum number of iterations,
  , were optimized. After training the hourglass network with the losses of and
  , back-propagation, and the use of the Adam optimizer to update the parameters in network
  , we obtained four extreme-point heatmaps and a center map:
  . The marked extreme points and corresponding images then needed to be fed into the hourglass network,
  . At the same time, we calculated the adjacency spectrum in the training set temporarily stored in after storing the adjacency spectra of all targets. The cluster radius,
  , of the adjacency spectrum corresponding to the target needed to be calculated. The second stage consisted of geometric combinations and verification of the adjacency spectrum. In the center-grouping stage, according to ExtractPeak, the heatmap was transformed into the coordinate set
  ,
,  ,
,  , and of the key points; the distances between the points were calculated and sequentially combined according to the distance. Using the geometric relationship, the combinations of the key point and the center point were verified one by one until the target outlook was formed. After the geometric relationships were combined, the semisuccessful target was temporarily formed, with the adjacency spectrum of the semisuccessful target calculated and verified by the of the first stage. If the verification was successful, it would eventually form a fully successful target; otherwise, it would continue to combine. The algorithm of GFS-ExtremeNet is shown in the Fig. 7.
FIG 7.
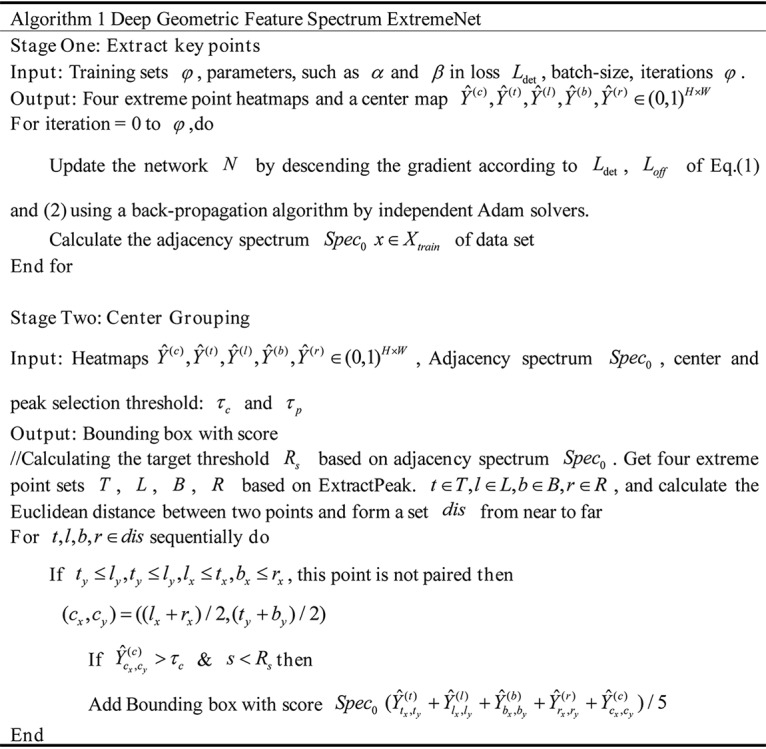
The algorithm of deep geometric-feature spectrum ExtremeNet (GFS-ExtremeNet).
Training detail and index.
We trained our network on the TensorFlow framework (26) with a Tesla K40C and 128-GB memory in an Ubuntu 16.04 system. In the training process, we generally followed the parameters set by the original ExtremeNet model: the learning rate of the network was 0.00025, and the optimizer for the training network was Adam. We fine-tuned our network from a pretrained ExtremeNet model during training. In addition, we used a total of 4 graphics-processing units (GPUs; Tesla K40C) to train 100,000 generations with a batch size of 28.
The average precision (AP) over a set of fixed recall thresholds was used to evaluate the performance of the models. The intersection-over-union (IoU) threshold was set to 0.5 (AP50) and 0.75 (AP75). AP(0.5:0.95) corresponds to the average AP for IoU from 0.5 to 0.95, with a step size of 0.05. For each test image, the network generated five heatmaps and then applied our center-grouping algorithm to these heatmaps. Following ExtremeNet, we kept the original image resolution instead of resizing it to a fixed size.
Data availability.
The codes and data sets that support the findings of this study are available on https://github.com/jiangdat/GFS-ExtremeNet.
ACKNOWLEDGMENTS
This project was financially supported by the Natural Science Foundation of Shenzhen City (project number JCYJ20180306172131515).
We report no conflicts of interest.
H.J. and W.L. wrote the code. H.J., S.L., and Y.Z. designed the experiments and analyzed the results. H.J., H.Z., J.L., and Y.Z. collected data. Y.Z. conceptualized and supervised the project.
REFERENCES
- 1.Wang M, Zhou X, Li F, Huckins J, King RW, Wong ST. 2017. Novel cell segmentation and online learning algorithms for cell phase identification in automated time-lapse microscopy, p 65–68. In Proceedings of the IEEE International Symposium on Biomedical Imaging: from Nano to Macro. IEEE, Arlington, VA, USA. [Google Scholar]
- 2.Pattanaik PA, Swarnkar T, Sheet D. 2017. Object detection technique for malaria parasite in thin blood smear images, p 2120–2123. In Proceedings of the IEEE International Conference on Bioinformatics and Biomedicine. IEEE, Kansas City, KS, USA. [Google Scholar]
- 3.Xue Y, Ray N. 2017. Cell detection with deep convolutional neural network and compressed sensing. arXiv 1708.03307 https://arxiv.org/abs/1708.03307. [DOI] [PubMed]
- 4.Zhou Y, Dou Q, Chen H, Qin J, Heng PA. 2018. SFCN-OPI: detection and fine-grained classification of nuclei using sibling FCN with objectness prior interaction, p 2652–2659. In Proceedings of the AAAI Conference on Artificial Intelligence. AAAI, New Orleans, LA, USA. [Google Scholar]
- 5.Falk T, Mai D, Bensch R, Çiçek Ö, Abdulkadir A, Marrakchi Y, Böhm A, Deubner J, Jäckel Z, Seiwald K, Dovzhenko A, Tietz O, Dal Bosco C, Walsh S, Saltukoglu D, Tay TL, Prinz M, Palme K, Simons M, Diester I, Brox T, Ronneberger O. 2019. U-Net: deep learning for cell counting, detection, and morphometry. Nat Methods 16:67–70. doi: 10.1038/s41592-018-0261-2. [DOI] [PubMed] [Google Scholar]
- 6.Luo Y, Zheng L, Guan T, Yu J, Yang Y. 2019. Taking a closer look at domain shift: category-level adversaries for semantics consistent domain adaptation, p 2507–2516. In Proceedings of the IEEE Conference on Computer Vision and Pattern Recognition. IEEE, Long Beach, CA, USA. [Google Scholar]
- 7.Sultani W, Chen C, Shah M. 2018. Real-world anomaly detection in surveillance videos. Real-world anomaly detection in surveillance videos, p 6479–6488. In Proceedings of the IEEE Conference on Computer Vision and Pattern Recognition. IEEE, Salt Lake City, UT, USA. [Google Scholar]
- 8.Li P, Chen X, Shen S. 2019. Stereo R-CNN based 3D object detection for autonomous driving, p 7644–7652. In Proceedings of the IEEE Conference on Computer Vision and Pattern Recognition. IEEE, Long Beach, CA, USA. [Google Scholar]
- 9.Liu W, Anguelov D, Erhan D, Szegedy C, Reed S, Fu CY, Berg AC. 2016. SSD: single shot multibox detector, p 21–37. In Proceedings of the European Conference on Computer Vision. Springer, Amsterdam, The Netherlands. [Google Scholar]
- 10.Law H, Deng J. 2018. CornerNet: detecting objects as paired keypoints, p 734–750. In Proceedings of the European Conference on Computer Vision. Springer, Munich, Germany. [Google Scholar]
- 11.Redmon J, Farhadi A. 2018. YOLOv3: an incremental improvement. arXiv 1804.02767 https://arxiv.org/abs/1804.02767.
- 12.Zhou X, Zhuo J, Krahenbuhl P. 2019. Bottom-up object detection by grouping extreme and center points, p 850–859. In Proceedings of the IEEE Conference on Computer Vision and Pattern Recognition. IEEE, Long Beach, CA, USA. [Google Scholar]
- 13.Girshick R, Donahue J, Darrell T, Malik J. 2014. Rich feature hierarchies for accurate object detection and semantic segmentation, p 580–587. In Proceedings of the IEEE Conference on Computer Vision and Pattern Recognition. IEEE, Columbus, OH, USA. [Google Scholar]
- 14.Girshick R. 2015. Fast R-CNN, p 1440–1448. In Proceedings of the IEEE International Conference on Computer Vision. IEEE, Santiago, Chile. [Google Scholar]
- 15.Ren S, He K, Girshick R, Sun J. 2015. Faster R-CNN: towards real-time object detection with region proposal networks, p 91–99. In Advances in Neural Information Processing Systems. NIPS, Montreal, Canada. [Google Scholar]
- 16.He K, Gkioxari G, Dollár P, Girshick R. 2017. Mask R-CNN, p 2961–2969. In Proceedings of the IEEE International Conference on Computer Vision. IEEE, Venice, Italy. [Google Scholar]
- 17.Newell A, Yang K, Deng J. 2016. Stacked hourglass networks for human pose estimation, p 483–499. In Proceedings of the European Conference on Computer Vision. Springer, Amsterdam, The Netherlands. [Google Scholar]
- 18.Tofighi M, Guo T, Vanamala JKP, Monga V. 2019. Prior information guided regularized deep learning for cell nucleus detection. IEEE Trans Med Imaging 38:2047–2058. doi: 10.1109/TMI.2019.2895318. [DOI] [PubMed] [Google Scholar]
- 19.Dubey JP. 2008. The history of Toxoplasma gondii—the first 100 years. J Eukaryot Microbiol 55:467–475. doi: 10.1111/j.1550-7408.2008.00345.x. [DOI] [PubMed] [Google Scholar]
- 20.Safronova A, Araujo A, Camanzo ET, Moon TJ, Elliot MR, Beiting DP, Yarovinsky F. 2019. Alarmin S100A11 initiates a chemokine response to the human pathogen Toxoplasma gondii. Nat Immunol 20:64–72. doi: 10.1038/s41590-018-0250-8. [DOI] [PMC free article] [PubMed] [Google Scholar]
- 21.Zhang Y, Lai BS, Juhas M, Zhang Y. 2019. Toxoplasma gondii secretory proteins and their role in invasion and pathogenesis. Microbiol Res 227:126293. doi: 10.1016/j.micres.2019.06.003. [DOI] [PubMed] [Google Scholar]
- 22.Gaunt MW, Yeo M, Frame IA, Stothard JR, Carrasco HJ, Taylor MC, Mena SS, Veazey P, Miles GAJ, Acosta N, de Arias AR, Miles MA. 2003. Mechanism of genetic exchange in American trypanosomes. Nature 421:936–939. doi: 10.1038/nature01438. [DOI] [PubMed] [Google Scholar]
- 23.Lemieux JE, Tran AD, Freimark L, Schaffner SF, Goethert H, Andersen KG, Bazner S, Li A, McGrath G, Sloan L, Vannier E, Milner D, Pritt B, Rosenberg E, Telford S, Bailey JA, Sabeti PC. 2016. A global map of genetic diversity in Babesia microti reveals strong population structure and identifies variants associated with clinical relapse. Nat Microbiol 1:16079. [DOI] [PMC free article] [PubMed] [Google Scholar]
- 24.Sevilla E, González LM, Luque D, Gray J, Montero E. 2018. Kinetics of the invasion and egress processes of Babesia divergens, observed by time-lapse video microscopy. Sci Rep 8:14116. doi: 10.1038/s41598-018-32349-7. [DOI] [PMC free article] [PubMed] [Google Scholar]
- 25.Russell BC, Torralba A, Murphy KP, Freeman WT. 2008. LabelMe: a database and web-based tool for image annotation. Int J Comput Vis 77:157–173. doi: 10.1007/s11263-007-0090-8. [DOI] [Google Scholar]
- 26.Abadi M, Barham P, Chen J, Chen Z, Davis A, Dean J, Devin M, Ghemawat S, Irving G, Isard M, Kudlur M, Levenberg J, Monga R, Moore S, Murray DG, Steiner B, Tucker PA, Vasudevan V, Warden P, Wicke M, Yu Y, Zheng X. 2016. TensorFlow: a system for large-scale machine learning, p 265–283. In Proceedings of the USENIX Symposium on Operating Systems Design and Implementation. OSDI, Savannah, GA, USA. [Google Scholar]
Associated Data
This section collects any data citations, data availability statements, or supplementary materials included in this article.
Data Availability Statement
The codes and data sets that support the findings of this study are available on https://github.com/jiangdat/GFS-ExtremeNet.


