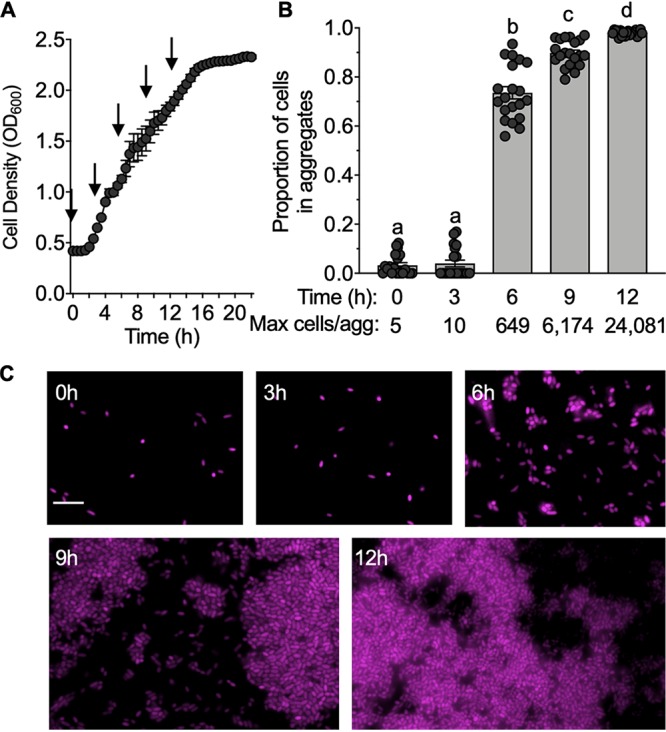
FIG 5.

Aggregate formation occurs by 6 h. (A) Growth curve of RFP-tagged ES401 incubated in high-viscosity liquid medium for 22 h. Arrows indicate the time points when the cultures were examined for the presence of aggregates using fluorescence microscopy. Growth curves were performed three times, with the results of one representative experiment being shown (n = 4). (B) Proportion of cells from each time point that were associated with aggregates (three or more cells touching). Letters indicate significantly different values between time points (one-way ANOVA, P < 0.001). The proportion of cells in aggregates was calculated for two experiments, and combined data are shown (n = 20). (C) Representative fluorescence microscopy images of ES401 from the growth curve shown in panel A. Bar = 5 μm. Error bars indicate standard errors.
