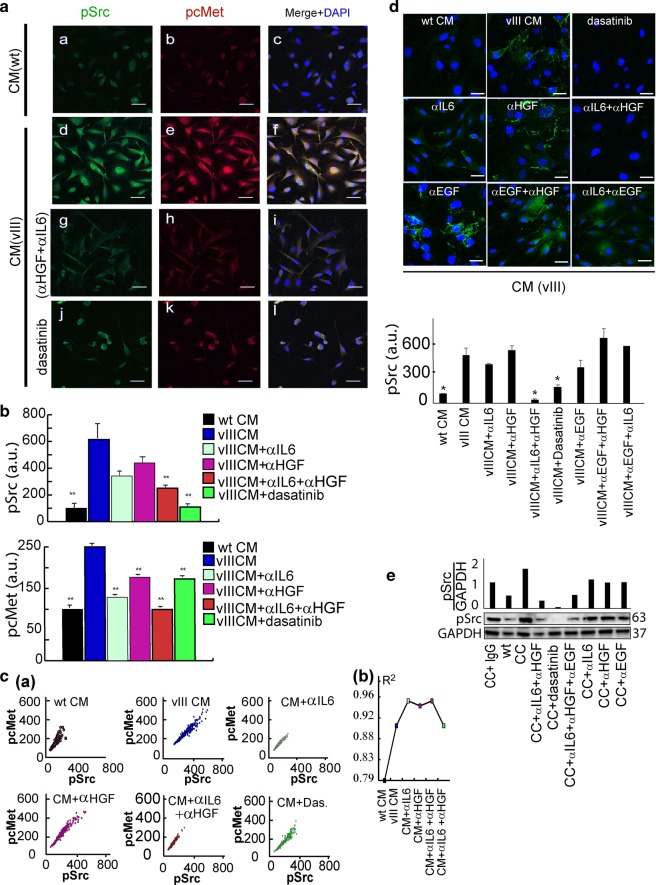
Fig. 8. Src activation in EGFRwt cells is mediated via HGF and IL6 secreted from EGFRvIII cells.
a U87EGFRwt cells were treated for 4 h with: CM of U87EGFRwt CM (WT) (a–c); CM of U87EGFRvIII (vIII, d–f); CM of U87EGFRvIII + 0.5 μg/ml (IL6 and HGF) neutralizing antibodies (αIL6 + αHGF) (g–i); or 200 nM dasatinib (j–l). Cells were incubated with antibodies against pSrc and pcMet and imaged using secondary antibodies conjugated to Alexa 488 (green) and Cy3 (red) dyes. DNA was stained with dapi. ×40 lens; Scale bar represent 50 μm. b Mean intensities of pSrc (n = 46–70 cells/condition) and pcMet (n = 191–310 cells/condition) were calculated from ~10–13 fields using the NIS-Elements software (Nikon); *P < 0.05 and **P < 0.005. P values representing the significance of the results as compared to U87EGFRvIII CM (vIII). Error bars represent SE. c Correlation plots (panel a) between pSrc and pcMet were generated for each indicated condition to test co-activation. At least 190 cells were used to generate the plots. R2 was calculated for each graph (panel b). (d, upper panel) U87EGFRwt cells were stimulated with U87EGFRvIII CM, (CM (vIII), excluding the left upper image where the cells were stimulated with U87EGFRwt CM, CM (WT)) and treated with 200 nM dasatinib or different neutralizing antibodies (α) (including 0.5 μg/ml αIL6, 0.5 μg/ml αHGF, 0.5 μg/ml αEGF) for 2 h and then fixed for immunofluorescence against pSrc (Alexa 488, green). Cell nuclei were stained with Dapi. Scale bars represent 50 μm. (×40 lens). (d, lower panel) Mean intensity of Src activation was quantified for about 180 cells (~13 fields per each condition). P values, representing the significance of the difference in pSrc intensity between each treatment and U87EGFRvIII CM, are *P < 0.01. e U87EGFRwt (WT) cells were co-cultured with 10% U87EGFRvIII, and treated with 0.5 μg/ml αIL-6, 0.5 μg/ml αEGF, 0.5 μg/ml αHGF or 200 nM of dasatinib for 4 h. pSrc levels were examined using Western blot. Quantification of pSrc/GAPDH is shown (upper panel).

