Abstract
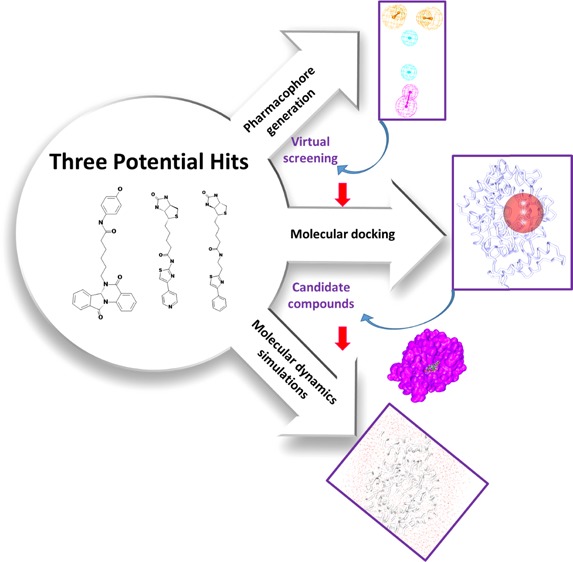
Progeria is a globally noticed rare genetic disorder manifested by premature aging with no effective treatment. Under these circumstances, farnesyltransferase inhibitors (FTIs) are marked as promising drug candidates. Correspondingly, a pharmacophore model was generated exploiting the features of lonafarnib. The selected pharmacophore model was allowed to screen the InterBioScreen natural compound database to retrieve the potential lead candidates. A series of filtering steps were applied to assess the drug-likeness of the compounds. The obtained compounds were advanced to molecular docking employing the CDOCKER module available with Discovery Studio (DS). Subsequently, three compounds (Hits) have displayed a higher dock score and demonstrated key residue interactions with stable molecular dynamics simulation results compared to the reference compound. Taken together, we therefore put forth three identified Hits as FTIs that may further serve as chemical spaces in designing new compounds.
Introduction
Progeria is a rare genetic disease noticed in children characterized by premature aging that predominantly affects the skin, bones, and cardiovascular system.1 This syndrome affects one in 4–8 million births2 noticed throughout the world with no gender or ethnic biasness.2 The post-translational modifications observed in progerin were thought to demonstrate a predominant role in pathophysiology of the disease.3 The protein progerin is defined as a partially cleaved form of nuclear lamin A that is associated with the dysfunctional nuclear membrane and premature senescence.4 The Hutchinson–Gilford progeria syndrome (also called progeria) is a result of a dominant point mutation triggered in the nuclear lamin A gene that encodes major protein in exon 11 (C to T transition noticed at nucleotide 1824) leading to a silent mutation resulting in Gly608 → Gly608.4 The so formed mutant exhibits a new splicing donor site responsible for the formation of mutant lamin A protein termed progerin. Structurally, progerin is devoid of a proteolytic cleavage site essential for the elimination of the last 18 carboxyl-terminal amino acids to generate mature lamin A.4 Progerin accumulation within the nuclei leads to the disruption of the nuclear structure, thereby causing premature replicative senescence.5 Under such conditions, the farnesyltransferase inhibitors (FTIs) have proven to be of great potential against progeria.6
Farnesyltransferase inhibitors (FTIs) are small molecules that can bind reversibly to farnesyltransferase at the (cysteine–aliphatic amino acid–aliphatic amino acid–any amino acid) CAAX binding site, correspondingly hindering progerin farnesylation and intercalation into the membrane of the nucleus,7,8 thereby improving the cardiovascular and skeletal pathologies and weight gain.2,9 Lonafarnib, one of the FTIs that is widely used to treat progeria, has reached the clinical trials8,10 (https://clinicaltrials.gov/ct2/show/NCT00425607). Initially developed to treat cancer,11 they typically act by reversing the nuclear abnormalities12,13 that are hallmark characteristics associated with progeria-affected children.
Encouraged by the beneficial effects of FTIs, there is a dire need to identify new drugs with similar abilities. Accordingly, in the current study, we focused on virtual screening for new chemical compounds that might have potential against progeria using the pharmacophore method. In order to redeem the potential candidate compounds, the compound lonafarnib was considered. Since lonafarnib has exhibited encouraging results toward progeria, the current research intends to find small molecules that demonstrate the pharmacophore features (chemical features) that are manifested by lonafarnib. In this pursuit, the investigation has proceeded by generating a pharmacophore model employing the small molecule lonafarnib. The obtained model was escalated to screen the chemical database to retrieve the compounds that map with the pharmacophore features. A typical model incorporates a few features arranged in 3D form14 and should compose a repeated denominator of the molecular interaction features existing in a group of molecules. Thus, pharmacophore is defined as a pattern of features of a molecule that is responsible for a biological effect.14 Such pharmacophore models are upgraded to screen the small molecule chemical databases to obtain the compounds complementary to the pharmacophore features.15 When a small molecule fits into the pharmacophore spheres, they are termed Hits.14 The obtained Hits will be allowed to dock with the specific protein target to delineate the interactions between them at the atomic level16 and to predict the binding mode of the small molecules.17,18 The best poses from the molecular docking studies are thoroughly studied by molecular dynamics simulation studies to elucidate on the motions of atoms and molecules.19 The obtained results are read as root mean square deviation (RMSD), potential energy, radius of gyration (Rg), and the hydrogen bond number as described earlier.20
Results and Discussion
Pharmacophore Generation
Prior to the generation of the pharmacophore model, the investigation has proceeded to identify the key features of the compound lonafarnib by initiating the Feature Mapping protocol available with the DS. This protocol has prompted 43 features. From the obtained results, it was evident that the features such as hydrogen bond donor (HBD), hydrophobic (HyP), and aromatic ring (RA) were identified as the repeated features. Utilizing the lonafarnib, the auto pharmacophore was generated, which resulted in 10 pharmacophore models with the same features such as HyP, HBD, and RA when the minimum interfeature distance was chosen as 2.5 and maximum features as 5. Subsequently, the first model was chosen as it demonstrated two RA, two HyP, and one HBD feature as illustrated in Figure 1.
Figure 1.
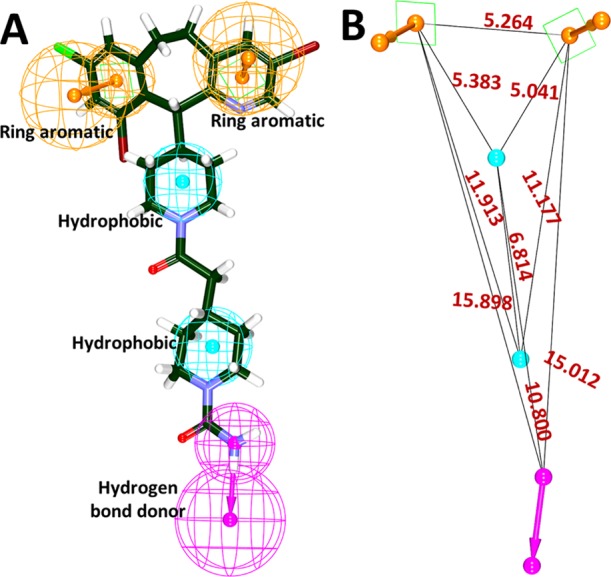
Generation of pharmacophore model exploiting lonafarnib. (A) Key features demonstrated by lonafarnib. (B) Interfeature distance between the features.
Virtual Screening for Redeeming Prospective Candidate Compounds
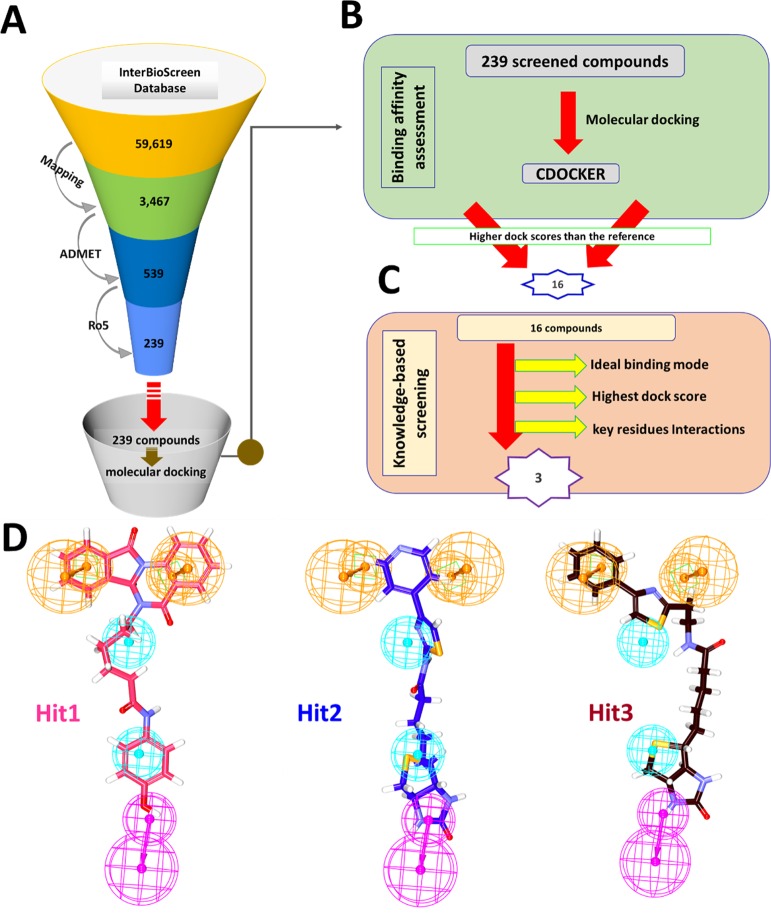
In order to retrieve the potential candidate compounds from the InterBioScreen natural compound database, the pharmacophore model has been used as the 3D query. This database comprises approximately around 59619 compounds. Upon applying the Ligand Pharmacophore Mapping, 3467 compounds were retrieved. These compounds were subjected to the ADMET filters and Ro5, eventually procuring 239 compounds. The obtained compounds were upgraded to molecular docking studies to evaluate the binding affinities between the target protein and the ligands (Figure 2A).
Figure 2.
Schematic representation for the identification of potential compounds. (A) Virtual screening process. (B) Binding affinity assessment. (C) Knowledge-based screening. (D) Compounds demonstrating the pharmacophore features.
Molecular Docking Studies
Molecular docking studies impart knowledge on the behavior of the small molecules at the active site of the protein. For the current study, the virtually screened compounds were docked against the target protein along with the reference compound lonafarnib. Molecular docking results have demonstrated a -CDOCKER interaction energy of 39.27 kcal/mol for lonafarnib. Therefore, this score was set as an upper limit to select the prospective drug-like candidates. Accordingly, 16 compounds from the largest cluster have shown a higher dock score than the reference compound and were labeled as Hits (active drug-like compounds) (Figure 2B). These compounds were then scrupulously examined for the key residue interactions that resulted in three compounds (Figure 2C). These compounds were additionally noticed to be seated in the active site as was seen with the reference compound and the cocrystallized compound. Furthermore, these compounds have displayed the essential pharmacophore features required for activity (Figure 2D). These compounds have generated better binding energies.
Molecular Dynamics Simulation Studies
Molecular dynamics simulation logically demonstrates the conformational and molecular behavior at atomistic levels and their movements, functions, and enzyme mechanisms at the molecular level21 to additionally infer the stabilities of the final complex compounds employed as initial structures for simulations conducted for 20 ns.
Conformational Stability Analysis from MD Insight
For the current investigation, MD guided stability analysis was executed and read according to RMSD profiles, potential energy, and Rg.
Examining the Root Mean Square Deviation (RMSD)
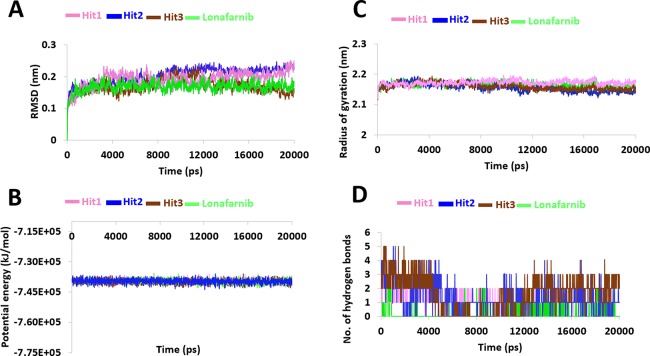
The RMSD imparts knowledge on the stability of the protein backbone. The results have demonstrated that the systems were largely stable throughout the 20 ns simulation run without major variations (Figure 3A). All the systems have projected an RMSD below 0.3 nm determining their stability. Upon calculating the average deviation plot, it was found that the reference has demonstrated an RMSD of 0.18 nm, with marginal elevation at 15000 ps. The compound Hit1 has represented a stable RMSD existing below 0.25 nm with no significant variations. However, the plot was stable after 5000 ps displaying an average RMSD of 0.16 nm as noticed with the reference compound (Figure 3A). The Hit2 has denoted a stable RMSD below 0.25 nm with an average of 0.19 nm. A negligible rise in the RMSD graph was noticed at 6000 ps and was stable thereafter without any fluctuations (Figure 3A). The compound Hit3 has displayed an RMSD below 0.24 nm, with an average of 0.16 nm. Scrupulously analyzing the RMSD profile of Hit3, an elevation was noted between 8000 and 12000 ps representing a deviation at 0.22 nm. However, a stable deviation profile below 0.2 nm was observed from 12000 to 20000 ps (Figure 3A). The three Hits have revealed a close stability as was seen with the reference compound, with Hit3 seeming to project much better backbone stability than the reference (Figure 3A).
Figure 3.
MD simulation analysis during 20 ns run. (A) Root mean square deviations of all the four systems are stable during the entire simulation. (B) Potential energy profiles. (C) Radius of gyration to estimate the compactness. (D) Enumerating the number of hydrogen bonds.
Studying the Potential Energy Profiles
The stability of the system was additionally analyzed by the potential energy profiles. Contemplating on the potential energies of all the systems, it was found to be stable between −7.30 × 10⁵ and −7.45 × 10⁵ kJ/mol as described in Figure 3B. The potential energy of the reference compound was computed to be at −7.34 × 10⁵ to −7.42 × 10⁵ kJ/mol. The compound Hit1 has shown a stable potential energy between −7.37 × 10⁵ and −7.42 × 10⁵ kJ/mol. The potential energy for compound Hit2 was recorded to be between −7.31 × 10⁵ and −7.35 × 10⁵ kJ/mol, and Hit3 represented the energy between −7.30 × 10⁵ and −7.35 × 10⁵ kJ/mol. These results guide us to understand that the systems were stable upon comparison with the reference (Figure 3B).
Inspecting the Radius of Gyration
Additionally, Rg was investigated that imparts knowledge on the compactness of the protein.22 All the systems have exhibited Rg scores between 2.1 and 2.2 nm. The average Rg value for the reference was calculated as 2.16 nm when plotted against time. The Hit1 has displayed an Rg score of 2.15 nm, while Hit2 and Hit3 have projected values of 2.14 and 2.15 nm, respectively. These results demonstrate that the Hits are highly compact compared to the reference compound, as illustrated in Figure 3C.
Examining the Binding Mode of the Hits
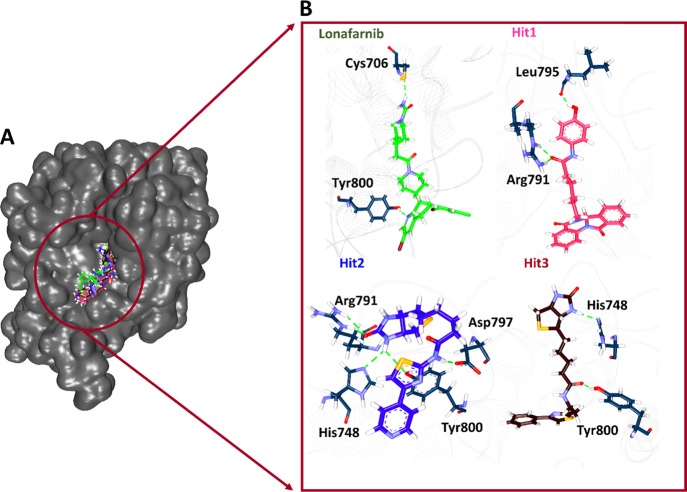
Upon thorough investigating the accomodation of the identified Hits at the active site of the protein, it was observed that the Hits have occupied the active site in the same pattern as that of the reference compound and the cocrystallized ligand (Figure 4A). This guides us to predict that the Hits might also act in a similar manner to the reference compounds complemented by the key residue interactions.
Figure 4.
Binding mode analysis guided from MD simulations. (A) Accomodation of Hit compounds at the protein active site. (B) Hydrogen bond interactions between the Hits and the protein.
Investigation for the Key Residue Interactions
Lonafarnib
Upon examining the intermolecular interactions, it was demonstrated that the compound lonafarnib has prompted two hydrogen bonds with the residues Cys706 [Cys706:SG-H66 (2.2 Å)] and Tyr800 [Tyr800:HH-N8 (2.0 Å)] rendered by an acceptable bond length. The residues Arg702 [Arg702-reference (5.0 Å) alkyl] and Trp803 [Trp803-reference (4.7 Å) π–alkyl] have prompted the alkyl and π–alkyl interactions. The residue His748 has generated two [His748-reference (4.9 Å) π–alkyl and His748 -reference:Br (4.4 Å) π–alkyl] π–alkyl interactions with the reference compound. The residues Tyr200, Trp602, Ala651, Met693, Tyr705, Gly750, Tyr751, Cys754, Arg791, Asp797, Cys799, Asp852, Lys853, and Tyr861 have interacted with the target protein by van der Waals interactions accomodating the ligand to be held at the active site firmly (Figure 4B and Table 1).
Table 1. Comprehensive Interactions between the Protein and the Hits.
| name | hydrogen bond interactions | π–π/π–alkyl interactions | π–sulfur interactions | van der Waals interactions | -CDOCKER interaction energy (kcal/mol) | binding energy (kcal/mol) |
|---|---|---|---|---|---|---|
| lonafarnib | Cys706, Tyr800 | Arg702, His748, Trp803 | Tyr200, Trp602, Ala651, Met693, Tyr705, Gly750, Tyr751, Cys754, Arg791, Asp797, Cys799, Asp852, Lys853, Tyr861 | 39.27 | –18.51 | |
| Hit1 | Arg791, Leu795 | Lys794, Trp803 | Cys754 | Lys164, Tyr200, Trp602, Trp606, Tyr654, Tyr705, Gly750, Phe753, Gln789, Gly790, Val796, Tyr800 | 50.99 | –107.47 |
| Hit2 | His748, Arg791, Asp797, Tyr800 | Tyr800, Trp803 | Cys799 | Tyr166, Gly750, Gly790, Lys794, Leu795, Val796, Gln789, Asp852, Lys853, Lys856, Tyr861 | 45.74 | –76.91 |
| Hit3 | His748, Tyr800 | Tyr654, Arg702, Cys754 | Trp803 | Lys 164, Trp602, Ala651, Met693, Tyr705, Cys706, Gly750, Phe753, Arg791 | 40.92 | –81.14 |
Hit1
The compound Hit1 has generated hydrogen bond interactions with the residues Arg791 and Leu795 [Leu795:O-H47 (1.8 Å)]. Arg791 has projected two hydrogen bonds such as Arg791:HE-O14 (2.0 Å) and Arg791:HH21-O14 (1.7 Å). Furthermore, the residues Lys794 [Lys794-Hit1 (4.2 Å) π–alkyl], and Trp803 [Trp803-Hit1 (4.2 Å) π–π T stacked] have formed π–π/π–alkyl interactions. The residue Cys754 has additionally generated π–sulfur interactions [Cys754:SG-Hit1 (4.6 Å) π–sulfur]. The residues Lys164, Tyr200, Trp602, Trp606, Tyr654,Tyr705, Gly750, Phe753, Gln789, Gly790, Val796, and Tyr800 have generated van der Waals interactions nestling the ligand at the active site (Figure 4B and Table 1).
Hit2
The Hit2 has formed hydrogen bonds with key residues such as His748 [His748:NE2-H31 (2.3 Å)], Asp797 [Asp797:OD1-H32 (1.8 Å)], and residue Tyr800 [Tyr800:OH-H31 (2.7 Å)]. The residue Arg791 has formed two hydrogen bonds [Arg791:HE-O16 (1.7 Å) and Arg791:HH21-O16 (2.2 Å)] with the ligand holding it firmly at the active site. The SG atom of the residue Cys799 has prompted two π–sulfur interactions with the ligand by lengths of 5.2 and 5.3 Å. The residue Tyr800 has formed two π–π stacked interactions with the ligand rendered by lengths of 5.7 and 5.9 Å. The S12 atom of the ligand has interacted with the residue Tyr800 via π–sulfur interaction with a length of 5.7 Å.The residue Trp803 has interacted with the ligand by a π–π T stacked interaction with a length of 5.6 Å. Additionally, the Tyr166, Gly750, Gly790, Lys794, Leu795, Val796, Gln789, Asp852, Lys853, Lys856, and Tyr861 have prompted the van der Waals interaction holding the ligand firmly at the active site (Figure 4B and Table 1).
Hit3
The compound Hit3 has generated two hydrogen bonds with the residues His748 [His748:NE2-H32 (2.0 Å)] and Tyr800 [Tyr800:HH-O18 (1.7) Å] demonstrating an acceptable bond length. Furthermore, the residues Tyr654 [Tyr654-Hit3 (5.2 Å) π–π stacked], Arg702 [Arg702-Hit3 (4.5 Å) π–alkyl], Cys754 [Cys754-Hit3 (4.9 Å) π–alkyl], and residue Trp803 [Trp803-Hit3 (4.3 Å) π–π stacked] have generated π–π/π–alkyl interactions. The residue Trp803 has generated two π–sulfur interactions with the S9 atom of the ligand with bond distances of 3.4 and 3.7 Å. The residues Lys 164, Trp602, Ala651, Met693, Tyr705, Cys706, Gly750, Phe753, and Arg791 have held the ligand by van der Waals interaction (Figure 4B and Table 1).
Discussion
Progeria is a rare genetic disorder predominantly characterized by premature aging. Of the different forms of progeria, the Hutchinson–Gilford progeria syndrome is the widely studied one and has obtained the name in honor of the scientists Jonathan Hutchinson (1886) and Hastings Gilford (1897), who independently studied the syndrome.2 A farnesyltranferase inhibitor, lonafarnib has demonstrated a good improvement in the conditions of the progeroid children by weight gain, ameliorating cardiovascular and skeletal pathologies.2 Therefore, this drug paves a way for discovering and identifying new candidate drugs with similar efficacies.
Computational drug discovery by virtue of pharmacophore modeling offers to redeem new candidate compounds displaying the key features represented by a pharmacophore model. Accordingly, the current study adapts to determine the key essential features imbibed by the “drug of hope”2 lonafarnib. Correspondingly, a five featured pharmacophore model was generated as represented in Figure 1 to secure the compounds upon virtual screening with the same features. Upon subjecting to virtual screening and subsequent computational methods, three compounds were identified that have exhibited the key pharmacophore features as in Figure 2.
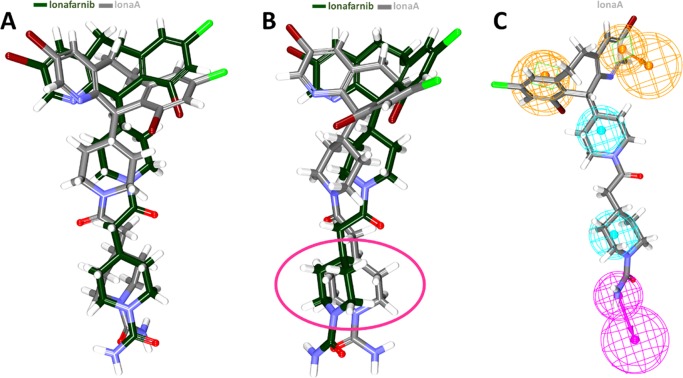
In order to ensure that the pharmacophore has retrieved the potential candidates, the bioactive conformation of the lonafarnib (herein after referred to as lonaA) was retrieved from the protein data bank bearing the PDB code 1O5M, from the organism Rattus norvegicus. Initially, the RMSD was analyzed between the lonaA and the lonafarnib by enabling the Calculate RMSD option furnished with the DS with all the default parameters. The result has shown that both compounds have aligned with each other rendered by an RMSD of 2 Å as described in Figure 5A. Although no difference was observed between compounds, a marginal difference was observed at the benzene as indicated in Figure 5B. The pharmacophore model was allowed to map with lonaA, and the results inferred that the pharmacophore model has well mapped with lonaA, as demonstrated in Figure 5C validating that the model was capable enough to retrieve the active compounds from a larger data set.
Figure 5.
Analogy between the bioactive form of lonafarnib and the retrieved compound. (A) Both compounds have aligned perfectly. (B) The marginal difference in the alignment was noticed as indicated in the pink oval. (C) The lonaA represents all the pharmacophore features.
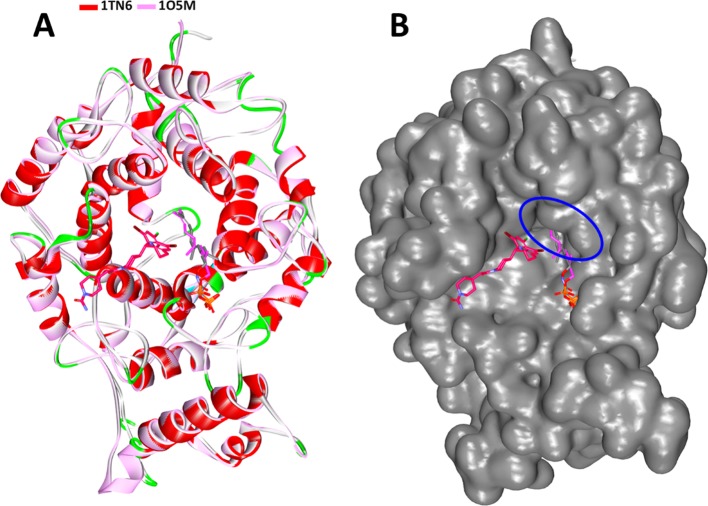
Furthermore, upon viewing at the targets, 1TN6 (current target employed in the study with FPP analog) and 1O5M, the protein containing the lonaA, some interesting observations can be drawn. Subsequent superimposition of both structures has revealed that the targets have aligned well with each other along with the FPP ligand of both target structures as in Figure 6A. Notably, the FPP was observed to be buried deep into the active site groove as described in Figure 6B, as compared with the lonaA. Therefore, we have chosen the target with an FPP analog as the cocrystal, logically to choose the compounds with lonafarnib chemical features that could interact well with the target residues. Likewise, the Hit compounds identified were noticed to occupy the FPP binding site gaining entry into the defined active site groove as described in Figure 4A. These findings guide us to comprehend that the identified Hits may act as potential FTIs.
Figure 6.
Superimposition of 1TN6 and 1O5M. (A) Both proteins align perfectly along with the FPP and the analog. (B) The small molecule FPP is buried into the active site groove, while the lonaA is at the peripheral of the binding pocket.
Upon considering the intermolecular interactions, it was observed that lonafarnib, Hit 2, and Hit3 have generated a hydrogen bond interaction with Tyr800 as was noticed in the crystal structure (https://www.rcsb.org/structure/1tn6). Another key residue, Arg791 has prompted a hydrogen bond interaction with Hit1 and Hit2 as was in the crystal structure; however, in lonafarnib and Hit3, it has demonstrated a van der Waals interaction. Interestingly, the Hits have prompted the π–sulfur interactions that was absent in the cocrystal and the reference compound. Further delineating the number of hydrogen bond, it was evident that the Hits have projected a higher number than the lonafarnib as in Figure 3D. The compound lonafarnib has generated an average of 0.2 hydrogen bonds, while the Hits have formed 1.2, 1.3, and 1.6, respectively. Additionally, the Hits have represented a higher number of π interactions and van der Waals interactions holding the ligand firmly at the active site of the protein. This result affirms that the identified Hits may act as alternative chemical spaces with a similar impact to lonafarnib.
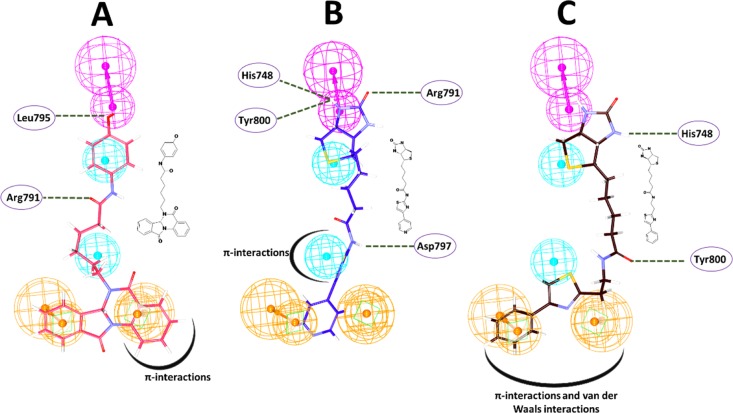
Furthermore, it was observed that the identified Hits have demonstrated a different scaffold from the reference while representing the key features of the pharmacophore model. Additionally, the Hits have projected different atoms such as oxygen atoms, nitrogen atoms, and sulfur atoms. Hit1 has demonstrated nitrogen and oxygen atoms. The HBD pharmacophore feature has resulted in one hydrogen bond with the residue Leu795, and the oxygen atoms present amidst two hydrophobic features have formed another hydrogen bond with the residue Arg791 (Figure 7A). In Hit2, the HBD feature has prompted three hydrogen bonds with the residues His748, Arg791, and Tyr800. Another hydrogen bond was formed with the residue Asp797 that is in proximity to the HyP feature (Figure 7B). Hit3 has formed two hydrogen bonds, one with the residue His748 that is complimentary to the HBD feature and Tyr800 that exists in close vicinity to the HyP feature (Figure 7C). Notably, the HBD features have participated in the interactions by hydrogen bonding involving the key residues with all the Hits, while the RA and HyP features have prompted either π–interactions or van der Waals interactions (Figure 7). Therefore, it can be speculated that these features might be essential features. These results guide us to understand that the Hits might act as prospective FTIs.
Figure 7.
Small molecule pharmacophore features complementary to interactions with various residues of the protein. (A) Interactions of Hit1. (B) Interactions of Hit2. (C) Interactions of Hit3. The hydrogen bond interactions are demonstrated by green dashed lines, and π and van der Waals interactions are depicted by thick black curves.
Conclusions
Progeria has been one of the dreadful syndromes noticed in children characterized by premature aging with no effective treatment until now. FTIs have been proven effective against progeria with lonafarnib entering the clinical trials. Therefore, in the current investigation, we tried to identify novel scaffolds that obey the pharmacophore features of lonafarnib. The molecular docking studies have identified three compounds that have demonstrated key residue interactions and have occupied the FPP analog binding site as was noticed in the crystal structure. From the obtained results, it can be stated that the identified compounds may act as potential agents against progeria and further may serve as new scaffolds in developing novel drugs.
Materials and Methods
Auto Pharmacophore Modeling
Lonafarnib is a well-known compound employed to treat progeria10,23 that might improve the neurologic conditions by correspondingly inhibiting farnesyltransferase. Therefore, the chemical features of this compound were exploited utilizing the Auto Pharmacophore Generation protocol accessible with the Discovery Studio v4.5 and v18 (DS). The Auto Pharmacophore Generation protocol is primarily used to generate the pharmacophore from a single ligand. Correspondingly, utilizing the inbuilt features such as Hydrogen bond acceptor (HBA), Hydrogen bond donor (HBD), Hydrophobic feature (HyP), Negative ionizable feature (ION), Positive ionizable feature (IOP), and Aromatic ring (RA), a set of prospective pharmacophore models were generated reflecting the aforementioned features. Furthermore, this module selects the pharmacophore with highest selectivity in accordance with the Genetic Function Approximation (GFA) model prediction.
Virtual Screening of the InterBioScreen Database To Retrieve the Potential Compounds
The pharmacophore model was used as a 3D query to retrieve the chemical compounds complementary to the pharmacophore features. Correspondingly, for the current investigation, a humongous InterBioScreen natural compound database was used. The pharmacophore model was allowed to map with the compounds enabling the Ligand Pharmacophore Mapping module equipped with the DS. The resultant compounds were subjected to drug-like assessment employing the ADMET Descriptors and Filter by Lipinski tools available with the DS. The compounds that have obeyed these criteria were upgraded to the molecular docking studies.
Molecular Docking Studies and Binding Energy Calculations
The obtained compounds from the virtual screening strategies were escalated to the molecular docking studies to evaluate the binding affinities between the protein and the obtained compounds and thereby to expel false positives.16 The molecular docking studies additionally define the predictive binding modes of the ligand at the protein active site. For the current investigation, the CDOCKER program available with the DS was utilized that operates on the CHARMm-based molecular docking method to dock ligands into a proteins binding site, thereby generating random ligand conformations upon using high-temperature molecular dynamics (MD).
The CDOCKER is a grid-based docking mechanism that operates by the CDOCKER algorithm,24 which allows the refined docking for a single protein target against a large number of ligands. During the molecular docking method, random conformations are generated for the initial ligand conformation by the high-temperature molecular dynamics, which was accompanied by the random rotations. Furthermore, the random rotations are further explored according to grid-based (GRID 1) simulated annealing. The molecular docking simulations were executed opting the simulated annealing as True while keeping the other options as default.
The protein for the current study is farnesyltransferase bearing a protein data bank (PDB) code of 1TN6 with a cocrystallized ligand FPP analog.25 The protein was prepared by the Clean protein option equipped in the DS after removing the water molecules and furnishing the missing hydrogen atoms using the CHARMm force field. The active site residues are marked for all the atoms at 10 Å around the inbound ligand. Correspondingly, the residues such as His748, Gly750, Cys754, Arg791, Lys794, Try800, and Trp803 were identified as key residues. The compounds obtained from the virtual screening were minimized and were imported to DS to generate their 3D structures. During the molecular docking studies, each ligand was allowed to generate 50 conformations that were clustered. The best pose was chosen from the largest cluster demonstrating the highest dock score compared to lonafarnib (drug in the clinical trials).
The binding free energies are calculated between the ligands and the receptor employing Calculate Binding Energies equipped in DS using the default settings. Furthermore, this parameter provides an opportunity to compute the average binding energy for a group of related poses and loss of conformational entropy and energy of a bound ligand.26 The binding energy is calculated using the following equation: EnergyBinding = EnergyComplex – EnergyLigand – EnergyReceptor.
Molecular Dynamics Simulation Studies
Molecular dynamics simulation studies were launched to elucidate the dynamic behavior of small molecules at protein active sites and were conducted as described earlier.27,28 In order to accomplish this, the GROMACS v5.0.6 package was employed with the CHARMm 27 force field29 obtaining the ligand topologies from SwissParam.30 A double level equilibration was conducted by utilizing a constant number of particles, volume, and temperature (NVT) and constant number of particles, pressure, and temperature (NPT), executed for 1 ns each with a V-rescale thermostat and Parrinello–Rahman barostat, correspondingly. The simulation run was conducted for 20 ns, and the obtained results were read as root mean square deviation (RMSD), potential energy, radius of gyration (Rg), and hydrogen bond analysis.
Acknowledgments
This research was supported by the Bio & Medical Technology Development Program of the NRF funded by the Korean government, MSIT (NRF-2018M3A9A7057263).
The authors declare no competing financial interest.
References
- Bhukya A. S.; Reddy B. S. N. Hutchinson-Gilford Progeria Syndrome. Indian Dermatol. Online J. 2015, 6, 438–440. 10.4103/2229-5178.169733. [DOI] [PMC free article] [PubMed] [Google Scholar]
- Sinha J. K.; Ghosh S.; Raghunath M. Progeria: A Rare Genetic Premature Ageing Disorder. Indian J. Med. Res. 2014, 667–674. [PMC free article] [PubMed] [Google Scholar]
- Gonzalo S.; Kreienkamp R.; Askjaer P. Hutchinson-Gilford Progeria Syndrome: A Premature Aging Disease Caused by LMNA Gene Mutations. Ageing Res. Rev. 2017, 18. 10.1016/j.arr.2016.06.007. [DOI] [PMC free article] [PubMed] [Google Scholar]
- Noda A.; Mishima S.; Hirai Y.; Hamasaki K.; Landes R. D.; Mitani H.; Haga K.; Kiyono T.; Nakamura N.; Kodama Y. Progerin, the Protein Responsible for the Hutchinson-Gilford Progeria Syndrome, Increases the Unrepaired DNA Damages Following Exposure to Ionizing Radiation. Genes Environ. 2015, 13. 10.1186/s41021-015-0018-4. [DOI] [PMC free article] [PubMed] [Google Scholar]
- Mehta I. S.; Bridger J. M.; Kill I. R. Progeria: The Nucleolus and Farnesyltransferase Inhibitors. Biochem. Soc. Trans. 2010, 38, 287. 10.1042/BST0380287. [DOI] [PubMed] [Google Scholar]
- Yang S. H.; Meta M.; Qiao X.; Frost D.; Bauch J.; Coffinier C.; Majumdar S.; Bergo M. O.; Young S. G.; Fong L. G. A Farnesyltransferase Inhibitor Improves Disease Phenotypes in Mice with a Hutchinson-Gilford Progeria Syndrome Mutation. J. Clin. Invest. 2006, 116, 2115–2121. 10.1172/JCI28968. [DOI] [PMC free article] [PubMed] [Google Scholar]
- Basso A. D.; Kirschmeier P.; Bishop W. R. Lipid Posttranslational Modifications. Farnesyl Transferase Inhibitors. J. Lipid Res. 2005, 15. 10.1194/jlr.R500012-JLR200. [DOI] [PubMed] [Google Scholar]
- Gordon L. B.; Kleinman M. E.; Massaro J.; D’Agostino R. B. Sr.; Shappell H.; Gerhard-Herman M.; Smoot L. B.; Gordon C. M.; Cleveland R. H.; Nazarian A.; et al. Clinical Trial of the Protein Farnesylation Inhibitors Lonafarnib, Pravastatin, and Zoledronic Acid in Children with Hutchinson-Gilford Progeria Syndrome. Circulation 2016, 134, 114–125. 10.1161/CIRCULATIONAHA.116.022188. [DOI] [PMC free article] [PubMed] [Google Scholar]
- Rampogu S.; Baek A.; Son M.; Zeb A.; Park C.; Kumar R.; Lee G.; Kim D.; Choi Y.; Cho Y.; et al. Computational Exploration for Lead Compounds That Can Reverse the Nuclear Morphology in Progeria. Biomed Res. Int. 2017, 2017, 1–15. 10.1155/2017/5270940. [DOI] [PMC free article] [PubMed] [Google Scholar]
- Gordon L. B.; Kleinman M. E.; Miller D. T.; Neuberg D. S.; Giobbie-Hurder A.; Gerhard-Herman M.; Smoot L. B.; Gordon C. M.; Cleveland R.; Snyder B. D.; et al. Proc. Natl. Acad. Sci. U. S. A. 2012, 109, 16666–16671. 10.1073/pnas.1202529109. [DOI] [PMC free article] [PubMed] [Google Scholar]
- Harhouri K.; Frankel D.; Bartoli C.; Roll P.; De Sandre-Giovannoli A.; Lévy N. An Overview of Treatment Strategies for Hutchinson-Gilford Progeria Syndrome. Nucleus 2018, 9, 265–276. 10.1080/19491034.2018.1460045. [DOI] [PMC free article] [PubMed] [Google Scholar]
- Reddy S.; Comai L. Lamin A, Farnesylation and Aging. Exp. Cell Res. 2012, 1. 10.1016/j.yexcr.2011.08.009. [DOI] [PMC free article] [PubMed] [Google Scholar]
- Capell B. C.; Erdos M. R.; Madigan J. P.; Fiordalisi J. J.; Varga R.; Conneely K. N.; Gordon L. B.; Der C. J.; Cox A. D.; Collins F. S. Inhibiting Farnesylation of Progerin Prevents the Characteristic Nuclear Blebbing of Hutchinson-Gilford Progeria Syndrome. Proc. Natl. Acad. Sci. U. S. A. 2005, 102, 12879–12884. 10.1073/pnas.0506001102. [DOI] [PMC free article] [PubMed] [Google Scholar]
- Qing X.; Lee X. Y.; De Raeymaeker J.; Tame J. R.; Zhang K. Y.; De Maeyer M.; Voet A. R. Pharmacophore Modeling: Advances, Limitations, And Current Utility in Drug Discovery. J. Recept., Ligand Channel Res. 2014, 81. 10.2147/JRLCR.S46843. [DOI] [Google Scholar]
- Tanwar G.; Mazumder A. G.; Bhardwaj V.; Kumari S.; Bharti R.; Yamini; Singh D.; Das P.; Purohit R. Target Identification, Screening and in Vivo Evaluation of Pyrrolone-Fused Benzosuberene Compounds against Human Epilepsy Using Zebrafish Model of Pentylenetetrazol-Induced Seizures. Sci. Rep. 2019, 7904. 10.1038/s41598-019-44264-6. [DOI] [PMC free article] [PubMed] [Google Scholar]
- Meng X.-Y.; Zhang H.-X.; Mezei M.; Cui M. Molecular Docking: A Powerful Approach for Structure-Based Drug Discovery. Curr. Comput.-Aided Drug Des. 2011, 146. 10.2174/157340911795677602. [DOI] [PMC free article] [PubMed] [Google Scholar]
- Morris G. M.; Lim-Wilby M. Molecular Docking. Methods Mol. Biol. 2008, 365. 10.1007/978-1-59745-177-2_19. [DOI] [PubMed] [Google Scholar]
- Tanwar G.; Purohit R. Gain of Native Conformation of Aurora A S155R Mutant by Small Molecules. J. Cell. Biochem. 2019, 11104. 10.1002/jcb.28387. [DOI] [PubMed] [Google Scholar]
- Rajendran V.; Gopalakrishnan C.; Sethumadhavan R. Pathological Role of a Point Mutation (T315I) in BCR-ABL1 Protein—A Computational Insight. J. Cell. Biochem. 2018, 918. 10.1002/jcb.26257. [DOI] [PubMed] [Google Scholar]
- Rajendran V. Structural Analysis of Oncogenic Mutation of Isocitrate Dehydrogenase 1. Mol. BioSyst. 2016, 2276. 10.1039/c6mb00182c. [DOI] [PubMed] [Google Scholar]
- Kumar R.; Bavi R.; Jo M. G.; Arulalapperumal V.; Baek A.; Rampogu S.; Kim M. O.; Lee K. W. New Compounds Identified through in Silico Approaches Reduce the α-Synuclein Expression by Inhibiting Prolyl Oligopeptidase in Vitro. Sci. Rep. 2017, 7, 10827. 10.1038/s41598-017-11302-0. [DOI] [PMC free article] [PubMed] [Google Scholar]
- Lobanov M. Y.; Bogatyreva N. S.; Galzitskaya O. V. Radius of Gyration as an Indicator of Protein Structure Compactness. Mol. Biol. 2008, 623–628. 10.1134/S0026893308040195. [DOI] [PubMed] [Google Scholar]
- Ullrich N. J.; Kieran M. W.; Miller D. T.; Gordon L. B.; Cho Y.-J.; Silvera V. M.; Giobbie-Hurder A.; Neuberg D.; Kleinman M. E. Neurologic Features of Hutchinson-Gilford Progeria Syndrome after Lonafarnib Treatment. Neurology 2013, 81, 427–430. 10.1212/WNL.0b013e31829d85c0. [DOI] [PMC free article] [PubMed] [Google Scholar]
- Wu G.; Robertson D. H.; Brooks C. L. III; Vieth M. Detailed Analysis of Grid-Based Molecular Docking: A Case Study of CDOCKER - A CHARMm-Based MD Docking Algorithm. J. Comput. Chem. 2003, 1549. 10.1002/jcc.10306. [DOI] [PubMed] [Google Scholar]
- Reid T. S.; Terry K. L.; Casey P. J.; Beese L. S. Crystallographic Analysis of CaaX Prenyltransferases Complexed with Substrates Defines Rules of Protein Substrate Selectivity. J. Mol. Biol. 2004, 343, 417–433. 10.1016/j.jmb.2004.08.056. [DOI] [PubMed] [Google Scholar]
- Tirado-Rives J.; Jorgensen W. L. Contribution of Conformer Focusing to the Uncertainty in Predicting Free Energies for Protein-Ligand Binding. J. Med. Chem. 2006, 5880. 10.1021/jm060763i. [DOI] [PubMed] [Google Scholar]
- Rampogu S.; Ravinder D.; Pawar S.; Lee K. Natural Compound Modulates the Cervical Cancer Microenvironment—A Pharmacophore Guided Molecular Modelling Approaches. J. Clin. Med. 2018, 551. 10.3390/jcm7120551. [DOI] [PMC free article] [PubMed] [Google Scholar]
- Rampogu S.; Baek A.; Gajula R. G.; Zeb A.; Bavi R. S.; Kumar R.; Kim Y.; Kwon Y. J.; Lee K. W. Ginger (Zingiber Officinale) Phytochemicals—gingerenone-A and Shogaol Inhibit SaHPPK: Molecular Docking, Molecular Dynamics Simulations and in Vitro Approaches. Ann. Clin. Microbiol. Antimicrob. 2018, 17, 16. 10.1186/s12941-018-0266-9. [DOI] [PMC free article] [PubMed] [Google Scholar]
- Van Der Spoel D.; Lindahl E.; Hess B.; Groenhof G.; Mark A. E.; Berendsen H. J. C. GROMACS: Fast, Flexible, and Free. J. Comput. Chem. 2005, 1701. 10.1002/jcc.20291. [DOI] [PubMed] [Google Scholar]
- Zoete V.; Cuendet M. A.; Grosdidier A.; Michielin O. SwissParam: A Fast Force Field Generation Tool for Small Organic Molecules. J. Comput. Chem. 2011, 32, 2359–2368. 10.1002/jcc.21816. [DOI] [PubMed] [Google Scholar]


