Abstract
We present a coupled left atrium‐mitral valve model based on computed tomography scans with fibre‐reinforced hyperelastic materials. Fluid‐structure interaction is realised by using an immersed boundary‐finite element framework. Effects of pathological conditions, eg, mitral valve regurgitation and atrial fibrillation, and geometric and structural variations, namely, uniform vs non‐uniform atrial wall thickness and rule‐based vs atlas‐based fibre architectures, on the system are investigated. We show that in the case of atrial fibrillation, pulmonary venous flow reversal at late diastole disappears, and the filling waves at the left atrial appendage orifice during systole have reduced magnitude. In the case of mitral regurgitation, a higher atrial pressure and disturbed flows are seen, especially during systole, when a large regurgitant jet can be found with the suppressed pulmonary venous flow. We also show that both the rule‐based and atlas‐based fibre defining methods lead to similar flow fields and atrial wall deformations. However, the changes in wall thickness from non‐uniform to uniform tend to underestimate the atrial deformation. Using a uniform but thickened wall also lowers the overall strain level. The flow velocity within the left atrial appendage, which is important in terms of appendage thrombosis, increases with the thickness of the left atrial wall. Energy analysis shows that the kinetic and dissipation energies of the flow within the left atrium are altered differently by atrial fibrillation and mitral valve regurgitation, providing a useful indication of the atrial performance in pathological situations.
Keywords: atrial fibrillation, fibre‐reinforced hyperelastic material, fibre structure, fluid‐structure interaction, left atrial appendage, left atrium, mitral regurgitation, mitral valve
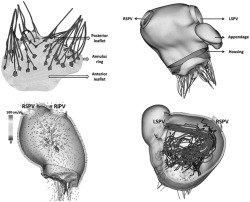
We present a coupled left atrium‐mitral valve model based on computed tomography scans with fibre‐reinforced hyperelastic materials. Fluid‐structure interaction is realised by using an immersed boundary‐finite element framework. Effects of pathological conditions, eg, mitral valve regurgitation and atrial fibrillation, and geometric and structural variations, namely, uniform vs non‐uniform atrial wall thickness and rule‐based vs atlas‐based fibre architectures, on the system are investigated.
1. INTRODUCTION
The left atrium (LA) is a complex important chamber in the human heart. It consists of four components: septum, appendage, vestibule, and venous components.1 The septum is the shared wall between the left and right atrium, and left atrial appendage (LAA) is the tubular structure near the left pulmonary veins that connects to the LA main chamber and serves as a decompression chamber when the atrial pressure is elevated.2 The vestibule resembles the thin circumferential wall that connects the mitral valve (MV), a valvular structure that ensures the unidirectional flow from left atrium to left ventricle (LV). The majority of LA is the venous components that are connected to the pulmonary veins. Typically, there are four veins: the left superior and inferior pulmonary veins (LSPV/LIPV) and the right superior and inferior pulmonary veins (RSPV/RIPV). During the cardiac cycle, the LA receives oxygenated blood from the pulmonary veins during ventricular systole and acts as a reservoir; in early diastole, the LA serves as a conduit that allows blood to passively flow into the left ventricle; in late diastole, the LA contracts and pumps blood into the LV through the mitral valve. LA function can be described through stroke volume, conduit volume, and LA emptying volume, in which the conduit volume represents the blood flowing through LA during diastole and LA emptying volume is the LA cavity volume difference between end diastole and end systole.
LA mechanical dysfunction, for instance, in the presence of atrial fibrillation (AF), which causes an abnormal heart rhythm, can lead to reduced cardiac output,3, 4 thrombus formation,5, 6, 7 and higher stroke risk.8 Additionally, AF causes LA structural remodelling including atrial fibrosis,9 the thickening of LA wall,10, 11 and reduced atrial wall compliance.12 However, the effects of such wall thickness changes on the atrial haemodynamics have not yet been fully elucidated. On the other hand, LA function is also greatly affected by the MV through blood flow and fluid‐structure interaction (FSI). For example, in the case of mitral valve regurgitation (MVR), patients are found to have increased LA deformation and reduced contractile contribution13 and also atrial fibrillation.14
With the development of medical imaging techniques, methods such as transesophageal echocardiography (TEE), magnetic resonance imaging (MRI) 4D flow analysis, and tissue Doppler imaging (TDI) have been widely used to study the LA function under normal and pathological conditions.15, 16, 17 In addition, the LA function evaluation can also be achieved via multiphysics modelling which provides insights of the abnormal tissue behaviour such as atrial remodelling, the relation between large strain and development of fibrosis, and flow details that are important for improving surgical procedures.18, 19 Computational models with fluid structure interaction enable us to study both LA mechanical behaviour and haemodynamics under controlled conditions.20, 21, 22 More importantly, they provide tools for isolating the effects of different physiological and anatomical changes that occur under pathological conditions and for studying their impact on the link between LA and MV function.
To date, only limited progress has been made23, 24, 25, 26, 27, 28, 29, 30, 31 in multi‐physics modelling of the LA. This is a reflection of the complex anatomy and physiology of the LA. For example, LA has a complex myofibre structure composed of dominant muscle bundles that have different orientations across the LA wall,1, 32 such as the Bachmann's, Septopulmonary, and Septoatrial bundles. Therefore, it requires significant amount of work to define a physiologically detailed fibre structure for atrial material modelling. In addition, the LA is a thin‐walled structure with non‐uniform wall thickness.10 It is difficult to obtain accurate patient‐specific thickness measurements for LA geometry reconstruction. As a result, one simplification often made in LA modelling is the uniform wall thickness.33, 34
So far, few computational models have included detailed LA fibre models, and, consequently, the control of LA wall motion is often prescribed instead of driven by FSI. For instance, Menghini et al23 used an idealised LA geometry with prescribed wall motion and flow boundary conditions to study the fluid dynamics inside the LA. Koizumi et al24 applied controlled wall motion on patient specific LA geometries to study the haemodynamic changes in the case of AF. Besides the challenges mentioned in developing the LA‐only models, it is also important to include a physiologically realistic MV structure for a better understanding of the LA‐MV interaction and left heart function,35, 36, 37 especially in the case of MV dysfunction.38, 39, 40 However, due to the complex MV structure, researchers tend to use simplified outflow boundary condition to approximate the MV function. For instance, in the LA model developed by Koizumi et al,24 MV was assumed to open and close instantly, ignoring the leaflets motion. Similarly, Masci et al26 treated MV as an on/off switch in their fluid dynamics model of the LA. On the other hand, some effort has been made to explore the importance of the complex MV geometry in the case of mitral regurgitation, without involving a detailed LA model. For example, in the work by Einstein et al,35 a comprehensive strategy was proposed for a predictive analysis of mitral regurgitation with a Lagrangian segregated scheme for fluid‐structure interactions. Toma et al41 developed a patient‐specific mitral valve model with FSI and analysed the chordae rupture. They found that the MV coaptation line enclosed area depends on the ruptured chordae diameter, its location, and relationship with surrounding chordae. Caballero et al42 also investigated the effect of chordae rupture on left heart dynamics and found that the structure and strength of the regurgitant jet varies depending on the location and severity of the leaflets prolapse caused by the rupture.
The aim of the current study is to investigate how LA function varies under pathological conditions (eg, AF and MVR) and to study the effects of variations in geometric parameters, such as fibre structure and wall thickness, on the overall LA performance. To this purpose, we present a FSI model with an imaged‐based LA geometry and fibre structure, coupled with an MV model43 that includes physiologically realistic leaflets and chordae tendineae. The FSI analysis is implemented within an immersed boundary finite element framework (IB/FE),44 where the structures are modelled using hyperelastic constitutive laws. To our best knowledge, this is the first imaged‐based hyperelastic LA‐MV model with FSI that is used to study AF and MVR. A physiologically realistic LA model adapted from the previous work by Fastl et al27 is used in the current study. The LA model incorporates detailed fibre structures defined by an atlas‐based method,27 and it is then coupled to a MV model developed in the previous work.43 Investigations into LA function are then made under normal and pathological conditions using the coupled LA‐MV model. Furthermore, it is also used to study the effect of geometric variations (fibre structure and wall thickness) on the LA function.
The remainder of paper is organized as follows: Details of IB/FE method for FSI is described in Section 2. Structure model properties are discussed in Section 3. Implementation details and numerical results are presented in Sections 4 and 5. Finally, a discussion of the results is provided in Section 6.
2. METHODOLOGY
2.1. IB/FE formulation
The IB/FE formulation of FSI in this study follows the approach described in the work by Griffith and Luo,44 in which the deformation and elasticity of the structure are described in Lagrangian form, and the velocity, pressure, and incompressibility are described in Eulerian form. Let denote the fixed physical domain occupied by the coupled fluid‐structure system and correspond to the initial Lagrangian domain for the structure. x∈ are fixed Cartesian physical coordinates, are the Lagrangian reference coordinates of the structure, and is the current position of material point X at time t. Thus, the region occupied by structure at time t is , and is the region occupied by the fluid at time t.
The governing equations for the coupled fluid‐structure system are
| (1) |
| (2) |
| (3) |
| (4) |
| (5) |
with V(X) an arbitrary Lagrangian test function. Equation (1) is the momentum equation for the coupled system. ρ and μ are the material density and dynamic viscosity. p(x,t) and u(x,t) are the material pressure and velocity. f(x,t) represents the Eulerian force density in that is induced by structure deformation. Equation (2) is the incompressibility constraint in Eulerian form. Equations (3) and (5) are interaction equations between the Lagrangian and Eulerian coordinates, and the three‐dimensional Dirac delta function δ(x) is used here to transfer data between the two frames. F(X,t) represents the Lagrangian force density in the finite element space obtained by the projection of the first Piola‐Kirchhoff stress tensor through (4). Equation (5) implies the no‐slip condition in the fluid‐structure interface.
2.2. Energy analysis
We focus on two types of energy change, the kinetic energy (KE)
| (6) |
and the rate of energy dissipation (D)
| (7) |
where LA chamber is the flow region inside the LA chamber.
2.3. Spatial and temporal discretization
We use a Cartesian grid to discretize the Eulerian domain with a staggered grid for the Eulerian velocity u=(u x,u y,u z), pressure p(x,t), and force density f=(f x,f y,f z). Finite difference approximations are used for the divergence, gradient, and Laplace operators with second‐order accuracy.45 The nonlinear advection terms in Equation (1) are discretized using a version of piecewise parabolic method (PPM).46 The Lagrangian domain is discretized using finite element approach with a trilinear basis function for the displacement and Lagrangian force density F(X,t). For more details of the discretization, readers are referred to Griffith and Luo.44
3. MODEL GEOMETRY AND MATERIAL PROPERTIES
3.1. LA and MV geometry
The LA geometry used in the current study is based on one of recently published LA geometry dataset,27 which was collected from a 35‐year‐old male patient with hyperlipidemia who underwent a clinically indicated coronary computed tomography angiography (CTA).27 The coronary CTA images were first segmented in Seg3D , then smoothed via a combined smoothing and upsampling algorithm to obtain sufficient spatial resolution for computational finite element mesh generation. The Octree‐based mesh generation software Tarantula (CAE Software Solutions, Eggenburg, Austria) was used to generate the tetrahedral LA mesh.
In the original dataset,27 the total number of mesh elements is 121 207 799, and the total number of mesh nodes is 21 868 400 , which is overly fine for the purpose of our mechanical modelling. Therefore, the reduction of mesh density is needed and achieved via CGAL and TetGen (Weierstrass Institute for Applied Analysis and Stochastics, Berlin, Germany). Figure 1 shows the coarsened LA mesh with 92 590 elements and 28 808 nodes, following a grid‐independence test. Table 1 summarizes the geometric features for the LA geometry.
Figure 1.
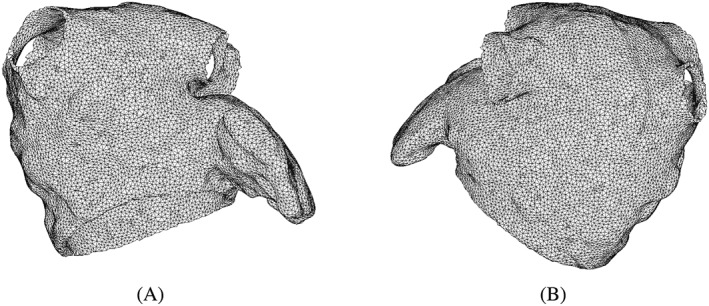
The finite element mesh of the LA model at (A) anterior view and (B) posterior view
Table 1.
LA geometry information
| LA Geometry | |
|---|---|
| LA main chamber volume | 107.3 mL |
| LA appendage volume | 12.6 mL |
| Wall thickness | 1.5 mm (average, non‐uniform) |
| RSPV orifice area | 2.5 cm2 |
| RIPV orifice area | 2.0 cm2 |
| LSPV orifice area | 1.8 cm2 |
| LIPV orifice area | 2.5 cm2 |
| Appendage orifice area | 4.6 cm2 |
Abbreviations: LIPV, left inferior pulmonary vein; LSPV, left superior pulmonary vein; RIPV, right inferior pulmonary vein; RSPV, right superior pulmonary vein.
The LA has complex fibre architecture composed of dominant muscle bundles with different orientations across the wall. Therefore, it requires significant amount of work to define a physiologically detailed fibre structure for the material model. In the current study, two fibre structures are compared. The first fibre structure is based on the work by Fastl et al,47 who used an atlas‐based method for the atrial fibre construction in their original dataset. In brief, an average atrial geometry, generated by the combination of 30 MRI datasets with 122 predefined landmarks, is constructed first and then used to transfer landmarks to the end‐ and epicardial surface on personalized atrial geometry. Next, 272 auxiliary lines were computed by the landmarks and subdivide atrial surface into 151 atrial regions in which the surface fibre orientations were determined. Finally, the fibre orientations for tetrahedral elements were computed via transmural interpolation. Following the aforementioned mesh density reduction, the fibre orientations are directly mapped from the original dataset to the coarsened LA mesh by a nearest neighbour approach, shown in Figure 2A,B.
Figure 2.
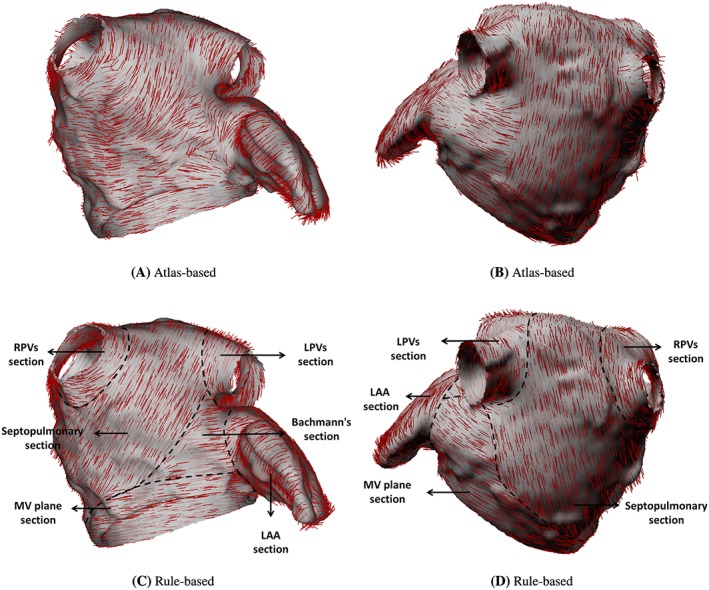
Fibre structures of the LA model from anterior (left) and posterior (right) views
The second fibre structure is defined using a rule‐based method similar to the study of Ferrer et al47 but with fewer atrial regions. The LA is divided into six sections as shown in Figure 2C,D, and described below:
the left pulmonary veins (LPVs) section: circumferentially distributed fibres around the LSPV and LIPV;
the right pulmonary veins (RPVs) section: circumferentially distributed fibres around RSPV and RIPV;
the septopulmonary section: fibre structures mainly included in the septopulmonary muscle bundle which arises from the anterosuperior septal raphe, runs obliquely to superior wall and then back to atrial septum;
the bachmann's section: circumferentially distributed fibres on anterior wall, and gradually blending into the circular fibres parallel to the MV annulus.
the LAA section: circumferentially distributed fibres around the appendage central axis; and
the MV plane section: circumferentially distributed fibres parallel to the MV annulus plane.
It should be mentioned that the current rule‐based method does not include transmural fibre change. However, it captures the major characteristics of LA muscle bundles. For example, at the epicardial aspect, the behaviour of Bachmann's bundle as well as the septopulmonary bundle are included in septopulmonary and Bachmann's sections. At the endocardial aspect, even though the septoatrial bundle, which originates from the anterior interatrial raphe and blends with the septopulmonary bundle on the LA superior roof and circumferential fibres on the lateral and posterior walls, is not explicitly defined, the major pattern is included in septopulmonary and MV plane section. More details of the atrial fibre morphology and the ruled‐based method are provided in Appendix A.
The MV model is based on the work by Wang et al,48 and the MV geometry is reconstructed from multi‐slice computed tomography (MSCT) scans of a normal mitral valve at mid‐diastole from a 61‐year‐old male patient. It contains detailed leaflets, chordae geometry, and fibre structure, shown in Figure 3A. Details of the MV model can be found in our previous work.43, 48 A rigid housing structure is then used to connect the LA and MV geometries as shown in Figure 3B. Further details of the LA and MV model connection are provided in Appendix B.
Figure 3.
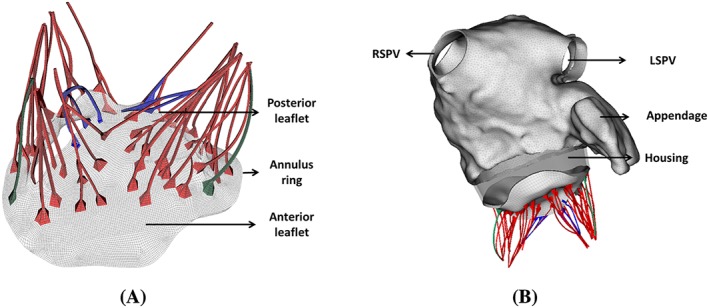
MV geometry (left) and coupled LA‐MV model with a rigid housing (right). Strut chordae are colored in red, marginal chordae are colored in blue, and basal chordae are colored in green
3.2. Material properties
Constitutive models for the MV model and their parameter values are taken to be the same as in our previous work.43 To model the passive material response of LA wall, we use an invariant‐based, transversely isotropic constitutive model
| (8) |
in which , , with being the deformation gradient and . Fibre deformations are described through , and the fibre orientation e at the reference state is shown in Figure 2. In particular, the fibres are defined only to support extension, so compressed fibres do not contribute to the strain energy function. The last term in the energy, , acts to penalize compressible deformations.49 We choose β=500 kPa. a=8.0 kPa, b=5.57, a 1=6.0 kPa, and b 1=4.06. Due to the lack of experimental data, these parameters have been tuned, based on the ventricular myocardium,50 to produce physiologically realistic cardiac output in the LA.
Similar to the previous approach,51 we define the modified elastic stress tensor via
| (9) |
The term is included to ensure is zero when .
To account for the active contraction at late diastole initiated by the LA wall, we add a simplified active stress tensor to the overall elastic stress tensor similar to Wang et al,53
| (10) |
in which
| (11) |
where active is the time‐varying isometric tension as shown in Figure 4, γ = 4.9 from Niederer et al,52 and is the fibre stretch ratio.
Figure 4.
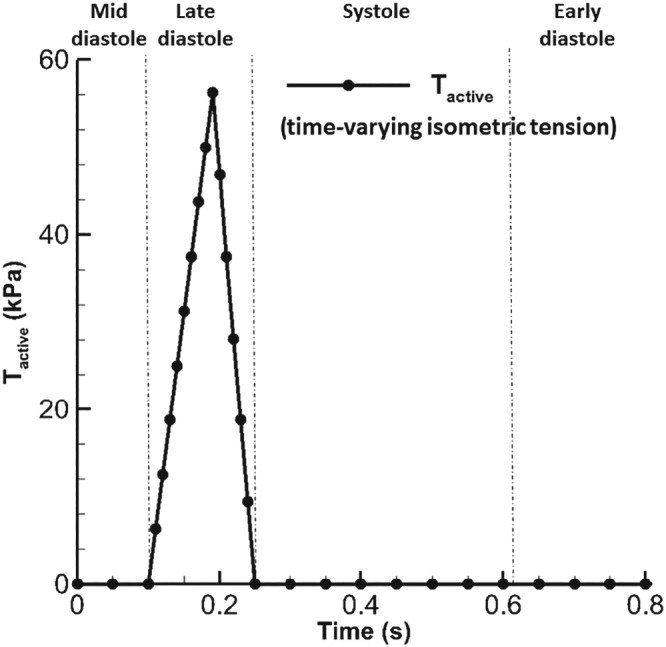
The profile of Tactive with a maximum value52 of 56.2 kPa
4. DYNAMIC LA‐MV MODEL IMPLEMENTATION
The coupled LA‐MV model is immersed in a viscous fluid with density 1 g·cm−3 and dynamic viscosity 0.04 g·cm−1·s−1. The computational domain has the size of 23.6 cm × 21.0 cm × 20.8 cm. Four PVs and the LV are represented by rigid tubes to mount the LA‐MV model on the domain boundaries where pressure boundary conditions are applied as shown in Figure 5. The coupled LA‐MV system undergoes a 0.1‐second initialization phase followed by several cardiac cycles. After the second cycle, the results are converged to a steady stage. Hence, the results from the second cardiac cycle are presented.
Figure 5.
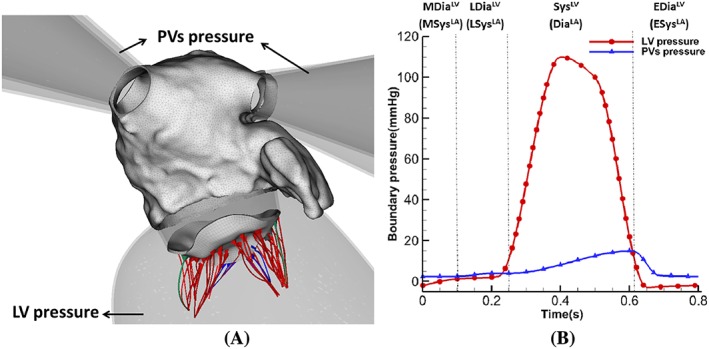
(A) Coupled LA‐MV model mounted on rigid PVs and LV tube. (B) The applied pressure profiles with four phases: systole (SysLV), early diastole (EDiaLV), mid diastole (MDiaLV), and late diastole (LDiaLV) based on left ventricular dynamics. Or diastole (DiaLA), early systole (ESysLA), mid systole (MSysLA), and late systole (LSysLA) based on left atrial dynamics
In the current MV model, there are 10 chordal origins representing the locations at papillary muscles. Similar to the work by Wang et al,48 each origin is applied with a time‐dependent displacement boundary condition to mimic the movement of papillary muscle, which is based on the CT scans at mid diastole and mid systole. The MV annulus, however, remains fixed during the simulation. For the LA geometries, the structural mesh element size is around 0.1 cm for the edge length. For the fluid mesh, two‐level block‐structured adaptively refined grid with a refinement ratio 4 between levels is used, and the mesh size is 0.13 cm × 0.13 cm × 0.13 cm. An explicit scheme is used to solve the IB/FE system, and a small time step size of 0.01 ms is chosen to ensure stability and numerical convergence.
To study various factors affecting LA biomechanical function, we consider the following six cases:
The normal case, denoted as (LAOriginal) : parameters and boundary conditions for the LA and the MV are adjusted to produce normal LA cardiac output. The LA contains atlas‐based fibre structure.
The atrial fibrillation (AF) case (LAAF): derived from LAOriginal without active contraction by setting Tactive=0, and the MV functions normally. This is to mimic the extreme situation of atrial fibrillation when the LA wall can not contract at all and used to investigate the effect of a lack of atrial kick at end‐diastole in the case of atrial fibrillation.24 The occurrence of high‐frequency fibrillation of atrial wall is not included here.
The mitral valve regurgitation (MVR) case (LAMVR): derived from LAOriginal by moving the chordae origins towards LA to cause MV leaflets collapse and regurgitant flow during systole. This case will be used to study the influences of MV regurgitation on the LA function.
The rule‐based fibre case (LAS RB): derived from LAOriginal, the only difference is that the fibre structure is generated using the rule‐based method. This case will allow us to investigate the impact of different fibre structures on LA dynamics.
The uniform wall thickness case (LAS 1.5): derived from LAOriginal, but with a uniform wall thickness of 1.5 mm which is the averaged wall thickness of the original LA geometry, others are kept the same as LAOriginal. This will allow us to study the effect of wall thickness uniformity on LA dynamics.
The thickened wall case (LAS 2.2): also derived from LAOriginal but with a uniform wall thickness of 2.2 mm, about 50% thicker than LAS 1.5 which could represent LA wall thickening in the case of atrial fibrillation.54
The IB/FE framework used in the current study is implemented in the open‐source IBAMR software . IBAMR is an adaptive and distributed‐memory parallel implementation of the immersed boundary method leveraging several open‐source computational frameworks, including SAMRAI , PETSc , libMesh , and hypre to perform core functionality. All simulations are performed at the School of Mathematics and Statistics at the University of Glasgow using Linux servers with Intel Xeon E5‐2660 v3 2.60 GHz CPUs and 128 GB RAM. A typical simulation of one cardiac cycle using 28 processors takes about 9 days in wall‐clock time.
5. RESULTS
5.1. Normal and pathological LA models
In this section, LA functions under pathological conditions are analysed among LAOriginal, LAAF, and LAMVR. Table 2 summarizes the stroke volume, the conduit volume, LA emptying volume, and the MV regurgitant volume in one cardiac cycle, where the stroke volume is obtained via the sum of the other three volumes. LAOriginal has the largest stroke volume and conduit volume, which are in the healthy range (stroke volume: 95 mL ± 14 mL55; conduit volume: 42.6 mL ± 14.6 mL56). Compared with LAOriginal, LAAF has smaller stroke volume with increased conduit volume and much reduced LA emptying volume, which can be explained by the absence of active contraction in late‐diastole. However, for LAMVR, it has much higher regurgitation volume due to the prolapse of the MV leaflets, which also leads to a much larger LA emptying volume during systole than LAOriginal.
Table 2.
Cardiac output in models
| Stroke Volume, mL | Conduit Volume, mL | LA Emptying Volume, mL | Regurgitant Volume, mL | |
|---|---|---|---|---|
| LAOriginal | 98.5 | 46.5 | 58.0 | 6.0 |
| LAAF | 85.1 | 64.1 | 28.1 | 7.1 |
| LAMVR | 91.5 | 47.9 | 81.7 | 38.1 |
Figure 6A,B shows the pressure inside the LA and averaged maximum principal strain ( ) at the LA wall. During systole, a sharp peak (known as the v‐wave) appears in the LA pressure for LAMVR because of the regurgitant flow. However, the pressure in LAAF has a pronounced early systolic wave (known as the c‐wave, resulting from MV closure). The peak of the v‐wave is 14.5 mmHg (LAoriginal) and 14.1 mmHg (LAAF), much lower than in LAMVR (46.0 mmHg). In diastole, LAMVR appears to be in line with the normal case, but the a‐wave (caused by the atrial contraction at end diastole) has disappeared in LAAF because it lacks active contraction. Similar trends are seen in the maximum principal strain curves, a much higher strain value can be found in LAMVR in systole compared with the other two cases.
Figure 6.
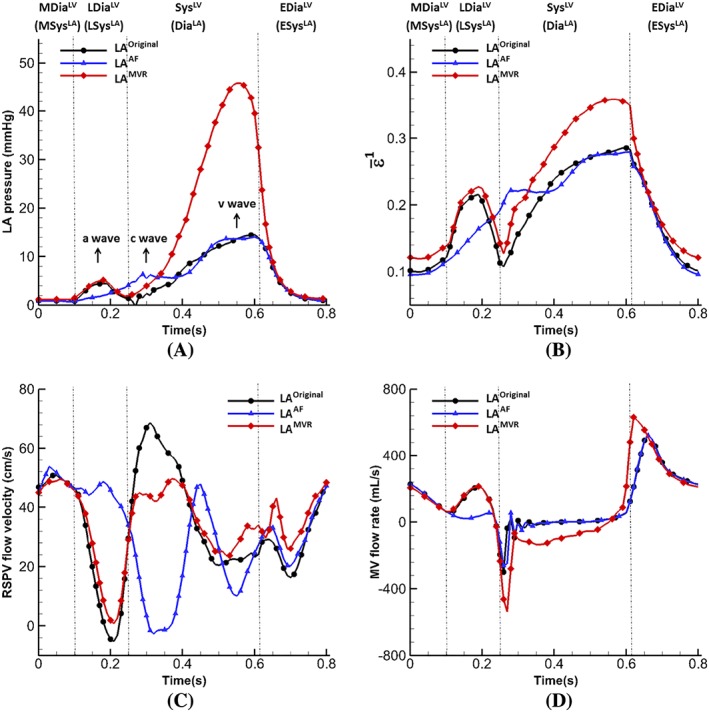
Comparison of results of the normal, AF and MVR cases: (A) pressure inside the LA main chamber, and (B) the averaged maximum principal strain , (C) Flow velocity at right superior pulmonary vein orifice, and (D) Flow velocity at MV leaflet free edges during diastole
Figure 6 C is the mean blood velocity profile at RSPV. In general, RSPV velocities are similar for both the normal and MVR cases, except at early‐systole due to the large MV regurgitation into the LA cavity, which restricts the filling flow from RSPV in the MVR case. More substantial difference in the RSPV flow is seen in the AF case, especially from mid‐diastole to end‐systole. No regurgitation occurs in the AF case at RSPV at late‐diastole, and the filling in early‐systole is much smaller because the LA has already been passively stretched, as shown in Figure 6B. Figure 6D is the flow near the MV leaflet free edges for the three cases, again, large difference for the AF case can be found in late‐diastole compared to the normal case, and a very high regurgitant flow during systole in the MVR case as expected.
Figure 7 shows the distribution of the maximum principle strain ε 1 on the LA wall at end‐systole. All three cases have similar strain patterns, but the MVR case has much higher strain level. It is also associated with a substantial enlarged LA cavity (end‐systole cavity: 187.2 mL (LAOriginal) vs 186.6 mL (LAAF) vs 204.5 mL (LAMVR)). Figure 8 shows the distribution of (ε 1) on the MV itself at mid‐systole. A small gap can be found for both the normal and AF cases. In the present immersed boundary formulation, the gap will remain when the valve is closed and loaded because of the regularized delta function in the Lagrangian‐Eulerian coupling operators. The size of this gap is determined by the amount of regularization, which in the present methodology is tied to the background Eulerian grid spacing. Despite this gap, the valve is hydraulically closed, in that it is able to support an adverse pressure difference without leak. And both cases have similar strain patterns, ie, higher at the two trigon areas of the anterior leaflet and the commissure area of the posterior leaflet. This observation agrees with previous studies.43, 59, 60, 61 However, in the MVR case, both leaflets collapse towards the atrium side as shown in Figure 8C,F, and ε 1 at the trigons (average value) are higher than other two cases as listed in Table 3.
Figure 7.
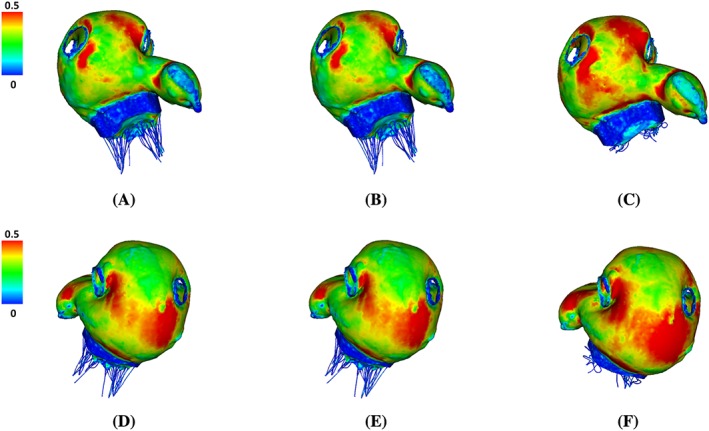
Distribution of the maximum principal strain (ε 1) at end‐systole (t=0.61 s) for LAOriginal (A,D), LAAF (B,E) , and LAMVR (C,F). Top row: anterior view. Bottom row: posterior view
Figure 8.
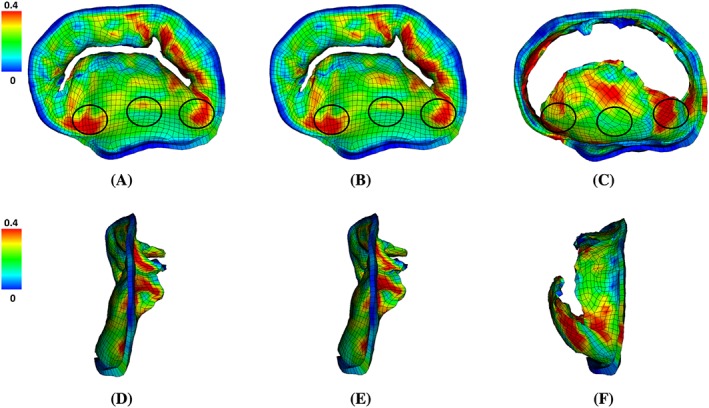
The maximum principal strain distributions on the MV at mid‐systole (t=0.4 s) in (A,D) LAOriginal, (B,E) LAAF and (C,F) LAMVR. Top row: front view (from atrium side). Bottom row: side view (atrium to the left). The belly of anterior leaflet and the two trigon areas with higher strains are circled
Table 3.
Maximum principal strain (averaged) on MV anterior leaflet together with published experimental data
| Case | Anterior Belly | Trigon (Left) | Trigon (Right) |
|---|---|---|---|
| LAOriginal | 0.21 | 0.29 | 0.28 |
| LAAF | 0.20 | 0.29 | 0.28 |
| LAMVR | 0.19 | 0.32 | 0.27 |
| Jimenez et al57 | 0.22 ± 0.07r | ||
| Sacks et al58 | 0.16 ± 0.20r |
Note. The superscript r indicates the radial direction.
Figure 9A‐C shows flow vectors inside the LA at early‐systole. High filling flows at the pulmonary veins can be found in the normal case and to a lesser degree in the MVR case. No clear filling pattern is shown in the AF case because of the elevated LA pressure at late‐diastole due to the lack of active emptying process. As expected, a regurgitant jet towards the LA posterior wall can be found in the MVR case as shown in Figure 9C, which substantially affected the filling process. Figure 9D‐F shows the streamlines at early‐systole starting from the LSPV and RSPV orifices. A clear clockwise vortex inside the LA main chamber is seen in the normal case from the LA posterior view. However, when regurgitation occurs, due to the disturbance caused by the regurgitated jet, the clockwise vortex is very weak (Figure 9F).
Figure 9.
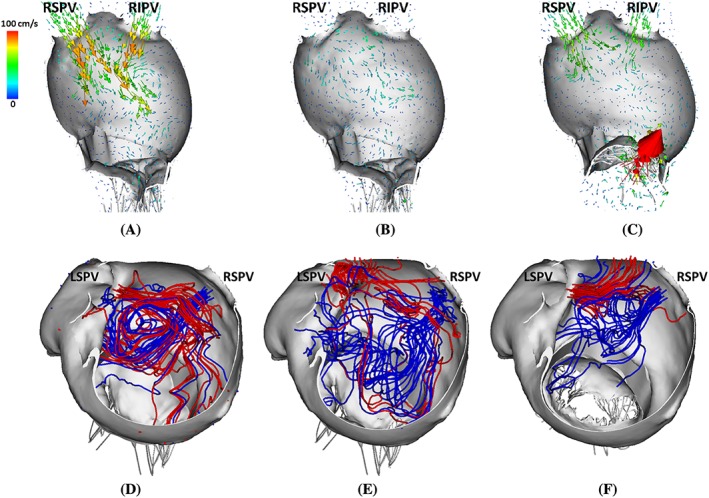
Upper panel: side view of flow fields inside LA at early systole (t=0.35 s) for LAOriginal (A), LAAF (B), and LAMVR (C). Lower panel: top view of streamlines with seeds near LSPV (red) and RSPV (blue) at early‐systole (t=0.35 s) for LAOriginal (D), LAAF (E), and LAMVR (F)
More quantitative information is given in Figure 10A, which plots the flow velocity at the LAA orifice during one cardiac cycle. During early diastole, there is an emptying flow wave in all three cases, followed by a late‐diastole peak resulted from the LAA active contraction for the normal and MVR cases but not in the AF case. Consequently at the beginning of systole, a large filling wave only appears in the normal and MVR cases (with peak values −15.1 cm/s and −20.7 cm/s, respectively).
Figure 10.
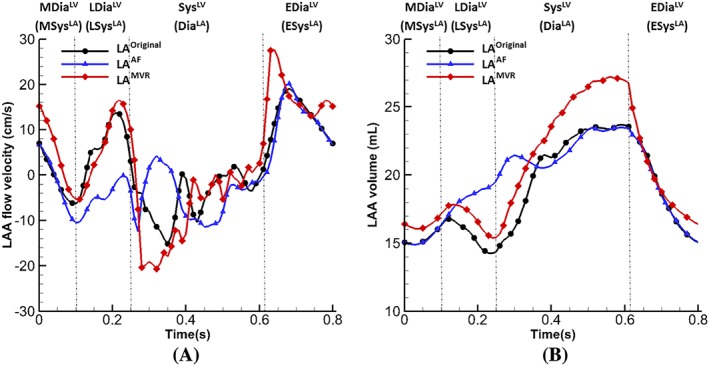
(A) Flow velocities at the left atrium appendage orifice and (B) left atrium appendage volume from cases of LAOriginal, LAAF and LAMVR
Figure 10B shows the LA appendage volume change in the three cases. There is no volume reduction at late‐diastole in the AF case and a substantial enlargement during systole in the MVR case. In order to quantitatively measure the effect of the LAA flow velocity to the flow inside LAA, we calculate the LAA fluid residence time (FRT) as follows: First, the fluid pathlines are generated with seeds at the LAA orifice, starting from the early ventricular systole when the first LAA filling wave occurs and ending at mid diastole when the first LAA emptying wave finishes. Then, the fluid particles that manage to exit from LAA are selected and the average time they stay inside the LAA is defined as the FRT.
The FRT in the MVR case (0.394 s) is less than that in the normal case (0.423 s), and the AF case has the largest FRT value (0.470 s) indicating that blood entering the LAA during systole stays much longer in the LAA compared with other two cases.
The performance of the pathological cases can be better represented by the energy budget analysis. Figure 11 plots the total flow kinetic energy (KE) and dissipation rates (D) inside the LA. The MVR case has the highest kinetic energy and dissipation rates at systole compared with other two cases, which suggests the after‐load of the LV is increased and a part of the LV work is used to overcome this rather than pumping the blood. On the contrary, the AF case has the lowest levels of kinetic energy and dissipation rate without peaks at systole, indicating an extremely inefficient filling function.
Figure 11.
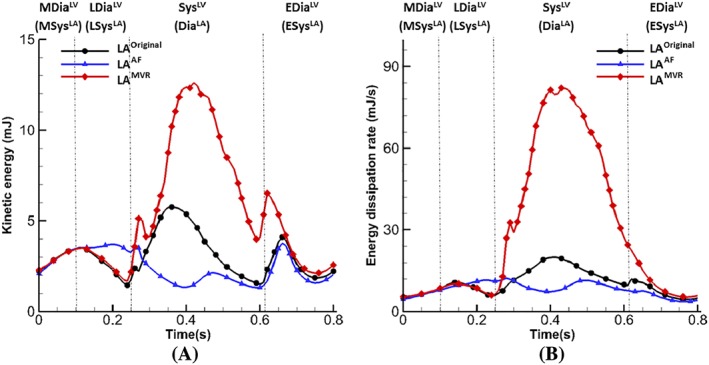
Energy budget analysis. (A) Kinetic energy of flow inside the LA and (B) energy dissipation rate of flow, integrated within the LA
In summary, in the absence of atrial kick at end‐diastole as in LAAF, the filling process is greatly impaired (stroke volume reduced 15.8%). As a result, the LA pressure at early‐systole is elevated, the PV filling flows are suppressed, and the blood residential time is longer than the normal case (0.470 s vs 0.424 s) which may suggest a higher risk of blood stagnation (77.6% vs 27.5% of LAA region with flow velocity less than 10 cm/s at early‐systole), hence thrombus formation. In the case of MV regurgitation as in LAMVR, the LA cavity is substantially enlarged with much increased LA pressure and the first principle strain during systole. The MV regurgitant jet further disturbs the PV filling flow inside LA, which also results in a higher level of energy dissipation compared to the normal case LAOriginal. However, the regurgitant jet flow in LAMVR seems to help wash out the residual fluid inside the LAA during systole.
5.2. Effects of modelling variations
In this section, we compare the LA function with varied features, including atlas‐based (LAOriginal) vs rule‐based fibre structures (LAs RB), and non‐uniform (LAOriginal) vs different uniform wall thickness (1.5 mm—LAs 1.5, or 2.2 mm—LAs 2.2). Figure 12 shows the maximum principal stress distributions on the LA wall at end‐systole for these different modelling variations. Figure 12A,B shows that the varied fibre‐structure has a moderate effect on the LA stress distribution. However, the impact of the uniform thickness is more substantial. The stress in LAs 1.5 (Figure 12C) is much lower compared with the original LA model (LAOriginal) even though the uniform thickness is equivalent to the average thickness of LAOriginal. With further increased wall thickness in LAs 2.2, the maximum principal stress has the lowest levels as shown in Figure 12D.
Figure 12.
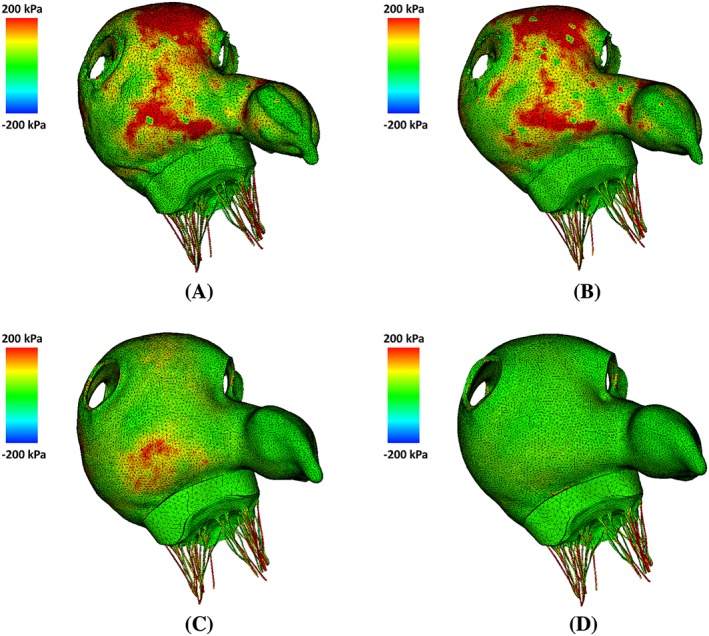
The maximum principal stress distributions at end‐systole (t=0.61 s) for (A) LAOriginal, (B) LAS RB, (C) LAS 1.5, and (D) LAS 2.2 in the anterior view
The information revealed in Figure 12 is more clearly presented in Figure 13. Figure 13A plots the overall averaged fibre strain on atrial walls. The models with uniform wall thickness markedly underestimate the value of fibre strain compared to LAOriginal. Figure 13B is the venous flow velocity at the RSPV orifice, LAs 2.2 has the largest regurgitation at late‐diastole (t=0.19 s) and higher flow velocity at the LAA orifice at late‐diastole (t=0.21 s) and early‐systole (t=0.33 s) as shown in Figure 13C. The flow rates at the MV orifice are similar, although the one for LAs 2.2 is slightly higher (Figure 13D) at late‐diastole. The FRTs inside the LAA are similar in all three cases LAs RB (0.402 s), LAs 1.5 (0.405 s), and LAs 2.2 (0.408 s).
Figure 13.
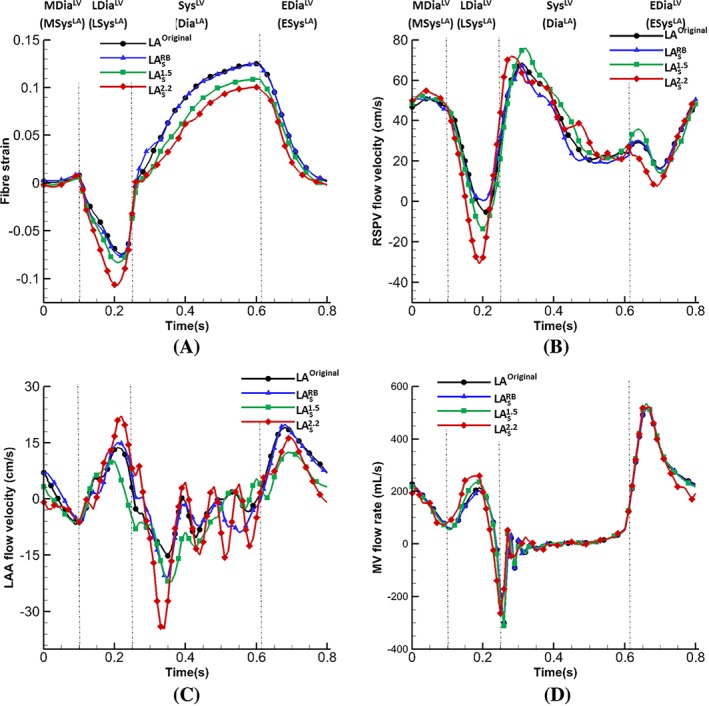
Comparisons of average atrial fibre strain (A), and flow velocity at the (B) right superior pulmonary vein orifice, (C) left atrium appendage orifice, and (D) the flow rate across the MV
6. DISCUSSION
This paper presents a FSI model of left atrium with physiologically realistic geometry and fibre structure, combined with a previously developed mitral valve model with detailed leaflets and chordae tendineae.43 The combined model is used to study both the structure mechanical behaviour and haemodynamics under different conditions. Compared with previous LA modelling work, several advances have been made in the current study: (a) a realistic MV model is coupled to the LA, and this is the first time that such a model is included in LA modelling and analysed within a FSI framework; (b) effects of atrial fibrillation and MV regurgitation on overall LA performance are analysed in detail; and (c) effects of wall thickness and fibre structures on LA dynamics are studied.
As a closely related structure to LA, MV plays an important role in the LA function. In the current work, we show that with a three‐dimensional MV model, more realistic interaction between LA and MV can be captured, especially in the case of MV dysfunction. For example, because of the regurgitation in systole, LAMVR suffers an excessive enlargement in LA cavity during systole with significantly higher pressure, shown in Figure 6A,B, compared with the cases with complete MV closure. Similar findings are also reported by Kihara et al,62 in which LA experiences enlargement in size and mass as well as increased mean pressure in the case of mitral regurgitation. Furthermore, the flow vortex seen in normal LA function (Figure 9) disappears because of the strong regurgitant jet. And the flow rate cross the MV during diastole also shows different behaviours in the case of AF and MVR, shown in Figure 6D, which could potentially have strong impact on the LV pump function. Because the model uses a rigid housing for LA‐MV connection, the simulations do not account for the dynamics of the MV annulus, including its shape change and longitudinal movement. We plan to study the impact of annular dynamics on the transmitral flow patterns and overall energetics in future work.
Previously, the LA wall‐blood interaction had not been studied in detail: a common practice in literature is to prescribe the wall motion with a focus on LA haemodynamics .23, 24, 25, 26 In our model, a full FSI analysis is performed using an immersed boundary method with finite element elasticity.43, 44, 51, 60, 63 Incorporating nonlinear hyperelastic anisotropic material models to the immersed boundary framework we are able to investigate how wall thickness and fibre structure affect LA function. Our results suggest that from a haemodynamics perspective, the simplified rule‐based fibre structure without transmural fibre orientation provides a good approximation for the detailed atlas‐based fibre structure with transmural fibre orientation, because both lead to similar LA flow pattern and wall deformation shown in Figures 12 and 13. Therefore, such simplified atrial fibre defining method may be used in the fluid‐structure interaction modelling of LA to reduce the model complexity. However, it has to be pointed out that we have not considered electrophysiology (EP) in the current model, and previous work has suggested the LA function can be more sensitive to fibre structure when including EP.47, 64 Another key geometric factor in the LA modelling is the wall thickness. LA has non‐uniform wall thickness1 where the posterior wall and superior wall are in general thicker than other regions. As detailed LA geometry construction requires high quality medical images, some models are based on uniform wall thickness.33, 34 Our results show that non‐uniform and uniform wall thickness lead to quite different results in mechanical behaviours, for example, the LA model with uniformly wall thickness (LAs 1.5) is less stretched throughout the cardiac cycle shown in Figure 13A. Therefore, if realistic LA wall dynamics are required, caution must be taken when applying such simplification during the geometry reconstruction process. Furthermore, with an increase in wall thickness by approximately 50%, our LA‐MV model exhibits higher LAA flow velocities (Figure 13C), larger reversal PV flow (Figure 13B), and late diastolic MV flow (Figure 13D) compared with LAOriginal, which suggests the substantial impact of atrial structural remodelling on the flow. Although the current model uses a relatively simple approach to mimic the remodelling process by directly increasing wall thickness, it shows the potential to capture more detailed mechanics and flow changes when combined with a physiologically realistic growth and remodelling system.
The left atrial appendage also plays a key role in the LA pump function. Previous studies have shown that it is a most common site for thrombus formation in the case of atrial fibrillation.65, 66, 67 As a key indicator of LAA thromboembolic event, LAA flow velocity is closely related to the qualitative parameters of elevated thromboembolic risk. Kamp et al68 performed transoesophageal echocardiography in 88 patients with paroxysmal or chronic atrial fibrillation and found that there is a significant higher risk of thrombus formation in patients with the presence of spontaneous echo contrast in left atrium and particularly low left atrial emptying peak flow velocity (≤20 cm/s). Verhorst et al69 also discovered reduced LAA flow velocities among the patients with documented systemic embolism (emptying flow peak: 25 ± 19 cm/s; filling flow peak: 23 ± 15 cm/s) compared with those without systemic embolism (emptying flow peak: 39 ± 23 cm/s; filling flow peak: 33 ± 16 cm/s). By excluding the active contraction in LAAF, our results (Figure 10A) show that LAA active emptying wave disappears at end‐diastole compared to the normal case (peak: 13.7 cm/s) and the early‐systole filling wave has a reduced peak (11.4 cm/s (LAAF) vs 15.1 cm/s (LAOriginal)). The fluid residence time inside LAA is also much longer in the case of AF (0.470 s) compared with other cases (LAOriginal: 0.423 s; LAMVR: 0.394 s) during contraction, which could induce a higher risk of blood clot formation. In the case of MV regurgitation, our results (Figure 10A) show that a higher and earlier systole filling wave occurs, as a result, the fluid residence time in the LAA is reduced, and thus indicates a lower chance of thombus formation inside LAA This is consistent with the work by Kranidis et al,38 who found that significant MVR actually protects patients against LA thrombogenesis formation and systemic embolization when the patients have both MV and AF diseases. Karatasakis et al70 also found that the presence of significant MVR correlates with lower risks of thrombi and embolization.
The work by Arvidsson et al71 used cardiac magnetic resonance to quantify the atrial blood kinetic energy and three energy peaks were found at systole, early‐diastole, and late‐diastole.Our coupled LA‐MV model presents a similar kinetic energy pattern with three peaks, but the highest peak appears during systole instead of early‐diastole, as shown in Figure 11A. Also, the energy dissipation rate (Figure 11B) shows similar behaviour as the study of Wang et al,72 which found the three peaks at systole (the highest), early‐diastole, and late‐diastole. The LA dysfunction is also reflected by the change of energy field in LAAF and LAMVR. For instance, both kinetic energy and energy loss (Figure 11) have much higher magnitude in the case of MVR than the normal case, while in the case of AF, on the contrary, lower energy level is seen due to the overall slower flow inside the LA. Such distinct energy behaviour among pathological cases implies that energy analysis provides a useful tool for the evaluation of cardiac function efficiency such as LA, LV pump function assessment.
Although there are no direct measurements available to compare our model predictions, our results are consistent with clinical observations. For example, De Marchi et al73 reported the peak systole flow velocity is 57(±18) cm/s and peak diastole flow velocity 49(±17) cm/s at RSPV among 315 normal patients. The peak flow velocities at RSPV from LAOriginal are 68.7 cm/s in systole and 50.8 cm/s in diastole, which are in the range of the reported values from De Marchi et al.73In the work by Dahl et al,74 two transmitral mass flow peaks are observed using in vivo MRI measurements from a healthy male (early‐diastole peak: 480 mL/s approximately; late‐diastole peak: 200 mL/s approximately ) and the volume change of atrial cavity during diastole is about 50 mL calculated from segmentation data. In our result from LAOriginal, the transmitral flow rate also obtains two diastolic waves with early‐diastole peak 520.7 mL/s and late‐diastole peak 212.7 mL/s (Figure 6D). The LA emptying volume is 58.0 mL close to their calculation. Also, Chao et al75 found that most patients with chronic AF had early‐systole reversal flow at PV orifice and none had late‐diastole reversal flow, similar results can be found in LAAF (Figure 6C). In a recent study, Ikenaga et al76 investigated the PV flow among patients before and after the MitraClip procedure, and they observed the immediate increase of systole PV flow in response to mitral regurgitation reduction, which is reflected in LAMVR (Figure 6C). Nevertheless, this study has limitations, including (a) material properties for LA wall and mitral valve are not personalized because of lack of experimental data and (b) the connection of the LA and MV geometries uses a rigid housing structure, which leads to the fixed mitral annulus. In addition to the need of including MV annulus shape change during the cardiac cycle,77, 78 patient‐specific LV geometry is also required to provide more realistic structural boundary conditions for the LA‐MV model. In addition, prestrain is not included in the current material model for MV leaflets, but studies have shown the existence of substantial in vivo residual strains/stresses in the leaflets.79 Accounting for prestrain reduces the discrepancy between in vivo and ex vivo experimental measurements80 and assists with physiological deformations of MV at peak systole.61
7. CONCLUSIONS
In this study, we have developed a coupled LA‐MV model with fluid‐structure interaction implemented in an immersed boundary method with finite element hyperelasticity. The coupled LA‐MV model includes a detailed description of the atrial geometry, mitral valve leaflets, and chordae structure with fibre‐reinforced hyperelastic constitutive laws. LA‐MV dynamics is investigated under physiological and pathological conditions, including diminished LA active contraction and mitral regurgitation. We further study the effects of different geometric features on the coupled LA‐MV dynamics. Our results show that the lack of atrial contraction at late‐diastole leads to the absence of LA active emptying process and a high risk of blood stagnation in LAA. Compared with the normal case, the mitral regurgitation will result in higher LA pressure, enlarged LA cavity with higher energy dissipation caused by the disturbance of regurgitant jet but reduced fluid residence time in LAA, which is consistent with clinical observations. A rule‐based fibre structure can be a good approximation of the physiological fibre structure as long as the LA mechanics is of concern. However, LA wall thickness can play an important role in LA dynamics. For example, a uniform approximation of LA wall thickness can lead to under‐estimation of LA wall strain, and the thicker the wall, the lower the strain level. Our results suggest that care needs to be taken when reconstructing the LA geometry for patient‐specific modelling.
ACKNOWLEDGEMENTS
We are grateful for the funding provided by the UK EPSRC (EP/N014642/1). L.F. also acknowledges funding from the China Scholarship Council and the fee waiver from the University of Glasgow. B.E.G. acknowledges research funding from NIH Award U01HL143336 and NSF Awards OAC 1450327 and OAC1652541.
APPENDIX A. ATRIAL FIBRE STRUCTURE
Both Ho et al1 and Sánchez‐Quintana et al32 have shown a detailed description of LA fibre structure, shown in Figures A1 and A2. From the epicardial aspect, the main fibre pattern on anterior wall is represented by Bachmann's bundle, also known as the interatrial bundle, which originates from the junction of right atrium and the superior caval vein, joined by a broad band of circumferential fibres, and runs passing either side of the neck of LAA to the left lateral wall and inferior part of the posterior wall. The septopulmonary bundle represents the group of fibres that comes from anterosuperior septal raphe (septal area marked epicardially by the interatriai groove), underneath the circumferential fibres, runs obliquely to the superior wall and fan out. Near the pulmonary veins, the septopulmonary bundle blends with the circular and longitudinal fibres at the insertions. On the posterior wall, two branches of the septopulmonary bundle are seen: one goes leftward and join the circumferential fibres on the lateral wall; one goes rightward to the posterior septal raphe. From the endocardial aspect, the dominant fibre pattern is described by the septoatrial bundle81 which originates from the anterior interatrial raphe and ascend to the superior wall together with the longitudinal fibres from vestibule and blend with the septopulmonary bundle. It also goes leftward and join the circumferential fibres on lateral and posterior wall.
Figure A1.
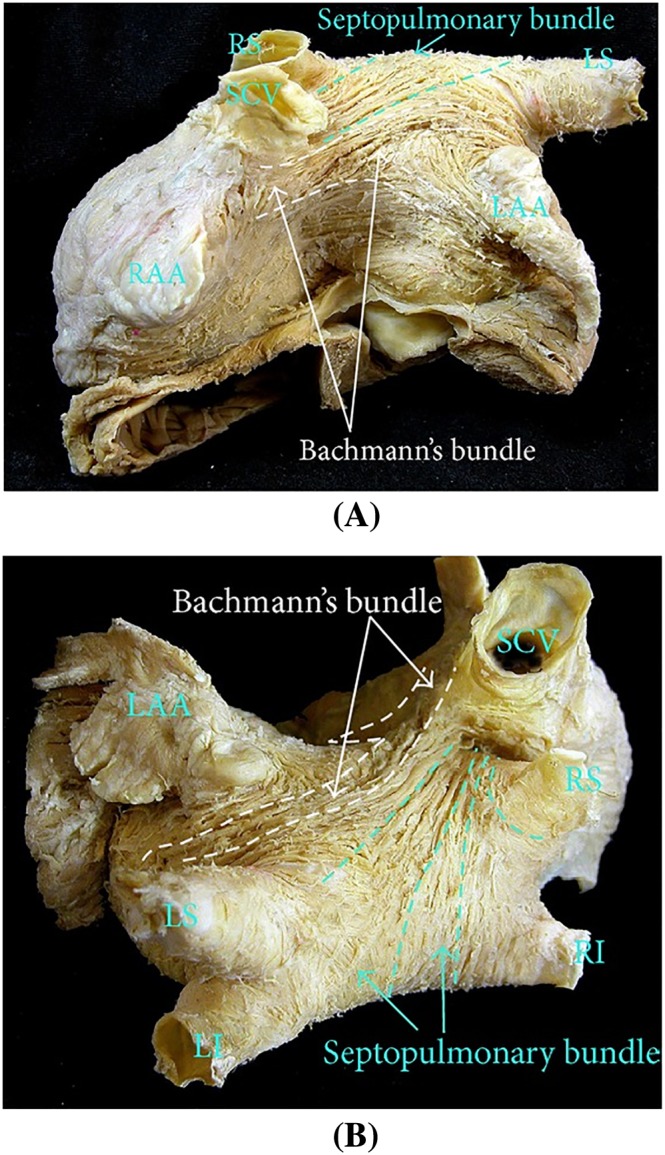
The left atrium fibre structure in the normal human heart. (A) Anterior view, where Bachmann's bundle runs from atrial septum to left atrial appendage, and the septopulmonary bundle runs obliquely to the superior wall. (B) Superior view where the septopulmonary bundle fans out. SCV, superior cava vein; RAA, right atrial appendage; LAA, left atrial appendage; LI, left inferior pulmonary vein; LS, left superior pulmonary vein; RI, right inferior pulmonary vein; RS, right superior pulmonary vein. The figure is from the work by Sánchez‐Quintana et al32
Figure A2.
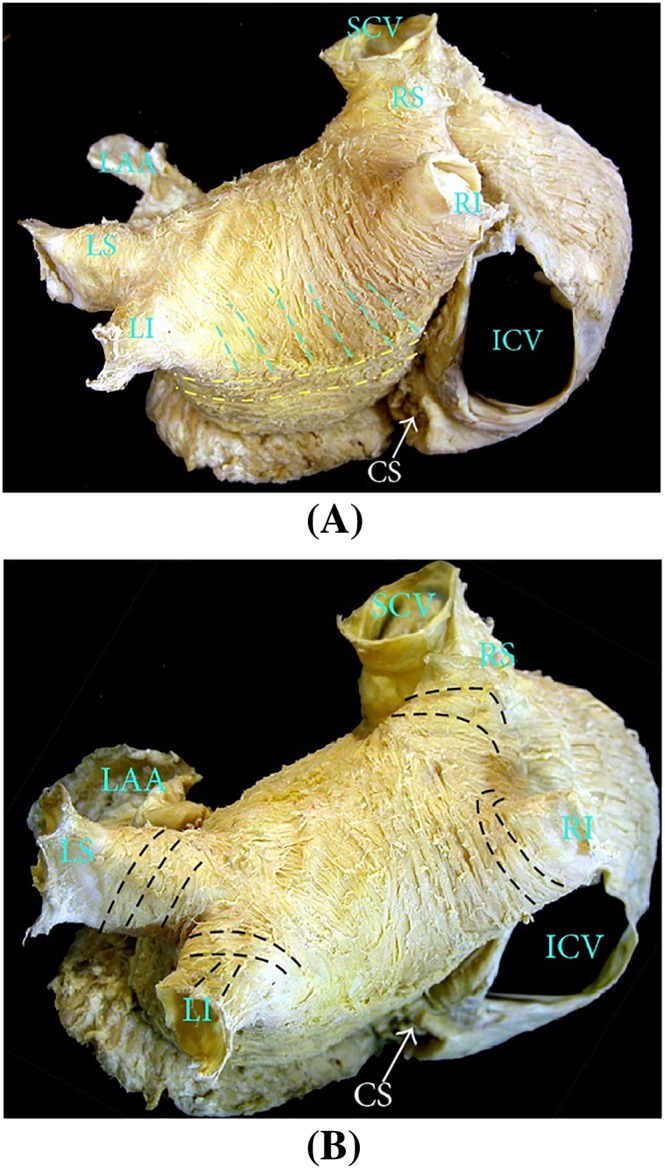
The left atrium fibre structure in the normal human heart. (A) Posterior view, where the septopulmonary bundle meets the circumferential fibres coming from the lateral wall. (B) Near the pulmonary veins insertions where circular fibres are dominant and longitudinal, oblique fibres are also common. ICV, inferior cava vein; CS, coronary sinus. The figure is from the work by Sánchez‐Quintana et al32
The rule‐based fibre defining method in the current study is summarized as follows: First, the surface fibres are defined within the six sections at LA epicardial surface shown in Figure 2C,D. For each section, the boundary follows the three‐dimensional spline generated by manually selected boundary points and used to divide the LA surface in SOLIDWORKS (Dassault systemes, USA). The pulmonary veins sections are defined to have radial width of approximately 0.5 cm at the insertions to incorporate circular fibre structure. The LAA section is separated simply at the LAA root. The MV plane section is defined with longitudinal width of 1 cm at septal, anterior, and posterior walls, and approximately 2 cm at the lateral wall. The septopulmonary section is defined with oblique boundary lines at anterior and posterior walls to match the fibre morphology observed in Figures A1 and A2. The Bachmann's bundle section is defined to be the rest of the anterior wall.
For each section, a cylindrical coordinate system is defined with longitudinal, radial, and circumferential directions. The surface fibres are defined to follow the circumferential direction and out‐of‐plane fibres are projected onto the tangential plane of the epicardial surface. Finally, the fibre orientations for the volumetric mesh elements are defined using a nearest neighbour approach.
APPENDIX B. MODEL CONNECTION
Since the LA and MV geometries used here are from different patients. It is therefore necessary and important to properly connect two models. The presented approach is based on the mitral annular geometry from both LA and MV models.
As illustrated in Figure B3, for both LA and MV models, we first define the major axis by selecting two annular points at anterolateral and posterolateral side, denoted by X AL and X PL. Then the anterior middle point, X AM, is chosen at anterior annulus and used to define a plane orthogonal to the major axis. The posterior middle point, X PM, is obtained via the intersection of this plane with the posterior annulus. The minor axis is therefore defined by X AM and X PM.
Figure B3.
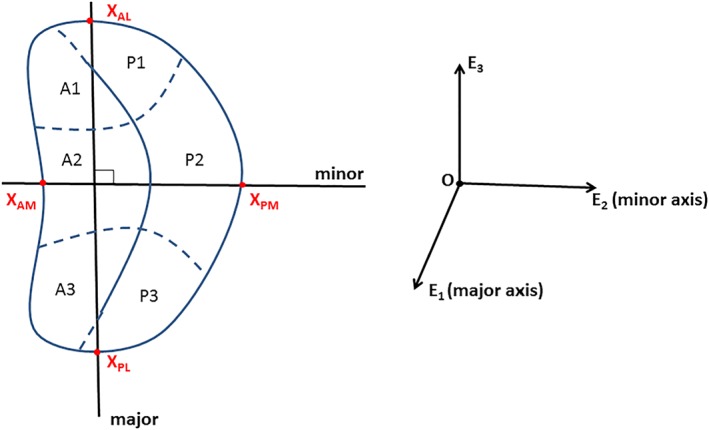
The major and minor axis for mitral annulus demonstrated on a typical D‐shaped annular geometry. A1‐A3 and P1‐P3 are the MV leaflets segments. X AL and X PL are preselected to define the major axis. X AM is the anterior middle point and X PM is the intersection point of E 2‐E 3 plane and the posterior annulus. E 3 is the third axis orthogonal to the major‐minor plane. A1, anterolateral segment; A2, anteromiddle segment; A3, anteromedial segment; P1, posterolateral segment; P2, posteromiddle segment; P3, posteromedial segment
The connection of the LA and the MV starts with overlapping the MV annulus central points O LA and O MV. Then the MV is rotated to ensure the alignment of major and minor axis with the LA. Next, the MV is shifted along the E 3 axis to avoid the intersection of two geometries. The gap between the LA and the MV is filled with a rigid housing structure. In the current model, the LV is represented by a rigid tube with ventricular pressure applied at one end and the other end connecting the LA at the MV exclusion. During the ventricular systole, the rigid housing is used to anchor the MV model and bear the high LV pressure.
Feng L, Gao H, Griffith B, Niederer S, Luo X. Analysis of a coupled fluid‐structure interaction model of the left atrium and mitral valve. Int J Numer Meth Biomed Engng. 2019;35:e3254 10.1002/cnm.3254
Footnotes
REFERENCES
- 1. Ho SY, Sanchez‐Quintana D, Cabrera JA, Anderson RH. Anatomy of the left atrium: implications for radiofrequency ablation of atrial fibrillation. J Cardiovasc Electrophysiol. 1999;10(11):1525‐1533. [DOI] [PubMed] [Google Scholar]
- 2. Al‐Saady N, Obel O, Camm A. Left atrial appendage: structure, function, and role in thromboembolism. Heart. 1999;82(5):547‐554. [DOI] [PMC free article] [PubMed] [Google Scholar]
- 3. Stefanadis C, Dernellis J, Toutouzas P. Evaluation of the left atrial performance using acoustic quantification. Echocardiography. 1999;16(1):117‐125. [DOI] [PubMed] [Google Scholar]
- 4. Kagawa K, Arakawa M, Miwa H, et al. Left atrial function during left ventricular diastole evaluated by left atrial angiography and left ventriculography. J cardiol. 1994;24(4):317‐325. [PubMed] [Google Scholar]
- 5. Kaski JC, Arrebola‐Moreno AL. Inflammation and thrombosis in atrial fibrillation. Revista espanola de cardiologia. 2011;64(07):551‐553. [DOI] [PubMed] [Google Scholar]
- 6. Violi F, Pastori D, Pignatelli P. Mechanisms and management of thrombo‐embolism in atrial fibrillation. J Atrial Fibrill. 2014;7(3). [DOI] [PMC free article] [PubMed] [Google Scholar]
- 7. Wysokinski WE, Ammash N, Sobande F, Kalsi H, Hodge D, McBane RD. Predicting left atrial thrombi in atrial fibrillation. A Heart J. 2010;159(4):665‐671. [DOI] [PubMed] [Google Scholar]
- 8. Gupta DK, Shah AM, Giugliano RP, et al. Left atrial structure and function in atrial fibrillation: ENGAGE AF‐TIMI 48. Eur Heart J. 2013;35(22):1457‐1465. [DOI] [PMC free article] [PubMed] [Google Scholar]
- 9. Burstein B, Nattel S. Atrial fibrosis: mechanisms and clinical relevance in atrial fibrillation. J Am Coll Cardiol. 2008;51(8):802‐809. [DOI] [PubMed] [Google Scholar]
- 10. Whitaker J, Rajani R, Chubb H, et al. The role of myocardial wall thickness in atrial arrhythmogenesis. Ep Europace. 2016;18(12):1758‐1772. [DOI] [PMC free article] [PubMed] [Google Scholar]
- 11. Nishida K, Michael G, Dobrev D, Nattel S. Animal models for atrial fibrillation: clinical insights and scientific opportunities. Europace. 2009;12(2):160‐172. [DOI] [PubMed] [Google Scholar]
- 12. Khurram IM, Maqbool F, Berger RD, et al. Association between left atrial stiffness index and atrial fibrillation recurrence in patients undergoing left atrial ablation. Circ Arrhythm Electrophysiol. 2016;9(3):e003163. [DOI] [PubMed] [Google Scholar]
- 13. Borg AN, Pearce KA, Williams SG, Ray SG. Left atrial function and deformation in chronic primary mitral regurgitation. Eur J Echocardiogr. 2009;10(7):833‐840. [DOI] [PubMed] [Google Scholar]
- 14. Grigioni F, Avierinos JF, Ling LH, et al. Atrial fibrillation complicating the course of degenerative mitral regurgitation: determinants and long‐term outcome. J Am Coll Cardiol. 2002;40(1):84‐92. [DOI] [PubMed] [Google Scholar]
- 15. Lupu S, Mitre A, Dobreanu D. Left atrium function assessment by echocardiography physiological and clinical implications. Med Ultrason. 2014;16(2):152‐159. [DOI] [PubMed] [Google Scholar]
- 16. Blume GG, Mcleod CJ, Barnes ME, et al. Left atrial function: physiology, assessment, and clinical implications. Eur J Echocardiogr. 2011;12(6):421‐430. [DOI] [PubMed] [Google Scholar]
- 17. Roşca M, Lancellotti P, Popescu BA, Piérard LA. Left atrial function: pathophysiology, echocardiographic assessment, and clinical applications. Heart. 2011;97(23):1982‐1989. [DOI] [PubMed] [Google Scholar]
- 18. Hanke T. Surgical management of the left atrial appendage: a must or a myth?. Eur J Cardiothorac Surg. 2018;53(suppl_1):i33‐i38. [DOI] [PubMed] [Google Scholar]
- 19. Hohnloser SH, Kuck KH, Lilienthal J, et al. Rhythm or rate control in atrial fibrillation–Pharmacological Intervention in Atrial Fibrillation (PIAF): a randomised trial. The Lancet. 2000;356(9244):1789‐1794. [DOI] [PubMed] [Google Scholar]
- 20. Evin M, Callaghan FM, Defrance C, et al. Left atrium MRI 4D‐flow in atrial fibrillation: association with LA function. In: IEEE; 2015:5‐8.
- 21. Markl M, Foucar C, Carr ML, et al. Left atrial and left atrial appendage 4D blood flow dynamics in atrial fibrillation. J Cardiovasc Magn Reson. 2016;18(1):O90. [DOI] [PMC free article] [PubMed] [Google Scholar]
- 22. Fyrenius A, Wigström L, Ebbers T, Karlsson M, Engvall J, Bolger AF. Three dimensional flow in the human left atrium. Heart. 2001;86(4):448‐455. [DOI] [PMC free article] [PubMed] [Google Scholar]
- 23. Menghini F, Dede L, Forti D, Quarteroni A. Hemodynamics in a left atrium based on a Variational Multiscale‐LES numerical model.
- 24. Koizumi R, Funamoto K, Hayase T, et al. Numerical analysis of hemodynamic changes in the left atrium due to atrial fibrillation. J Biomech. 2015;48(3):472‐478. [DOI] [PubMed] [Google Scholar]
- 25. Vedula V, George R, Younes L, Mittal R. Hemodynamics in the left atrium and its effect on ventricular flow patterns. J Biomech Eng. 2015;137(11):111003. [DOI] [PubMed] [Google Scholar]
- 26. Masci A, Alessandrini M, Forti D, et al. A patient‐specific computational fluid dynamics model of the left atrium in atrial fibrillation: development and initial evaluation. In: Springer; 2017:392‐400.
- 27. Fastl TE, Tobon‐Gomez C, Crozier A, et al. Personalized computational modeling of left atrial geometry and transmural myofiber architecture. Med Image Anal. 2018;47:180‐190. [DOI] [PMC free article] [PubMed] [Google Scholar]
- 28. Bosi GM, Cook A, Rai R, et al. Computational fluid dynamic analysis of the left atrial appendage to predict thrombosis risk. Front cardio med. 2018;5:34. [DOI] [PMC free article] [PubMed] [Google Scholar]
- 29. Hunter RJ, Liu Y, Lu Y, Wang W, Schilling RJ. Left atrial wall stress distribution and its relationship to electrophysiologic remodeling in persistent atrial fibrillation. Circ Arrhythm Electrophysiol. 2012;5(2):351‐360. [DOI] [PubMed] [Google Scholar]
- 30. Adeniran I, MacIver DH, Garratt CJ, Ye J, Hancox JC, Zhang H. Effects of persistent atrial fibrillation‐induced electrical remodeling on atrial electro‐mechanics–insights from a 3D model of the human atria. PloS one. 2015;10(11):e0142397. [DOI] [PMC free article] [PubMed] [Google Scholar]
- 31. Zhao J, Hansen BJ, Wang Y, et al. Three‐dimensional integrated functional, structural, and computational mapping to define the structural âÅIJFingerprintsâÅl of Heart‐Specific Atrial Fibrillation Drivers in Human Heart Ex Vivo. J Am Heart Assoc. 2017;6(8):e005922. [DOI] [PMC free article] [PubMed] [Google Scholar]
- 32. Sánchez‐Quintana D, López‐Mínguez JR, Macías Y, Cabrera JA, Saremi F. Left atrial anatomy relevant to catheter ablation. Cardiol Res Pract. 2014;2014. [DOI] [PMC free article] [PubMed] [Google Scholar]
- 33. Krueger MW, Seemann G, Rhode K, et al. Personalization of atrial anatomy and electrophysiology as a basis for clinical modeling of radio‐frequency ablation of atrial fibrillation. IEEE transactions on medical imaging. 2012;32(1):73‐84. [DOI] [PubMed] [Google Scholar]
- 34. Harrild DM, Henriquez CS. A computer model of normal conduction in the human atria. Circ Res. 2000;87(7):e25‐e36. [DOI] [PubMed] [Google Scholar]
- 35. Einstein DR, Del Pin F, Jiao X, et al. Fluid–structure interactions of the mitral valve and left heart: comprehensive strategies, past, present and future. Int J Numer Methods Biomed Eng. 2010;26(3‐4):348‐380. [DOI] [PMC free article] [PubMed] [Google Scholar]
- 36. Lopez‐Perez A, Sebastian R, Ferrero JM. Three‐dimensional cardiac computational modelling: methods, features and applications. Biomed Eng Online. 2015;14(1):35. [DOI] [PMC free article] [PubMed] [Google Scholar]
- 37. Mittal R, Seo JH, Vedula V, et al. Computational modeling of cardiac hemodynamics: current status and future outlook. J Comput Phys. 2016;305:1065‐1082. [Google Scholar]
- 38. Kranidis A, Koulouris S, Filippatos G, et al. Mitral regurgitation protects from left atrial thrombogenesis in patients with mitral valve disease and atrial fibrillation. Pacing Clin Electrophysiol. 2000;23(11P2):1863‐1866. [DOI] [PubMed] [Google Scholar]
- 39. Belen E, Özal E, Püsüroğlu H. Relationship between the presence of left atrial thrombus in patients with mitral stenosis and platelet‐to‐lymphocyte ratio. Anatol J Cardiol. 2016;16(9):673. [DOI] [PMC free article] [PubMed] [Google Scholar]
- 40. Hwang JJ, Shyu KG, Hsu KL, Chen JJ, Kuan P, Lien WP. Significant mitral regurgitation is protective against left atrial spontaneous echo contrast formation, but not against systemic embolism. Chest. 1994;106(1):8‐12. [DOI] [PubMed] [Google Scholar]
- 41. Toma M, Bloodworth CH, Pierce EL, et al. Fluid‐structure interaction analysis of ruptured mitral chordae tendineae. Ann Biomed Eng. 2017;45(3):619‐631. [DOI] [PMC free article] [PubMed] [Google Scholar]
- 42. Caballero A, Mao W, McKay R, Primiano C, Hashim S, Sun W. New insights into mitral heart valve prolapse after chordae rupture through fluid–structure interaction computational modeling. Sci Rep. 2018;8(1):17306. [DOI] [PMC free article] [PubMed] [Google Scholar]
- 43. Feng L, Qi N, Gao H, et al. On the chordae structure and dynamic behaviour of the mitral valve. IMA J Appl Math. 2018;83(6):1066‐1091. [DOI] [PMC free article] [PubMed] [Google Scholar]
- 44. Griffith BE, Luo X. Hybrid finite difference/finite element immersed boundary method. Int J Numer. Methods Biomed Eng. 2017;33(12):e2888. [DOI] [PMC free article] [PubMed] [Google Scholar]
- 45. Griffith BE. An accurate and efficient method for the incompressible Navier–Stokes equations using the projection method as a preconditioner. J Comput Phys. 2009;228(20):7565‐7595. [Google Scholar]
- 46. Colella P, Woodward PR. The piecewise parabolic method (PPM) for gas‐dynamical simulations. J Comput Phys. 1984;54(1):174‐201. [Google Scholar]
- 47. Ferrer A, Sebastián R, Sánchez‐Quintana D, et al. Detailed anatomical and electrophysiological models of human atria and torso for the simulation of atrial activation. PloS one. 2015;10(11):e0141573. [DOI] [PMC free article] [PubMed] [Google Scholar]
- 48. Wang Q, Sun W. Finite element modeling of mitral valve dynamic deformation using patient‐specific multi‐slices computed tomography scans. Ann Biomed Eng. 2013;41(1):142‐153. [DOI] [PubMed] [Google Scholar]
- 49. Vadala‐Roth B, Rossi S, Griffith BE. Stabilization approaches for the hyperelastic immersed boundary method for problems of large‐deformation incompressible elasticity. Submitted, arXiv preprint arXiv:1811.06620. [DOI] [PMC free article] [PubMed]
- 50. Genet M, Lee LC, Kuhl E, Guccione J. Abaqus/standard‐based quantification of human cardiac mechanical properties. arXiv preprint arXiv:1602.06161. 2016. [Google Scholar]
- 51. Gao H, Wang H, Berry C, Luo X, Griffith BE. Quasi‐static image‐based immersed boundary‐finite element model of left ventricle under diastolic loading. Int J Numer Methods Biomed Eng. 2014;30(11):1199‐1222. [DOI] [PMC free article] [PubMed] [Google Scholar]
- 52. Niederer S, Hunter P, Smith N, Aquantitative analysis of cardiacmyocyte relaxation: a simulation study. Biophys J. 2006;90(5):1697‐1722. [DOI] [PMC free article] [PubMed] [Google Scholar]
- 53. Wang VY, Lam HI, Ennis DB, Cowan BR, Young AA, Nash MP. Cardiac active contraction parameters estimated from magnetic resonance imaging. In: Springer; 2010:194‐203.
- 54. Thomsen AF, Kühl JT, Kofoed KF, et al. Left atrial wall thickness and pulmonary vein size are increased in patients with atrial fibrillation compared to healthy controls: a multidetector computed tomography study. Int J Clinical Cardio. 2017:1‐9. [Google Scholar]
- 55. Maceira AM, Prasad SK, Khan M, Pennell D. Normalized left ventricular systolic and diastolic function by steady state free precession cardiovascular magnetic resonance. J Cardiovasc Magn Reson. 2006;8(3):417‐426. [DOI] [PubMed] [Google Scholar]
- 56. Russo C, Jin Z, Homma S, et al. Left atrial minimum volume and reservoir function as correlates of left ventricular diastolic function: impact of left ventricular systolic function. Heart. 2012;98(10):813‐820. [DOI] [PMC free article] [PubMed] [Google Scholar]
- 57. Jimenez JH, Liou SW, Padala M, et al. A saddle‐shaped annulus reduces systolic strain on the central region of the mitral valve anterior leaflet. J Thorac Cardiovasc Surg. 2007;134(6):1562‐1568. [DOI] [PubMed] [Google Scholar]
- 58. Sacks MS, Enomoto Y, Graybill JR, et al. In‐vivo dynamic deformation of the mitral valve anterior leaflet. Ann Thorac Surg. 2006;82(4):1369‐1377. [DOI] [PubMed] [Google Scholar]
- 59. Ma X, Gao H, Griffith BE, Berry C, Luo X. Image‐based fluid–structure interaction model of the human mitral valve. Comput Fluids. 2013;71:417‐425. [Google Scholar]
- 60. Gao H, Ma X, Qi N, Berry C, Griffith BE, Luo X. A finite strain nonlinear human mitral valve model with fluid‐structure interaction. Int J Numer Methods Biomed Eng. 2014;30(12):1597‐1613. [DOI] [PMC free article] [PubMed] [Google Scholar]
- 61. Prot V, Skallerud B. Contributions of prestrains, hyperelasticity, and muscle fiber activation on mitral valve systolic performance. Int J Numer Methods Biomed Eng. 2017;33(4):e2806. [DOI] [PubMed] [Google Scholar]
- 62. Kihara Y, Sasayama S, Miyazaki S, et al. Role of the left atrium in adaptation of the heart to chronic mitral regurgitation in conscious dogs. Circ Res. 1988;62(3):543‐553. [DOI] [PubMed] [Google Scholar]
- 63. Peskin CS. The immersed boundary method. Acta numerica. 2002;11:479‐517. [Google Scholar]
- 64. Krueger MW, Schmidt V, Tobón C, et al. Modeling atrial fiber orientation in patient‐specific geometries: a semi‐automatic rule‐based approach. In: Springer; 2011:223‐232.
- 65. Blackshear JL, Odell JA. Appendage obliteration to reduce stroke in cardiac surgical patients with atrial fibrillation. Ann Thorac Surg. 1996;61(2):755‐759. [DOI] [PubMed] [Google Scholar]
- 66. Beigel R, Wunderlich NC, Ho SY, Arsanjani R, Siegel RJ. The left atrial appendage: anatomy, function, and noninvasive evaluation. JACC Cardiovasc Imaging. 2014;7(12):1251‐1265. [DOI] [PubMed] [Google Scholar]
- 67. Vainrib AF, Bamira D, Benenstein RJ, Aizer A, Chinitz LA, Saric M. Echocardiographic guidance of the novel WaveCrest left atrial appendage occlusion device. CASE: Cardiovasc Imaging Case Rep. 2018;2(6):297. [DOI] [PMC free article] [PubMed] [Google Scholar]
- 68. Kamp O, Verhorst P, Welling R, Visser C. Importance of left atrial appendage flow as a predictor of thromboembolic events in patients with atrial fibrillation. Eur Heart J. 1999;20(13):979‐985. [DOI] [PubMed] [Google Scholar]
- 69. Verhorst P, Kamp O, Visser CA, Verheugt FW. Left atrial appendage flow velocity assessment using transesophageal echocardiography in nonrheumatic atrial fibrillation and systemic embolism. Am J Cardiol. 1993;71(2):192‐196. [DOI] [PubMed] [Google Scholar]
- 70. Karatasakis GT, Gotsis AC, Cokkinos DV. Influence of mitral regurgitation on left atrial thrombus and spontaneous echocardiographic contrast in patients with rheumatic mitral valve disease. Am J Cardiol. 1995;76(4):279‐281. [DOI] [PubMed] [Google Scholar]
- 71. Arvidsson P, Toger J, Heiberg E, Carlsson M, Arheden H. Quantification of left and right atrial kinetic energy using four‐dimensional intracardiac magnetic resonance imaging flow measurements. J Cardiovasc Magn Reson. 2013;15(1):P218. [DOI] [PubMed] [Google Scholar]
- 72. Wang Y, Hou D, Ma R, Ding G, Yin L, Zhang M. Early detection of left atrial energy loss and mechanics abnormalities in diabetic patients with normal left atrial size: a study combining vector flow mapping and tissue tracking echocardiography. Med Sci Monitor Int Med J Exp Clin Res. 2016;22:958. [DOI] [PMC free article] [PubMed] [Google Scholar]
- 73. De Marchi S, Bodenmüller M, Lai D, Seiler C. Pulmonary venous flow velocity patterns in 404 individuals without cardiovascular disease. Heart. 2001;85(1):23‐29. [DOI] [PMC free article] [PubMed] [Google Scholar]
- 74. Dahl SK, Thomassen E, Hellevik LR, Skallerud B. Impact of pulmonary venous locations on the intra‐atrial flow and the mitral valve plane velocity profile. Cardiovasc Eng Technol. 2012;3(3):269‐281. [Google Scholar]
- 75. Chao TH, Tsai LM, Tsai WC, Li YH, Lin LJ, Chen JH. Effect of atrial fibrillation on pulmonary venous flow patterns assessed by Doppler transesophageal echocardiography. Chest. 2000;117(6):1546‐1550. [DOI] [PubMed] [Google Scholar]
- 76. Ikenaga H, Hayashi A, Nagaura T, et al. Relation between pulmonary venous flow and left atrial pressure during percutaneous mitral valve repair with the mitraclip. Am J Cardiol. 2018;122(8):1379‐1386. [DOI] [PubMed] [Google Scholar]
- 77. Ormiston JA, Shah PM, Tei C, Wong M. Size and motion of the mitral valve annulus in man. I. A two‐dimensional echocardiographic method and findings in normal subjects. Circulation. 1981;64(1):113‐120. [DOI] [PubMed] [Google Scholar]
- 78. Levack MM, Jassar AS, Shang EK, et al. Three‐dimensional echocardiographic analysis of mitral annular dynamics: implication for annuloplasty selection. Circulation. 2012;126(11_suppl_1):S183‐S188. [DOI] [PMC free article] [PubMed] [Google Scholar]
- 79. Amini R, Eckert CE, Koomalsingh K, et al. On the in vivo deformation of the mitral valve anterior leaflet: effects of annular geometry and referential configuration. Ann Biomed Eng. 2012;40(7):1455‐1467. [DOI] [PMC free article] [PubMed] [Google Scholar]
- 80. Rausch MK, Famaey N, Shultz TO, Bothe W, Miller DC, Kuhl E. Mechanics of the mitral valve. Biomech Model Mechanobiol. 2013;12(5):1053‐1071. [DOI] [PMC free article] [PubMed] [Google Scholar]
- 81. Papez JW. Heart musculature of the atria. American Journal of Anatomy. 1920;27(3):255‐285. [Google Scholar]


