

Abstract
Background
Tricyclic antidepressants are still extensively prescribed worldwide. Evidence for the recommended dosage of tricyclics, however, is poor.
Objectives
To compare the effects and side effects of low dosage tricyclic antidepressants with placebo and with standard dosage tricyclics in acute phase treatment of depression.
Search methods
Electronic search of the Cochrane Collaboration Depression, Anxiety and Neurosis Controlled Trials Register (CCDANCTR), incorporating results of group searches of MEDLINE (1966‐), EMBASE (1980‐), CINAHL (1982‐), PsycLIT (1974‐), PSYNDEX (1977‐) and LILACS (1982‐1999) and hand searches of major psychiatric and medical journals. Reference search and SciSearch of the identified studies. Personal contact with authors of significant papers.
Selection criteria
All randomised controlled trials 1) comparing low dosage TCA (=< 100 mg/d on average at the end of trial) with placebo or 2) comparing low and standard dosages of the same TCA, in acute phase treatment of depressive disorder
Data collection and analysis
Two independent reviewers examined eligibility of the identified studies, and extracted data for outcomes at 1 week, 2 weeks, 4 weeks, 6‐8 weeks and later. Main outcome measures were relative risk of response in depression (random effects model), according to the original authors' definition but usually defined as 50% or greater reduction in severity of depression according to the last‐observation‐carried‐forward intention‐to‐treat method, and relative risks of overall dropouts and dropouts due to side effects. Other outcome measures included worst‐case‐scenario intention‐to‐treat analysis of response as defined above (in which dropouts were considered non‐responders in the active treatment group and as responders in the comparison group), and standardised weighted mean scores of continuous depression severity scales (usually calculated by last‐observation‐carried‐forward method).
Main results
35 studies (2013 participants) compared low dosage tricyclics with placebo, and six studies (551 participants) compared low dosage tricyclics with standard dosage tricyclics. Low dosage tricyclics, mostly between 75 and 100 mg/day, were 1.65 (95% confidence interval 1.36 to 2.0) and 1.47 (1.12 to 1.94) times more likely than placebo to bring about response at 4 weeks and 6‐8 weeks, respectively. Standard dosage tricyclics failed, however, to bring about more response but produced more dropouts due to side effects than low dosage tricyclics.
Authors' conclusions
Treatment of depression in adults with low dose tricyclics is justified. However, more rigorous studies are needed to definitively establish the relative benefits and harms of varying dosages.
Plain language summary
Low dose tricyclic antidepressants (TCAs) for depression
Practicing physicians and psychiatrists have often been criticised for administering too low a dosage of tricyclic antidepressants for people with depression. This systematic review of 39 studies (2564 participants) found that tricyclic antidepressants between 75‐100 mg/day and possibly below this range result in more reduction in depression than placebo. On the other hand, there was no strong evidence to show that standard dosage tricyclic brings about more response than low dosage tricyclic. The findings suggest that administration of low dosage tricyclic antidepressant is a defensible practice.
Background
It has been repeatedly pointed out that depression is undertreated in both primary care and psychiatric settings, with less than adequate dosage of antidepressant for less than optimum duration of treatment. Thus, as recently as in 1997, the consensus statement organized by the National Depressive and Manic‐Depressive Association in the United States concluded flatly that "there is overwhelming evidence that individuals with depression are being seriously undertreated." (Hirschfeld 1997) This was so, despite the many foregoing studies widely publicized in the professional medical literature. Almost 20 years ago, a report from the National Institute of Mental Health Collaborative Depression Study revealed that among those with major depression treated in the community before they visited the university hospitals, only 12% had received greater than 150 mg of imipramine or its equivalent (Keller 1982). In the subsequent treatment of these patients in these leading academic institutions, 31% of the inpatients received either no or very low antidepressant somatotherapy, and only 49% received at least 200 mg of imipramine or its equivalent for four consecutive weeks; among the outpatients, 53% were in the former category and only 19% were in the latter category (Keller 1986). The situation may be worse in primary care. The Medical Outcomes Study has shown that only 16% of depressed outpatients visiting general medical clinicians and 34% of such patients visiting psychiatrists received some antidepressant medication, and that among those receiving some antidepressant medication, 39% used a subtherapeutic daily dose (e.g. less than 100 mg/day of imipramine or 20 mg/day of fluoxetine) (Wells 1994). Data from computerized pharmacy records of a large health maintenance organization revealed that the proportion of patients receiving daily dose of more than 100 mg of imipramine or equivalent was 48% at psychiatrists and 40% at primary care physicians (Simon 1993). The situation is no different in the United Kingdom. At the Maudsley Hospital, only 36% of the patients on antidepressants were on doses over 100 mg equivalent of amitriptyline; among those who did not remit after four months of treatment, the proportion of patients receiving an inadequate dosage reached 78% (Brugha 1992). Two recent general practice surveys showed that as many as 88% of prescriptions for tricyclic antidepressants by general practitioners were at doses below those recommended by the consensus guidelines, namely 125 mg/day of TCA (Donoghue 1996; MacDonald 1996). A small survey at a 600‐bed teaching general hospital reported that 80% of prescriptions of tricyclics were "under the normally accepted therapeutic dose" of 150 mg/day (Carson 2000). Similar data are reported from other countries all over the world. Furukawa et al (Furukawa 2000) reported that in Japan the proportion of patients with major depression receiving at least 125 mg/day of imipramine or equivalent was only 31% at one month and 33% at six months after treatment commencement. In a general hospital in Tokyo, only 2% of the cyclic antidepressants were prescribed within the recommended dosage. 89% were less than 30 mg/day (Yamada 2000). A prescription database analysis in Denmark showed that the estimated daily doses for the tricyclic antidepressants were generally low, the third quartile being less than 100 mg (Rosholm 1993). The elderly inpatients in Dutch psychiatric hospitals, when diagnosed with major depression, were mostly able to receive an antidepressant but the adequate dosage was achieved in only 45% of them (Heeren 1997).
When "undertreatment of depression" is so universal, one naturally wonders whence comes the "therapeutic", "recommended" or "adequate" dosage of antidepressant, especially of TCA? One of the first evidence‐based guidelines for the treatment of depression stated "With the commonly used tricyclics such as imipramine or amitriptyline the average therapeutic dose regime is 150 mg/day, but can be increased to 300 mg/day." (p. 141) (QAP 1983) The recently revised practice guideline from the American Psychiatric Association lists 100‐300 mg/day of imipramine and other TCAs as "usual dose" (APA 2000). Or in the UK, one recent guideline for general practitioners advised them to aim for a dose of 150 mg of TCA as first‐line treatment (Stevens 1997). None of these provides supporting evidence for their recommendations. One of the most thoroughly constructed practice guideline for major depression to date (DGP 1993) gave 75‐300 mg/day of imipramine and other TCAs as "therapeutic dosage range." It further observed, however, that "therapeutic ranges have generally not been established by randomised controlled trials with patients on predesigned fixed medication levels in which group efficacy was measured. Rather, the suggested ranges are derived from laboratory/clinical interaction such that most patients who responded did so with dosages that produced the therapeutic levels indicated." (p. 58) Another well‐documented guideline published recently (Anderson 2000) acknowledged that the evidence about what comprises an adequate dosage of TCAs is poor, although it does summarise its findings as "Older TCAs appear to be more effective at a dose of 125‐150 mg compared with 75 mg and probably lack antidepressant efficacy below 75 mg." The consensus guideline developed by the Royal Colleges of Psychiatrists and of General Practitioners in UK was more explicit (Paykel 1992). Citing three RCTs (Blashki 1971; Thompson 1989; Paykel 1988), they wrote "At doses of 125‐150 mg daily tricyclic antidepressants are effective in patients in general practice with depressive illness. In contrast, there is no evidence from controlled trials that doses of 75 mg daily or lower are effective." (p. 1200) This statement has been widely interpreted to mean that 125 mg or more is the recommended dose and that the minimum effective dose is 125 mg (Moore 1997).
However, critical appraisal of the two epoch‐making RCTs (Blashki 1971; Thompson 1989) cited by Paykel et al (Paykel 1992) immediately reveals much to be desired. The drop out rate was high in one trial (Blashki 1971) and extremely high in the other (Thompson 1989). Both were conducted in general practice and involved patients with uncertain diagnosis: one was conducted before the era of the modern diagnostic criteria (Blashki 1971) and the other accepted the general practitioners' "usual diagnosis of depression" only half of which turned out to be major depressive according to the Research Diagnostic Criteria (Thompson 1989). The duration of the treatment was only four weeks in both trials. Most importantly, if we were to put our faith in their negative results, both were grossly underpowered. Blashki et al. (Blashki 1971) concluded that 75 mg/day of amitriptyline was no more effective than placebo at one or four weeks; retrospective power analysis shows, however, that it had only 40% power to detect a 5 point difference in the HRSD at one week and 30% power to do so at four weeks. Actually the average HRSD score at four weeks was 6.4 for the active treatment arm and 11.4 for the placebo arm. Thompson et al's trial (Thompson 1989) had only 63% power to detect a 5 point difference in the HRSD, even when the last observation carried forward method was allowed; it had only 54% power if we exclude all the drop outs. Very curiously enough, a meta‐analysis of 15 RCTs involving over 1,000 patients with major depression has shown that selective serotonin‐reuptake inhibitors (SSRIs) in standard dosage is as effective as tertiary amine antidepressants in low dosage (100 mg or less) and a meta‐analysis of 37 RCTs involving over 3,000 patients has shown that SSRIs in standard dosage is again simply as effective as tertiary amine antidepressants in standard dosage (above 100 mg); in both instances the 95% confidence intervals of the pooled odds ratio were quite narrow (Trindade 1997). Another very well‐conducted meta‐analysis became recently available to shed light on this issue from a different perspective (Bollini 1999). It pooled all RCTs comparing two or more doses of the same antidepressant and concluded that doses below 100 mg/day of imipramine equivalents are marginally less effective than the therapeutic range (100‐200 mg/day) but produces significantly fewer adverse events. Closer inspection of the included studies reveals, however, that this meta‐analysis is based largely on trials involving SSRIs and other newer antidepressants. It included only two RCTs of acute phase treatment of major depression by TCA, one comparing 150 mg vs. 300 mg of imipramine (Simpson 1976) and another comparing 30 mg vs. 75 mg of clomipramine (Gringras 1975). Thus, although their conclusion is phrased in terms of imipramine equivalent, it hinges critically on the conversion calculations between SSRIs and other antidepressants and imipramine and, even then, the results should be interpreted as pertaining mostly to SSRIs and newer antidepressants.
The present meta‐analysis focuses on the dosage problem of tricyclic antidepressants and seeks to examine how the so‐called subtherapeutic dosage of TCAs compares with placebo and with the so‐called therapeutic dosage in terms of effects and side‐effects. We will focus on TCAs in order to avoid the uncertainties and arbitrariness associated with conversion calculations for SSRIs and newer antidepressants.
Objectives
1)To determine how the low dosage TCA compares with placebo in acute phase treatment of depressive disorder in terms of its effects and side‐effects 2)To determine how the low dosage TCA compares with the standard dosage in acute phase treatment of depressive disorder in terms of its effects and side‐effects
Methods
Criteria for considering studies for this review
Types of studies
All relevant randomised controlled trials.
Types of participants
Study participants had to be adults (18 or older) of either sex, with any primary diagnosis of depression. We accepted trials which did not employ explicit diagnostic criteria such as the Feighner criteria, Research Diagnostic Criteria, DSM‐III, DSM‐III‐R, DSM‐IV or ICD‐10. We examined the effect of including patients with uncertain diagnoses in the sensitivity analyses. In addition, a concurrent diagnosis of another psychiatric disorder or a general medical condition was not considered an exclusion criteria.
Types of interventions
Two types of trials were included. 1)Trials comparing the low dosage TCA with placebo in acute phase treatment of depressive disorder 2)Trials comparing the low and standard dosages of the same TCA in acute phase treatment of depressive disorder Low dosage TCA is defined as follows: imipramine =< 100 mg/day on average (at the end of the trial) amitriptyline =< 100 mg/day on average clomipramine =< 100 mg/day on average desipramine =< 100 mg/day on average doxepin =< 100 mg/day on average dosulepin/dothiepin =< 100 mg/day on average trimipramine =< 100 mg/day on average lofepramine =< 100 mg/day on average There may be some discussion concerning what constitutes low dosage for nortriptyline and we did not include trials involving nortriptyline. Although there can be no absolute truth with regard to conversion calculations even within TCAs, the above conventions are in line with most of the previous literature. Standard dosage TCA is, therefore, any of the above named TCA at dosage greater than 100 mg/day on average. The duration of the trial had to be at least four weeks.
Types of outcome measures
Studies had to include at least one measure for the depressive severity, which was set as the primary outcome of this systematic review. The symptom severity may be measured by either observer‐rating (preferred) or self‐report. Effectiveness was evaluated using the following outcome measures. 1) group mean scores in the continuous depressive severity scale 2) number of patients who respond to treatment, either by showing >50% reduction in depressive severity from baseline or by the original study authors' definition, or by attaining "very much improved" or "much improved" on the Clinical Global Impression improvement scale. Outcomes were measured at different time points up to 8 weeks. Where possible, these indices of effectiveness were pooled at different time points in the course of treatment, such as at 1 week, at 2 weeks , at 4 weeks and so on.
Tolerability of the treatment was evaluated using the following outcome measures. 1) number of patients dropping out of the trial for any reason 2) number of patients dropping out due to side effects 3) number of patients complaining of any side effects
Search methods for identification of studies
1. Handsearch of CCDANCTR The Cochrane Collaboration Depression, Anxiety and Neurosis Controlled Trials Register (CCDANCTR) incorporates results of group searches of MEDLINE (1966‐), EMBASE (1980‐), CINAHL (1982‐), PsycLIT (1974‐), PSYNDEX (1977‐) and LILACS (1982‐1999) and hand searches of major psychiatric and medical journals. See Collaborative Review Group Search Strategy. Because it is evidently impossible to search for trials meeting our eligibility criteria merely by electronic searches, we first performed electronic search of the CCDANCTR using the following terms, and then manually examined all the candidate papers if they met our eligibility criteria. PHARMACOTHERAPY‐TCA or AMESERGIDE or AMINEPTINE or maneon or survector or AMITRIPTYLINE or adepril or amilit* or amineurin or amitril or amitrol or amyline or domical or elatrol or elavil or emitrip or endep or enovil or equilibrin or eulipt or laroxyl or lentizol or levate or mevaril or neurarmonil or noroline or novoptotect or novo‐triptyn or redomex or saroten or sarotex or sylvemid or syneudon or trepiline or triptafen* or tryptal or trypizol or tryptanol or tryptine or deprelio or diapatol or etafron or limbatril or limbritol or limbrityl or longopax or mutabase or mutabon or nobitrol or pantrop or parks‐plus or pms‐levazine or sedans or triavil or triptafen or AMOXAPINE or amopax or amoxan or asendin or asendis or defanyl or demelox or demolox or BUTRIPTYLINE or evadene or evadyne or evasidol or CHLORPOXITEN or CLOMIPRAMINE or anafranil or hydiphen or maronil or novo‐clopamine or placil or tranquax or DEMEXIPTILINE or tinoran or DESIPRAMINE or deprexan or norpramin or nortimil or pertofran or pertofrane or petylyl or sertofren or DIBENZIPIN or noveril or victoril or DOTHIEPIN or dosulepin or dothep or idom or jardin or prepadine or prothiaden or protiaden or protiadene or thaden or xerenal or harmomed or prothiadene or DOXEPIN or adapin or aponal or curetin or deptran or desidox or doneurin or gilex or mareen or quitaxon or sinequan or sinquan or sinquane or triadapin or xepin or zonalon or IMIPRAMINE or apo‐imipramine or impril or janimine or novopramine or presamine or primonil or sk‐pramine or tofranil or LOFEPRAMINE or amplit or deftan ordefton‐70 or deprimil or emdalen or gamanil or gamonil or lomont or lopramine or timelit or tymelyt or MELITRACEN or dixeran or melixeran or trausabun or deanxit or METAPRAMINE or NORTRIPTYLINE or allegron or aventyl or martimil or nortab or noritren or nortrilen or pamelor or paxtibi or sensaval or vividyl or benpon or dominans or motipress or motival or norfenazin or tropargal or NOXIPTILINE or OPIPRAMOL or ensidon or insidon or PROTRIPTYLINE or concordin or triptil or vivactil or QUINUPRAMINE or kevopril or kinupril or TIANEPTINE or stablon or TRIMIPRAMINE or apo‐trimip or herphonal or novo‐tripramine or rhotrimine or stangyl or surmontil or tydamine or TCA or Tricyclic*. These would include trials dealing with: AMESERGIDE, AMINEPTINE, AMITRIPTYLINE, AMOXAPINE, BUTRIPTYLINE, CHLORPOXITEN, CLOMIPRAMINE, DEMEXIPTILINE, DESIPRAMINE, DIBENZIPIN,DOTHIEPIN, DOXEPIN,IMIPRAMINE, LOFEPRAMINE, MELITRACEN, METAPRAMINE, NORTRIPTYLINE, NOXIPTILINE, OPIPRAMOL, PROTRIPTYLINE, QUINUPRAMINE, TIANEPTINE, TRIMIPRAMINE.
2. Reference search The references of all selected studies were inspected for more published reports and citations of unpublished research. In addition, other relevant review papers were checked.
3. SciSearch All the selected studies were sought as a citation in the SciSearch in order to identify more studies.
4. Personal communication To ensure all RCTs are being identified, the authors of significant papers and other experts in the field were contacted (FM Quitkin, ES Paykel, G Lewis, and authors of included trials).
Data collection and analysis
1. Selection of trials Two reviewers (HM and TAF) hand searched hard copies of 2418 references identified by the search strategy in the CCDANCTR, which contained 11740 records as of November 2000, for trials meeting the following broad and simple criteria. 1) randomised trial 2) any form of depression (including non‐operationalised diagnoses) 3) low dosage TCA against placebo or low dosage TCA against standard dosage of the same TCA The inter‐rater reliability of the two raters was good (percentage agreement=97%, kappa=0.61). All the candidate papers identified by either of the two raters were then subjected to the next stage of critical appraisal according to the strict eligibility criteria (n=138).
Two independent reviewers (TAF and CB) examined the strict eligibility of these 138 trials. The eligibility criteria consisted of six items which operationalised the above‐listed criteria for considering studies. The wordings of one of the eight items was found ambiguous in the course of the appraisal and was hence modified. The inter‐rater reliability of these eligibility criteria was excellent, with weighted kappas between 0.58 and 0.86. We arrived at 43 studies which compared low dosage TCA versus placebo, and 6 studies which compared low dosage TCA versus standard dosage of the same TCA. Two studies were in common. Once this preliminary list of selected studies became available, their references along with references of other relevant review papers were checked by TAF for further reports. 91 studies were identified. Nine of the most representative studies were subjected to SciSearch by HM in order to identify more recent reports, which resulted in 165 references. Authors of significant papers and other experts in the field were contacted, who pointed to eight studies. Out of these studies, 12 were found to meet the strict eligibility criteria.
2. Quality assessment Two independent reviewers (TAF and CB) assessed the methodologic quality of the selected studies. The criteria for the quality assessment are based on the recommendations of the Cochrane Collaboration Handbook (Mulrow 1997). Firstly, on the basis of explicit criteria, quality of randomisation in treatment conditions was assessed and trials was assigned to one of the three categories: A: adequate concealment, B: unclear concealment, and C: inadequate concealment. There is empirical evidence that quality of randomisation can produce biased results (Schulz 1995; Moher 1998; Chalmers 1983). Secondly, based on the statements in the studies, the quality of double blinding was rated as A: double‐blind, B: unclear blinding, and C: not blind. There is some evidence to suggest that trials that are not double blind yield biased results (Schulz 1995; Colditz 1989). The inter‐rater reliability of the two validity criteria was satisfactory, with weighted kappas of 0.58 and 0.79 respectively.
3. Data extraction Two reviewers (TAF and HM) independently extracted data from the original reports using data extraction forms. Any disagreement was resolved by consensus between the two or, where necessary, between all three reviewers.
4. Data synthesis Data were entered into Review Manager 4.1 by TAF twice using the duplicate data entry facility. For dichotomous outcomes, relative risks and their 95% confidence intervals were calculated using random effects model, because random effects model RR has been shown to be superior in clinically interpretability and external generalisability than fixed effects models and odds ratios or risk differences (Furukawa 2002). Heterogeneity between studies was assessed by the Q statistic and by visual inspection of the results in the MetaView plots. If significant heterogeneity was suspected, sources were investigated. For dichotomous outcomes of response, we adopted two analytical strategies. We first performed "per protocol" analysis according to the values reported by the original authors. When data on dropouts were included, usually by way of the last‐observation‐carried‐forward (LOCF) method, we analysed them according to the primary studies. We also performed a "worst case scenario" intention‐to‐treat (ITT) analysis whereby dropouts were considered non‐responders in the active treatment group but as responders in the placebo group. For continuous outcomes, the standardized weighted mean difference (SMD) were calculated using random effects model. Continuous outcomes were analysed on an endpoint basis, including only patients with a final assessment or with a last observation carried forward to the final assessment. Strict ITT analysis is not feasible with continuous outcomes as studies perform only LOCF or endpoint analyses.
5. Subgroup analyses Subgroup analyses should be performed and interpreted with caution because multiple analyses will lead to false positive conclusions (Oxman 1992). However, we performed the following subgroups analyses, if possible, for the following a priori reasons. 1) for older people (age>=65) separately, because older people may be more vulnerable to side effects associated with TCAs and decreased dosage is often recommended for them (DGP 1993) 2) for psychiatric patients and primary care patients separately, because it is sometimes believed that results obtained from either of these settings may not be straightforwardly applicable to the other setting (DGP 1993). 3) for very low dosage (imipramine or equivalent <= 50 mg/day) separately, because it is possible that, while low dosage TCA defined as <= 100 mg/day in general may be more effective than placebo, it is nonetheless possible that very low dosage may not be. For some physicians prescription of very low dosage appears to be a common practice.
6. Funnel plot analysis and Sensitivity analyses Funnel plot analysis was performed to check for publication bias. The following sensitivity analyses was performed, if possible, in order to examine the robustness of the observed findings. 1) All the analyses were repeated while limiting the included studies to those using operationalised diagnostic criteria for major depression. 2) Because criteria for including studies in this review only required that TCA be administered 100 mg/day or less on average, some might confute that the observed effectiveness of low dosage TCA might be due to the minority of the patients who were on more than 100 mg/day. While our overall results argue persuasively against the accepted condemnation that people with depression are undertreated because they are not administered more than 100 or 125 mg/day of TCAs on average (or the majority are administered less than 100 or 125 mg/day of TCAs), in order to examine if 100 mg/day or less of TCA was truly better than placebo, we limited the analyses to those whose maximum dosage was 100 mg/day or less.
Results
Description of studies
See Table of Included Studies. All in all, we found 35 studies (2013 participants) which compared low dosage TCA against placebo, and six studies (551 participants) which compared low dosage TCA against standard dosage of the same TCA. Two were in common, i.e. they had three arms of standard dosage TCA, low dosage TCA and placebo. Three studies were from 1960s, 14 from 1970s, 12 from 1980s and 10 from 1990s.
Methods All included studies were randomised.
Participants In all of the included studies, at least the majority of the participants were judged depressed according to some definition. 15 studies employed one of the internationally standard diagnostic criteria for major depression. A number of studies included patients with dysthymia but a separate subgroup analysis for long‐standing depression was not feasible as the original studies did not report the results separately for them.
Interventions Out of the 39 included studies, 16 used amitriptyline and 13 used imipramine as active drugs. The remaining RCTs studied clomipramine (3), doxepine (3), dothiepin (2), trimipramine (2), and lofepramine (1). (One study used both amitriptyline and imipramine). Of the 39 trials, 18 used fixed dosing schedule and 21 used flexible dosing schedule. Of the latter 21, the maximum dose allowed was still <= 100 mg/d in 12 studies; 9 studies (Burch(58vs144); Goldberg(78); Goldberg(92); Hormazabal(86); Reifler(83); Rouillon(98); Schweizer(89); Tyrer(51); Weissman(98)), allowed maximum dose above 100 mg/d but the average dose achieved on average was still <= 100 mg/d. 18 trials were of 4‐week duration. 17 trials lasted for six to eight weeks; four trials lasted longer than 3 months.
Outcomes 19 studies used some version of the Hamilton Rating Scale for Depression, and 5 used Montgomery‐Asberg Depression Scale. The others used Beck Depression Inventory, Zung Self‐Rating Depression Scale or some ad hoc rating scales. Six studies (Hormazabal(86); Jacobson(75‐100); Petracca(100); Robertson(75); WHO‐Cali(75vs150); DUAG(25‐75vs125‐200)) did not report the standard deviations for their HRSD scores. We therefore substituted them by the pooled standard deviations obtained from all the studies examined in a systematic review of the antidepressant treatment of depression (Joffe 1996). Some studies did not report the response rates for depressive severity, defined by many of the original authors as 50% or greater reduction in the HRSD score. We therefore imputed the values by assuming the normal distribution for the HRSD scores at each time point and calculating the number of subjects below half the baseline HRSD score. We employed this imputation method in our previous meta‐analysis and found that the agreement between the actually reported and the imputed values was ANOVA ICC of 0.99 (95% CI: 0.97 to 0.99) (Furukawa 2001). In the current dataset, it was 0.98 (0.95 to 0.99). Some studies did not specify dropouts due to side effect. Some studies did not report the rate of patients complaining of any side effects while reporting individual rates for various side effects; in this case, the largest of all the reported rates was substituted for the rate of patients complaining of any side effect.
Excluded studies Twelve studies were excluded because, although they did administer depression severity scales, the participants in the trials were not diagnosed with depression according to any clinical or diagnostic criteria. See Table of Excluded Studies.
Risk of bias in included studies
Allocation concealment Only four studies (Blashki(75&150); Nandi(97); Rampello(100); Robertson(75)) reported enough details on their randomisation procedure for us to be sure that their allocation was satisfactorily concealed. All the others did not make fully clear how they undertook allocation to the intervention groups.
Blinding All of the included studies described themselves as "double‐blind."
Dropouts The average dropout rate of the included studies was 24%. None of the trials lost more than half of their patients before end of trial.
Effects of interventions
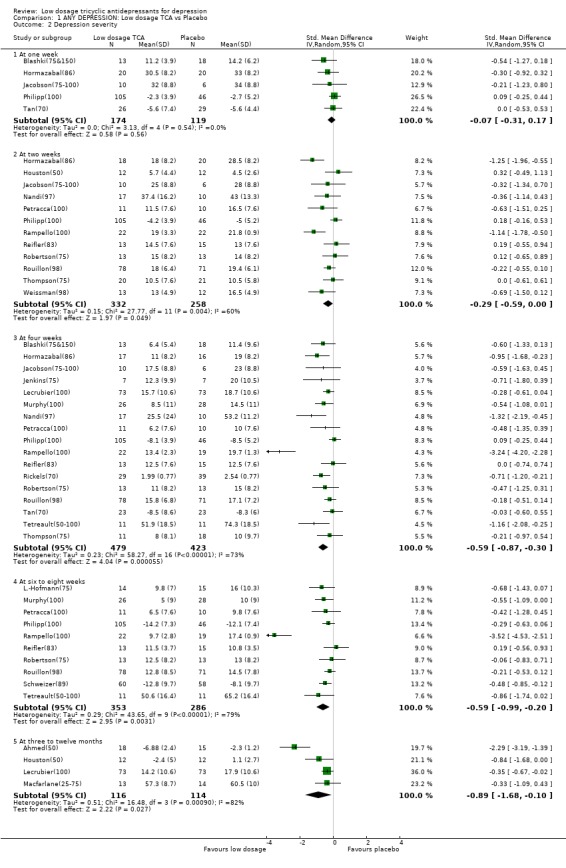
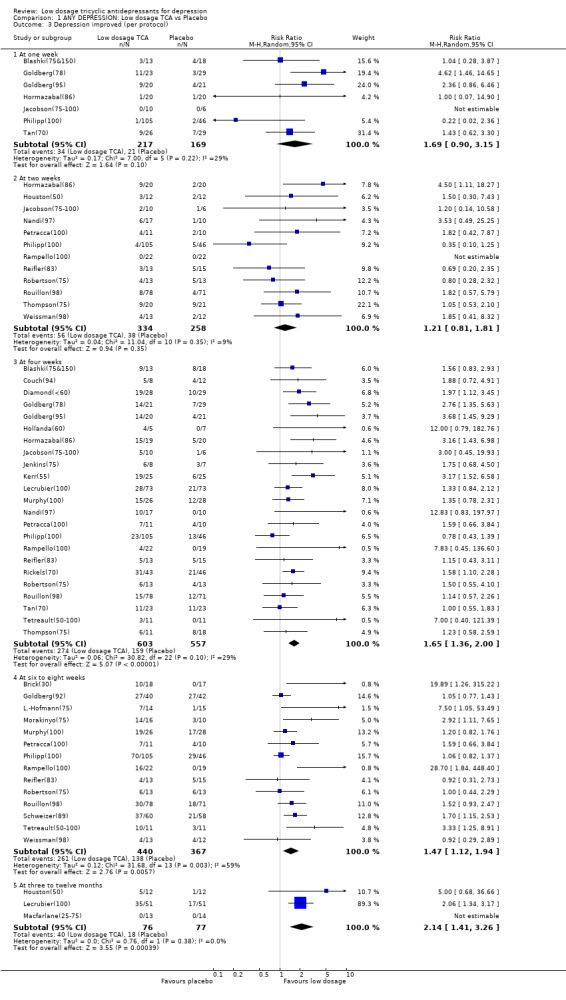
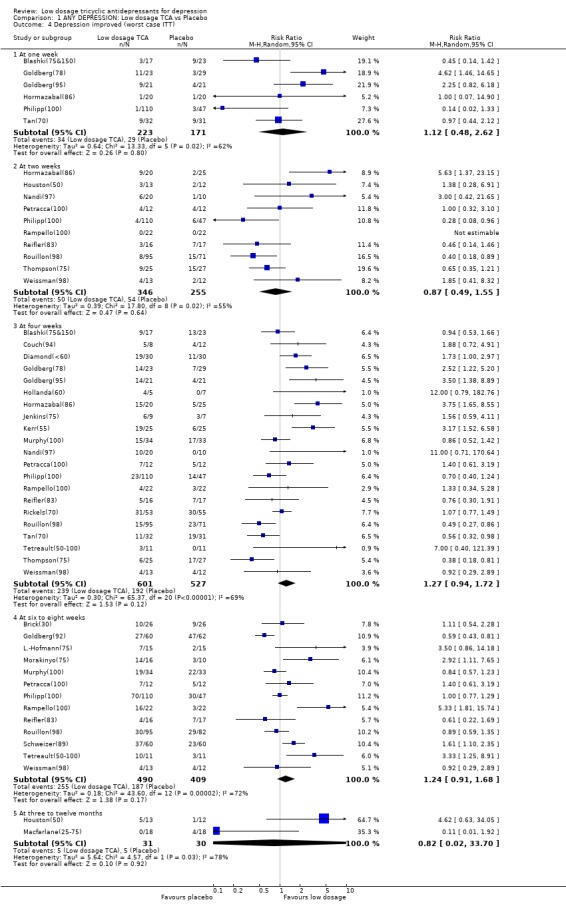
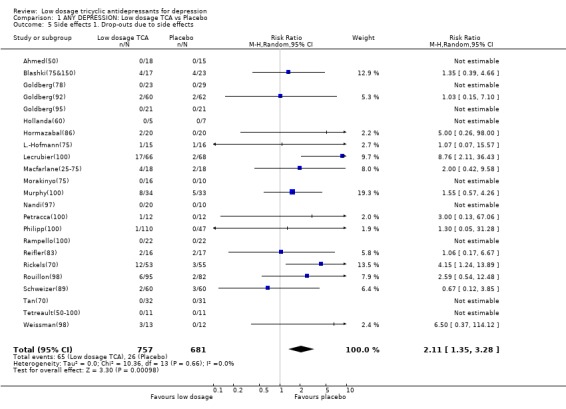
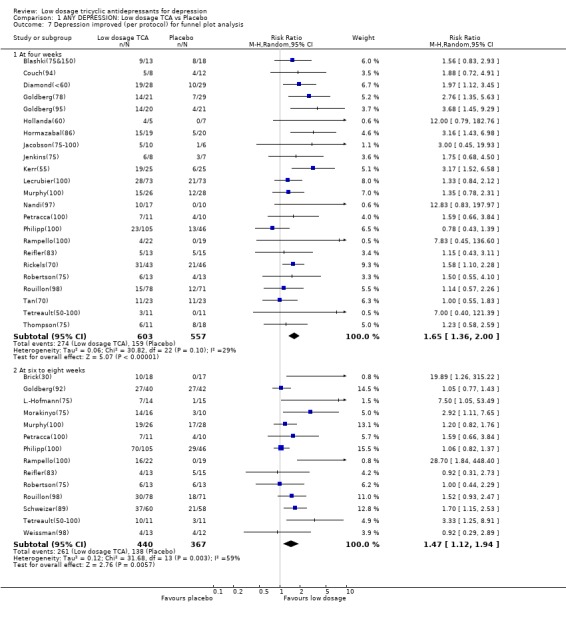
1. Low dosage TCA versus placebo for depression according to any definition 1.1. Effectiveness Low dosage TCA, mostly between 75‐100 mg/day, was 65% (random effects model 95%CI: 36 to 100%), 47% (12 to 94%) and 114% (41 to 226%) more likely than placebo to bring about response at 4 weeks, 6‐8 weeks and 3‐12 months, respectively. Statistical heterogeneity was noted only for the outcome at 6‐8 weeks; visual inspection revealed two outlying studies both of which reported results extremely favourable to TCA in comparison with placebo (RR=19.9 by Brick(30) and RR=28.7 by Rampello(100)). Excluding these studies reduced the heterogeneity to p=0.078 and yet the relative benefit increase remained largely unchanged at 34% (95%CI: 9 to 66%). This advantage of the low dosage TCA did not hold, however, when we undertook the very strict intention‐to‐treat analyses based on the worst case scenario, assuming all dropouts in the treatment arm to be non‐responders and all dropouts in the placebo arm to be responders. The effectiveness was corroborated by secondary analyses based on continuous measures. People on low dosage TCA showed depression severity scores which were 0.29 (random effects model 95%CI: 0 to 0.59), 0.59 (0.30 to 0.87), 0.59 (0.20 to 0.99) and 0.89 (0.10 to 1.68) standard deviations lower than those on placebo at 2, 4, 6‐8 weeks and 3‐12 months, respectively. Statistical heterogeneity was noted for all these time periods. Excluding Rampello lessened the heterogeneity and the superiority of low dosage TCA over placebo remained statistically significant at 4, 6‐8 weeks and 3‐12 months.
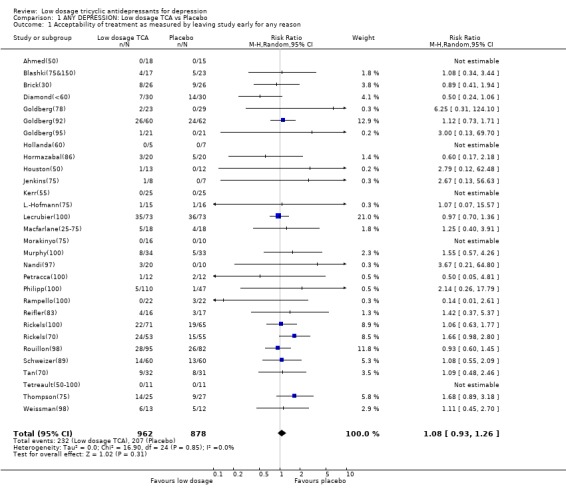
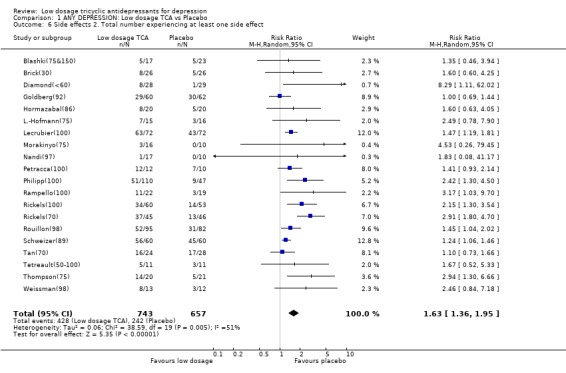
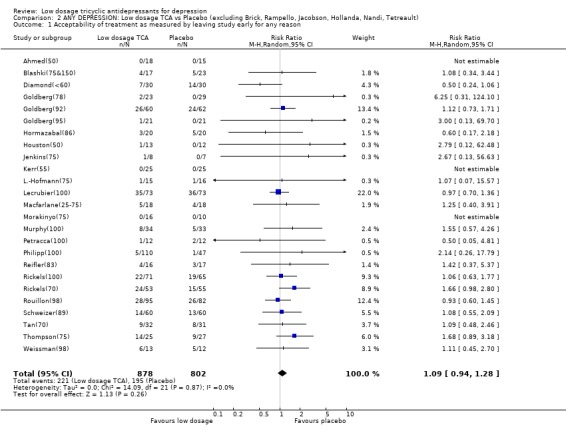
1.2. Acceptability Overall there was no difference in dropouts between low dosage TCA and placebo (RR=1.08, 95%CI: 0.93 to 1.26). However, people on low dosage TCA were 111% (35 to 228%) more likely to drop out due to side effects than those on placebo. The former were also 63% (36 to 95%) more likely to experience at least one side effect.
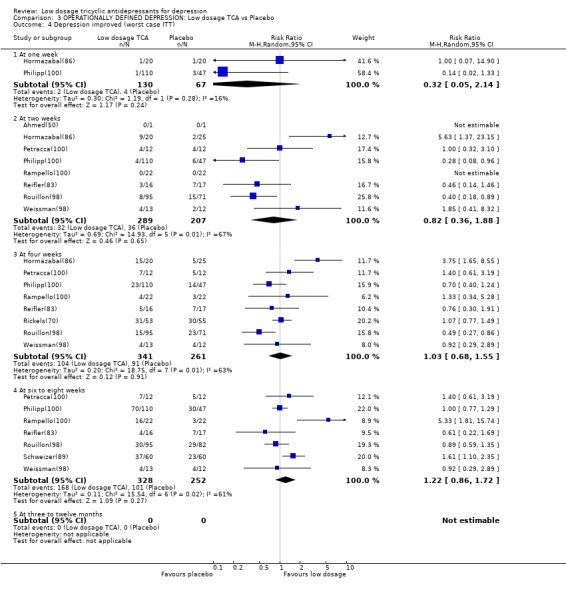
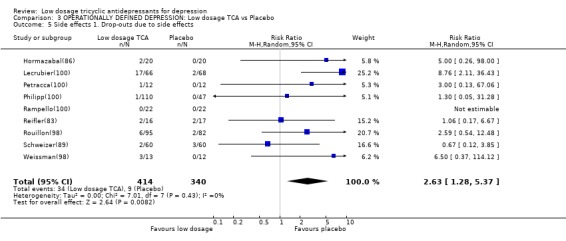
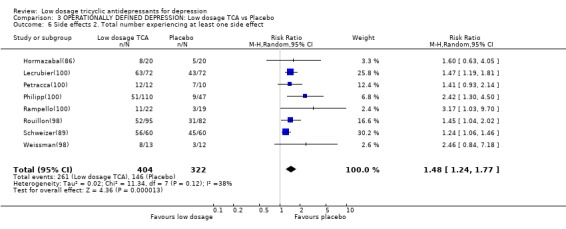
2. Sensitivity analyses 2.1. Low dosage TCA versus placebo for operationally defined depression When we limited the included studies to those which used operational diagnostic criteria for depression, the results were essentially identical. 2.1.1. Effectiveness Low dosage TCA was 40% (9 to 79%), 24% (3 to 49%) and 106 (34 to 217%) more likely than placebo to bring about response at 4 weeks, 6‐8 weeks and at 6 months. None of the tests for heterogeneity was significant and visual inspection did not reveal any outlier. This advantage for the low dosage TCA did not hold, again, under the worst case scenario intention‐to‐treat analyses. Meta‐analyses based on continuous data, however, were in favour of low dosage TCA at 2 weeks, 4 weeks, 6‐8 weeks and at 6 months. 2.1.2. Acceptability Again there was no difference between low dosage TCA and placebo in terms of acceptability of treatment as measured by leaving study early for any reason (RR=0.98, 95%CI: 0.78 to 1.23). Patients were more likely to drop out or to experience some side effects on the active drug than on placebo (RR=2.63, 95%CI: 1.28 to 5.37, and RR=1.44, 95%CI: 1.23 to 1.68, respectively).
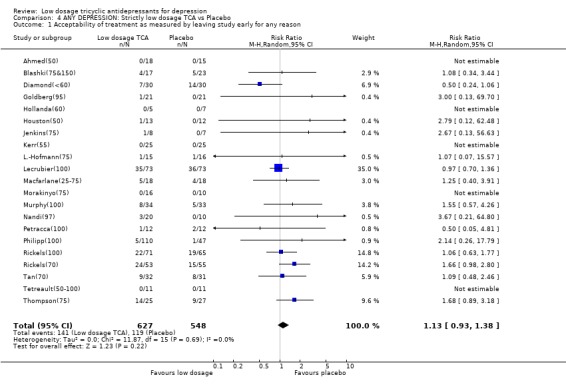
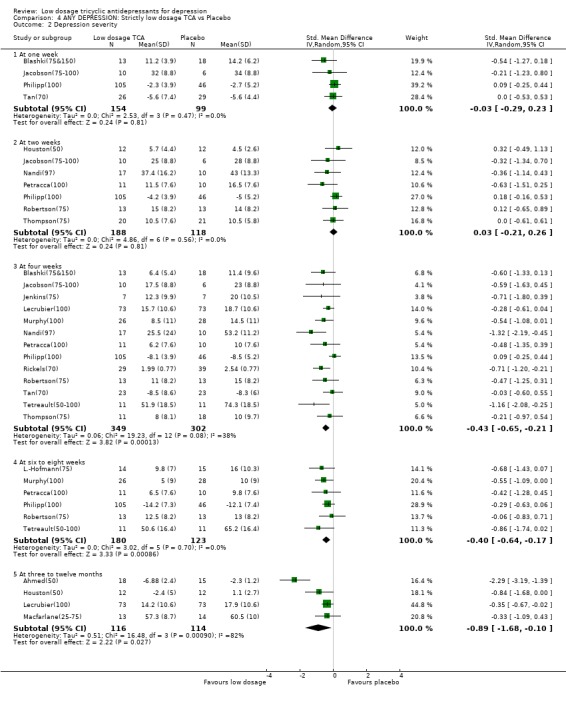
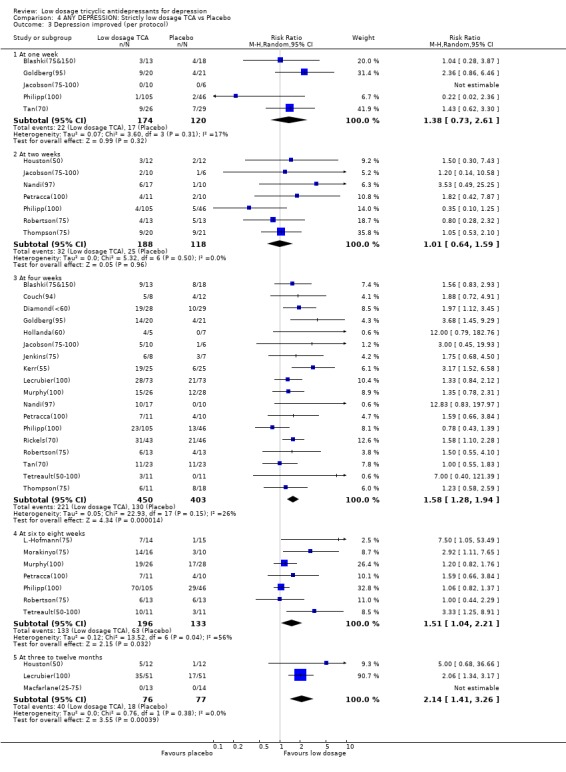
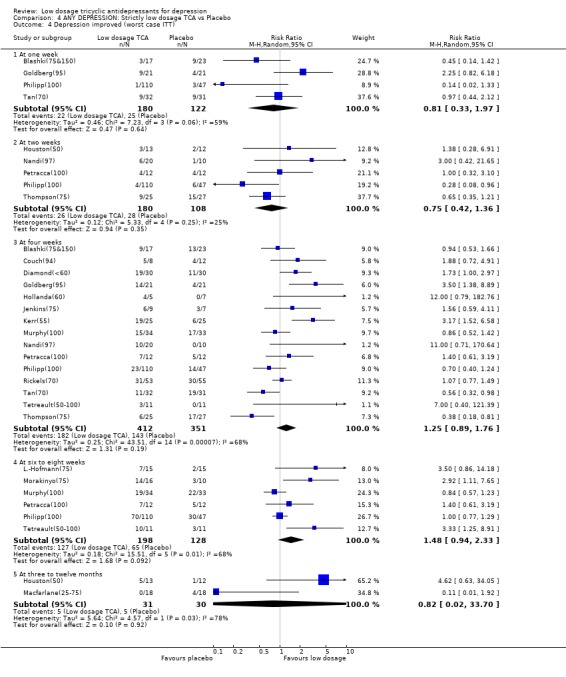
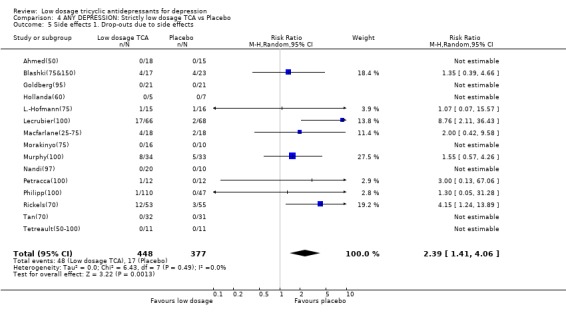
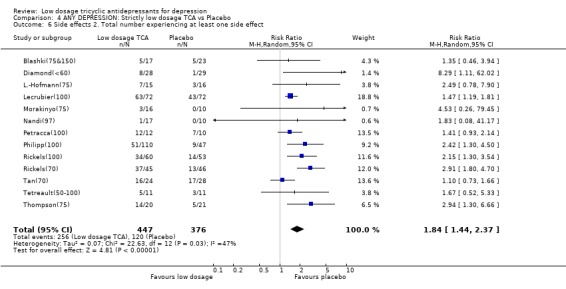
2.2. Strictly low dosage TCA When we limited the included studies to those whose maximum daily dosage of TCA was 100 mg or less, again, the results were unchanged. 2.2.1. Effectiveness Strictly low dosage TCA, i.e. less than 100 mg/day of TCA for all the patients in the active drug group, still was 58% (28 to 94%), 51% (4 to 121%) and 114% (41 to 226%) more likely than placebo to bring about response at 4 weeks, 6‐8 weeks and 3‐12 months. Although none of the worst case scenario intention‐to‐treat analyses resulted in statistically significant RRs, analyses based on the continuous measurement of depression severity supported the effectiveness of strictly low dosage TCA. The SMD was ‐0.43 (‐0.65 to ‐0.21) at 4 weeks, ‐0.40 (‐0.64 to ‐0.17) at 6‐8 weeks, and ‐0.89 (‐1.68 to ‐0.10) at 3‐12 months. 2.2.2. Acceptability This strictly low dosage TCA was still 139% (41 to 306%) more likely to produce drop‐outs due to side effects than placebo, and was 85% (44 to 137%) more likely to produce some side effects. The overall drop‐out rates did not differ between low dosage TCA and placebo.
2.3. Funnel plot analysis We visually inspected the funnel plot ordered by weights assigned to each study for the dichotomous outcome of response at 4 weeks in the MetaView. The plot was suggestive of the presence of some publication bias because the four studies smallest in the weights assigned reported extremely large RRs in favour of low dosage TCA. When we omitted these four smallest studies (Tetreault(50‐100); Nandi(97); Hollanda(60); Jacobson(75‐100)), however, the plot no longer looked asymmetrical and the RR decreased only slightly from 1.64 (1.35 to 1.98) to 1.58 (1.31 to 1.90). It must be borne in mind, however, that there were very few large trials (the largest one involved 151 patients), allowing precise estimation of confidence intervals and thus clear interpretation of a funnel plot.
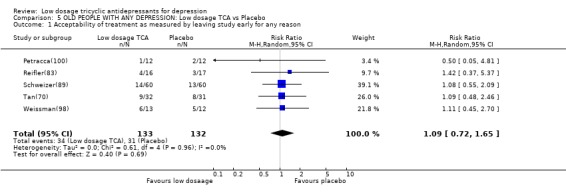
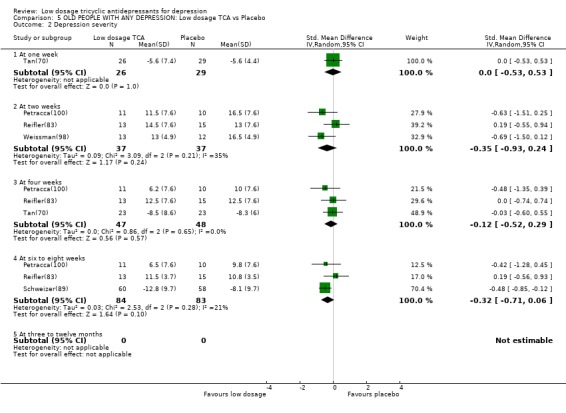
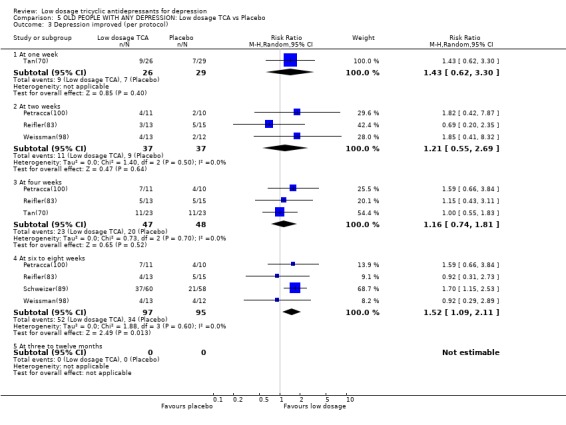
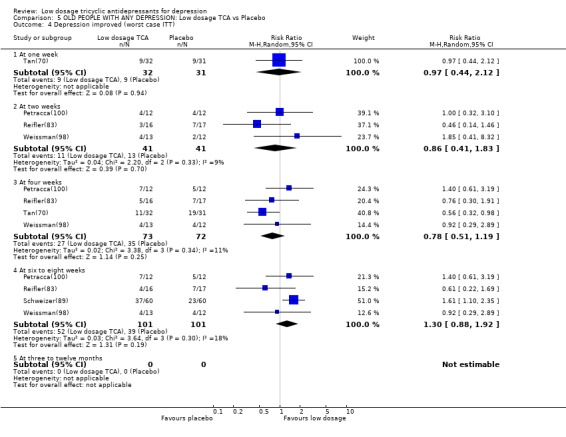
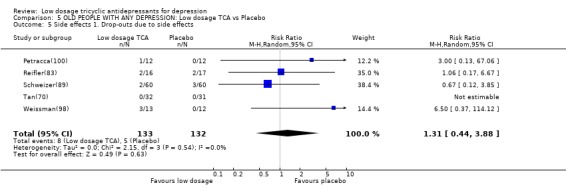
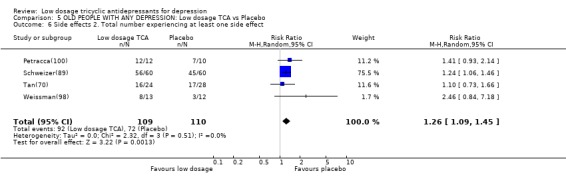
3. Subgroup analyses Based on these sensitivity analyses, we judged that we did not need to restrict ourselves to the studies employing operationally diagnostic criteria or to those which administered strictly low dosage TCA in order to arrive at conclusions generalisable to our present day patients. The following subgroup analyses therefore deal with studies treating any depression. 3.1. Old people Only five studies (Petracca(100); Reifler(83); Schweizer(89); Tan(70); Weissman(98)) explicitly dealt with depression in people of 65 years or older (n=265). Due to lack of power, the meta‐analysis of these five studies produced a few statistically significant findings only. The old people on low dosage TCA was more likely to show response at 6‐8 weeks than placebo, but they were also more likely to experience at least one side effect (RR=1.52, 95%CI: 1.09 to 2.11 and RR=1.26, 95%CI: 1.10 to 1.45, respectively). The point estimates of the obtained RRs and SMDs were in accordance with the overall results.
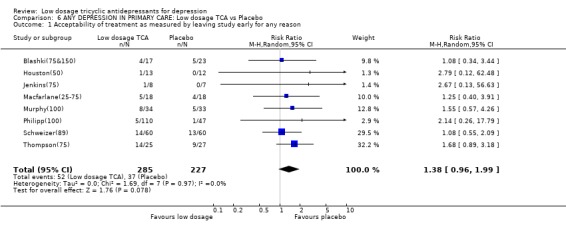
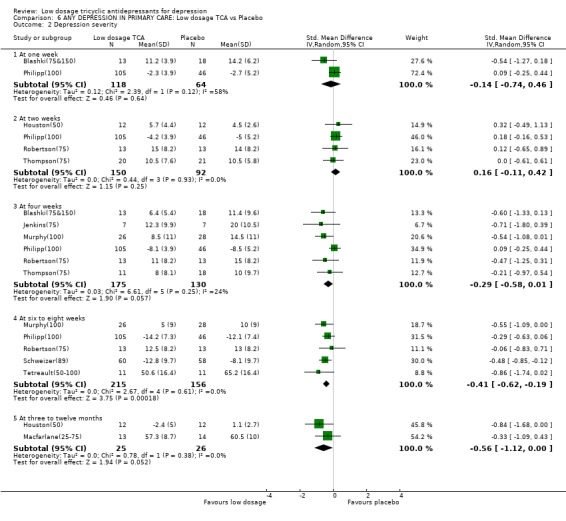
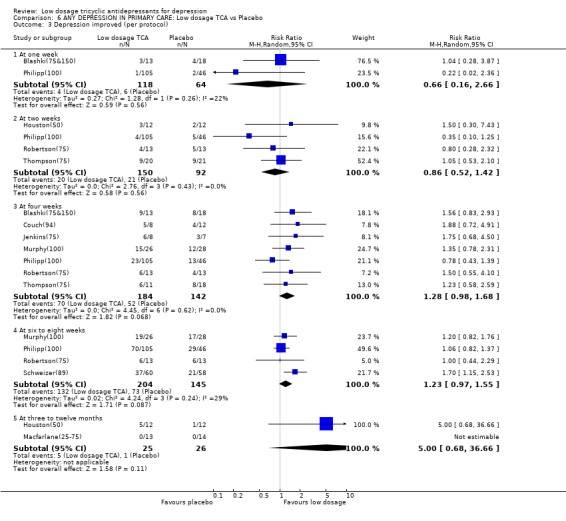
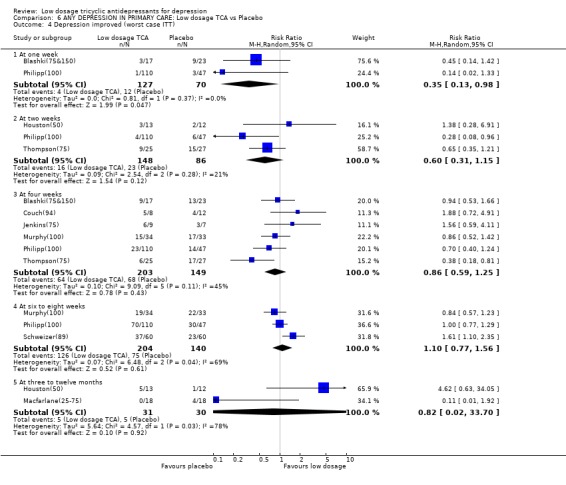
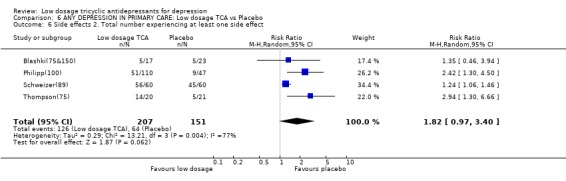
3.2. Primary care settings Five studies (Blashki(75&150); Houston(50); Murphy(100); Philipp(100); Thompson(75)) recruited patients with depression in primary care settings; five further studies (Couch(94); Jenkins(75); Macfarlane(25‐75); Robertson(75); Schweizer(89)) included patients with various physical conditions such as migraine, low back pain and rheumatoid arthritis presumably in primary care settings. Altogether there were 558 participants. Although there were few other statistically significant findings, especially with random effects model, the resulting 95% CIs were compatible with the overall findings. For example, at 4 weeks, participants on low dosage TCA were 28% (random effects model 95%CI: ‐2% to 68%) more likely to show response than placebo; at 6‐8 weeks, the former were 23% (‐3% to 55%) more likely to do so.
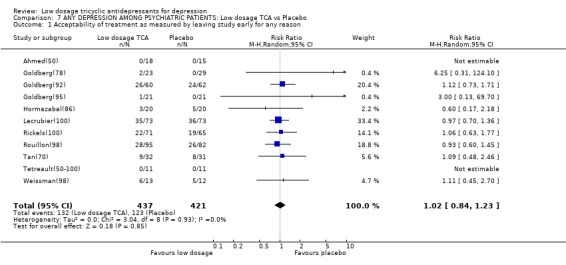
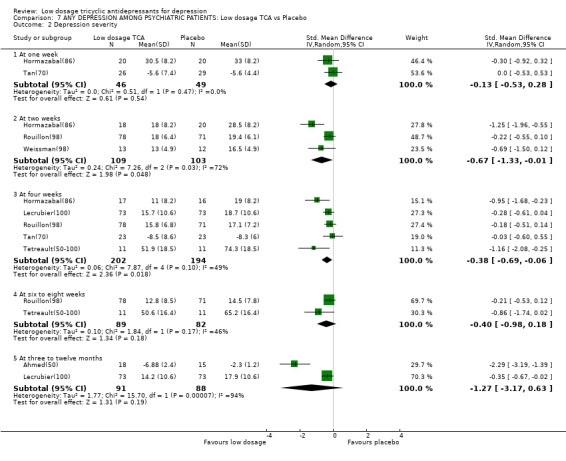
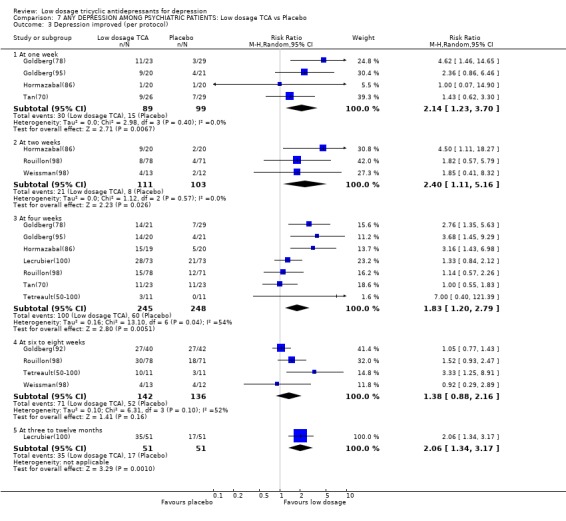
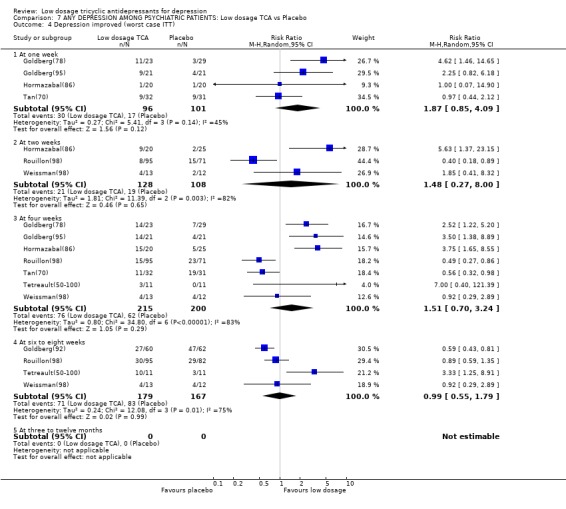
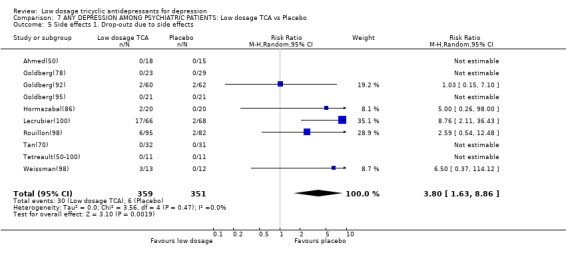
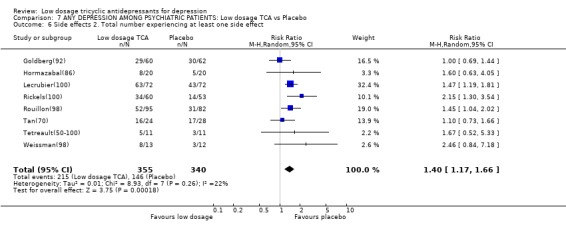
3.3. Psychiatric settings On the other hand, we also meta‐analysed such studies only which made clear that they were conducted with patients seen in psychiatric settings and not comorbid with other major psychiatric disorders such as eating disorders or Alzheimer's disease. 12 studies (n=912) were available (Ahmed(50); Goldberg(78); Goldberg(92); Goldberg(95); Hormazabal(86); Lecrubier(100); Rickels(100); Rouillon(98); Tyrer(51); Weissman(98); Tan(70); Tetreault(50‐100)); two of these were with inpatients (Tan(70); Tetreault(50‐100)) and the others with outpatients. Among the psychiatric patients, the random effects model RR for showing response on low dosage TCA rather than on placebo was 2.14 (95%CI: 1.23 to 3.70) at 1 week, 2.40 (1.11 to 5.16) at 2 weeks, 1.83 (1.20 to 2.79) at 4 weeks, 1.38 (0.88 to 2.16) at 6‐8 weeks. The SMD also supported the effectiveness of low dosage TCA among psychiatric patients with depression. The TCA, however, was more likely to cause drop‐outs due to side effects or at least one side effect (RR=3.80, 95%CI: 1.63 to 8.86 and RR=1.40, 95%CI: 1.17 to 1.66, respectively).
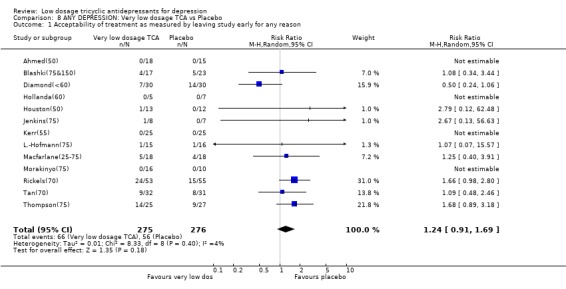
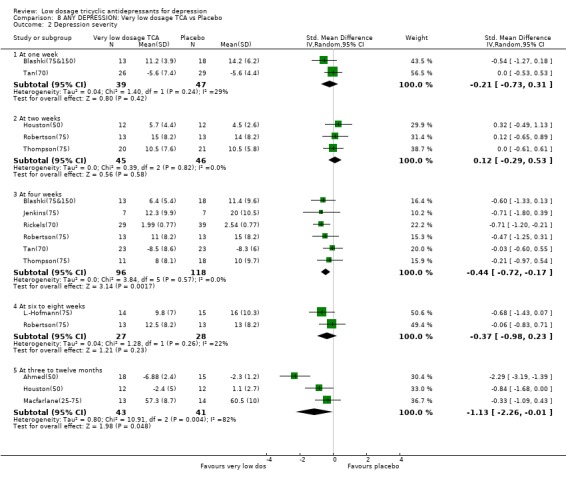
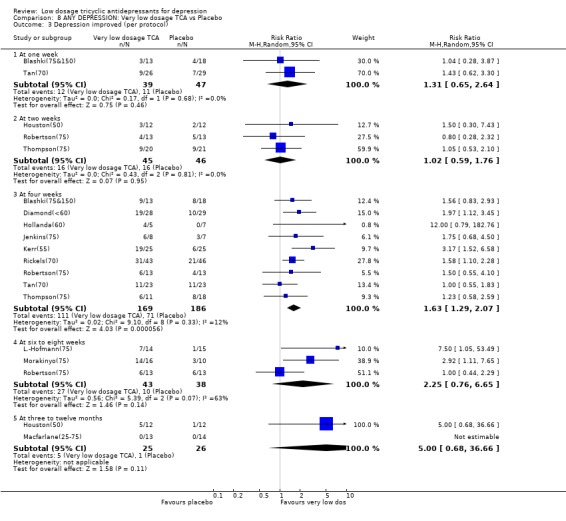
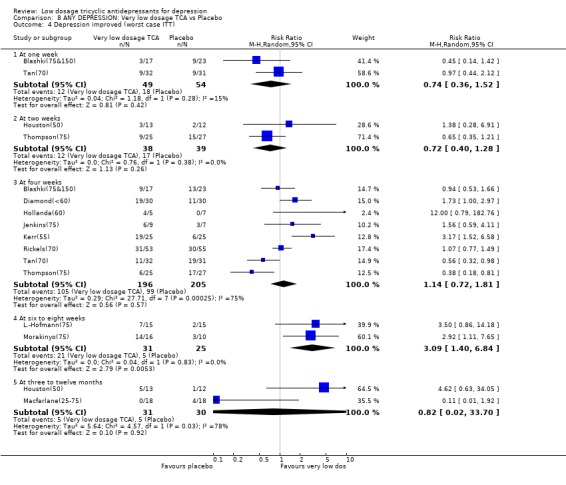
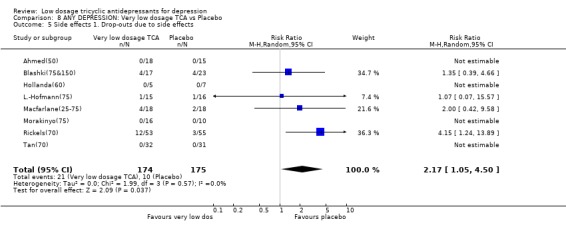
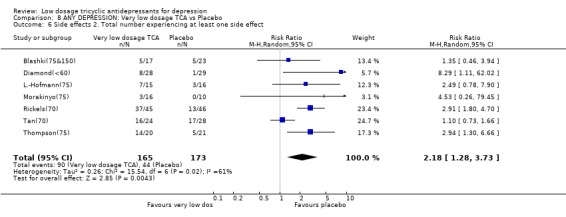
3.4. Very low dosage TCA Unfortunately there was only one study which administered very low dosage (imipramine or equivalent <= 50 mg/day) (Ahmed(50)). We therefore revised our original protocol and essayed a meta‐analysis of all studies which administered, on average, less than 75 mg/day of imipramine or equivalent (n=16). Patients on less than 75 mg/day of TCA were still more likely to show response than those on placebo at 4 weeks (RR=1.63, 95%CI: 1.29 to 2.07) and possibly at 6‐8 weeks (2.25, 95%CI: 0.76 to 6.65). The corresponding SMD in depression measurements was ‐0.44 (‐0.72 to ‐0.17) and ‐0.37 (‐0.98 to 0.23). On this minimal dosage, patients were still more likely to drop out due to side effects (RR=2.17, 95%CI: 1.05 to 4.50) or to experience at least one side effect (RR=2.18, 95%CI: 1.28 to 3.73). The overall drop‐out rates did not differ between the active drug or the placebo arms.
4. Low dosage TCA versus Standard dosage TCA for depression according to any definition 4.1. Effectiveness In terms of the response rate, the standard dosage TCA was not statistically significantly more effective than low dosage TCA at one through eight weeks, both in the per protocol analysis and in the worst case scenario ITT analysis. RR was 0.89 (random effects model 95%CI: 0.74 to 1.07) at 4 weeks and 1.10 (0.76 to 1.61) at 6‐8 weeks in the per protocol analysis. It was 1.17 (0.98 to 1.40) at 4 weeks and 1.14 (0.84 to 1.53) at 6‐8 weeks in the worst case ITT analysis. In the worst case scenario ITT we assumed all the dropouts in the low dosage TCA arm to have responded and all those in the standard dosage TCA arm to have failed to respond. This extreme scenario was to guard against favouring the standard dosage TCA prescription which was the more harmful. If the standard dosage TCA regimen proved to be more effective than low dosage TCA regimen even under this extreme assumption, then we could be very confident that is does work in spite of the increase side effects. In terms of the SMD, however, the standard dosage TCA outperformed the low dosage TCA at 4 weeks (SMD=0.29, 95%CI: 0.08 to 0.50) but not at 6‐8 weeks (SMD=0.14, ‐0.90 to 1.18).
4.2. Acceptability Overall there was no difference in the acceptability of the treatments when measured by leaving study early for any reason (RR=0.95, 95%CI: 0.75 to 1.20). However, the low dosage regimen was 55% (95%CI: 24 to 73%) less likely than standard dosage regimen to produce drop‐outs due to side effects. The percentage of patients experiencing at least one side effect did not differ between the two groups (RR=1.09, 95%CI: 0.86 to 1.37).
Discussion
Although random effects model RR, which was our primary summary effect measure defined a priori, failed to show statistically significant superiority of standard over low dose TCAs, post hoc analyses revealed that fixed effects model OR, RR and RD were indeed statistically significant for the per protocol comparison at 4 weeks. For the same data set, random effects model OR and RR were not significant whereas random effects model RD was. We further found that, at 6‐8 weeks, none of OR or RR or RD was significant by any analytical method. The very fact that the results vary according to meta‐analytic methods weakens our confidence in the statistically significant findings of some of these analyses. Moreover, the findings at 4 weeks were in the opposite direction from those at 6‐8 weeks. Because we failed to find clearly significant differences between the low dose and standard dose regimens, the comparison between them is an equivalence problem and need be more closely examined based on estimation with 95% confidence intervals. Based on the random effects model RR (Furukawa 2002) and the plausible range of the patient expected event rate (let's assume that response rate could range between 50% to 70% among those receiving standard dosage), the absolute benefit increase of standard dosage over low dosage was 6 to 8% (95%CI: ‐5% to 18%) at 4 weeks and ‐6 to ‐8 weeks (95%CI: ‐43% to 17%) at 6‐8 weeks. At the same time, the available data show that the absolute risk increase of dropouts due to side effects might be 9% (95%CI: 4% to 12%). Thus our findings do not rule out clinically important benefit increase on standard dosage over low dosage, while they clearly point to an approximately equal number of patients dropping out for side effects.
At face value, then, our findings suggest the following. Firstly, low dosage TCA between 75‐100 mg/day and possibly below this range brings about more reduction in depression at four to eight weeks of treatment and beyond, as well as more dropouts due to side effects and more people suffering from at least one side effect than placebo. Given the average control event rate in the included studies, the number needed to treat (NNT) to bring about response in depression was around 6 at 1 through 6 months of treatment. Although the overall acceptability of treatment did not differ between low dosage TCA and placebo, the former showed a number needed to harm (NNH) of around 24 to produce one dropout due to side effects. Secondly, similar clinical effectiveness was observed for all the subgroups examined, namely elderly people, patients seen in primary care and those in psychiatric settings. Thirdly, standard dosage TCA may or may not be able to bring about more reduction in depression than low dosage TCA. However, it certainly causes more dropouts due to side effects than placebo (NNH was around 11), although the overall acceptability of treatment and the number of people suffering from at least one side effect did not differ between the two dosage regimens.
Being definite about results from these data is not easy, however. The strength of recommendations to be based on our findings is compromised by the following factors. Firstly, the quality of the included studies was not ideal. The success of blinding was not ascertained in any. Many studies did not employ standardised diagnostic criteria and interview schedules to diagnose depression. Some studies used ad hoc outcome measures of unknown reliability and validity. Although the dropout rates were not high overall, as our worst case scenario ITT analyses show, they were large enough to hamper drawing definitive conclusions. The dropout is always a problem but here it is a bigger problem because, in the case of low dosage TCA, there is a trade‐off between response and dropouts. If dropouts aren't handled the correct way, the higher dosage always wins because it increases response (at the expense of dropouts). Many were small scale studies and the funnel plot analysis was suggestive of some publication bias. Secondly, the quality of reporting in the included studies was not ideal. We are not sure if the random allocation was adequately concealed in the majority of the studies. Some studies failed to report standard deviations for their outcome measures. Thirdly, and perhaps because of the above factors, we noted statistical heterogeneity for some of the pooled results. A few studies were extreme outliers, all in favour of the active treatment (low dosage TCA). Lastly, most of the included studies lasted up to eight weeks only. We evaluated the seriousness of these shortcomings with several sensitivity analyses. Skepticism about the very positive results of a series of small studies raised questions about a positive bias in estimation of treatment effect. A conservative (in terms of avoiding a positively biased assessment of treatment effect) approach would omit the very positive small studies. Having done so, many of the pooled analyses were no longer heterogeneous and yet showed little changes in RRs and SMDs. Limiting the studies to those which employed modern operational diagnostic criteria for depression or to those which used strictly low dosage regimens did not materially affect the pooled estimates of RRs and SMDs .
These sensitivity analyses greatly strengthen the inferences that in the treatment of depression, tricyclics at dosages lower than the usually recommended range are more effective than placebo but possibly a little bit less effective than standard dosage tricyclics although with fewer side effects. Thus the currently available best evidence suggests that academicians have been on very weak ground when they criticized clinicians for use of low dose TCAs and that administration of low dose TCAs is an easily defensible practice. The grim fact remains that, in the 50 years of the history of the science of psychopharmacology the minimum effective dosage and the effective dosage ranges for antidepressants ‐ a simple set of numbers that every practicing physician and patient would want to know ‐ remains unestablished.
Authors' conclusions
Implications for practice.
In the treatment of depression, tricyclic antidepressants in the range between 75‐100 mg/day and possibly below this range are more effective than placebo. They may or may not be as effective as standard dosage tricyclics but result in fewer dropouts due to side effects. The currently available best evidence supports the practice of clinicians who, despite the admonitions of academicians, choose low dose TCAs as the initial target dose.
Implications for research.
Firstly, our finding that low dosage TCA is more effective than placebo and that standard dosage TCA may be more effective than low dosage calls for a larger scale systematic review involving all placebo‐controlled trials with various dosages of TCA. We could then examine the dose‐response relationships in terms of effects and side effects across wide range of dosages. Secondly, however, we are lead to anticipate upfront that methodological weakness of the currently available primary studies would weaken inferences from the dose‐response relationships if observed. We therefore recommend that every RCT protocol should include strategies for ensuring follow up of all the participants even if they stop the prescribed medication. This is the only way to adhere to the intention‐to‐treat principle, and produce results permitting strong inferences about treatment effects. Only then can we definitively establish the relative benefits and harms of varying dosage ranges.
What's new
| Date | Event | Description |
|---|---|---|
| 2 November 2008 | Amended | Converted to new review format. |
History
Protocol first published: Issue 3, 2001 Review first published: Issue 3, 2003
| Date | Event | Description |
|---|---|---|
| 13 March 2003 | New citation required and conclusions have changed | Substantive amendment |
Notes
We do not intend to update this review regularly for the time being. Tricyclic antidepressants, although still often prescribed, are not considered by many to be the first choice drugs in the treatment of depression. Therefore, there may be less interest in this review itself.
CCDAN editorial base will conduct searches for new studies every two years.
Acknowledgements
The present research was supported in part by a research grant from St. Luke's Life Science Institute in Tokyo.
Data and analyses
Comparison 1. ANY DEPRESSION: Low dosage TCA vs Placebo.
| Outcome or subgroup title | No. of studies | No. of participants | Statistical method | Effect size |
|---|---|---|---|---|
| 1 Acceptability of treatment as measured by leaving study early for any reason | 30 | 1840 | Risk Ratio (M‐H, Random, 95% CI) | 1.08 [0.93, 1.26] |
| 2 Depression severity | 23 | Std. Mean Difference (IV, Random, 95% CI) | Subtotals only | |
| 2.1 At one week | 5 | 293 | Std. Mean Difference (IV, Random, 95% CI) | ‐0.07 [‐0.31, 0.17] |
| 2.2 At two weeks | 12 | 590 | Std. Mean Difference (IV, Random, 95% CI) | ‐0.29 [‐0.59, ‐0.00] |
| 2.3 At four weeks | 17 | 902 | Std. Mean Difference (IV, Random, 95% CI) | ‐0.59 [‐0.87, ‐0.30] |
| 2.4 At six to eight weeks | 10 | 639 | Std. Mean Difference (IV, Random, 95% CI) | ‐0.59 [‐0.99, ‐0.20] |
| 2.5 At three to twelve months | 4 | 230 | Std. Mean Difference (IV, Random, 95% CI) | ‐0.89 [‐1.68, ‐0.10] |
| 3 Depression improved (per protocol) | 31 | Risk Ratio (M‐H, Random, 95% CI) | Subtotals only | |
| 3.1 At one week | 7 | 386 | Risk Ratio (M‐H, Random, 95% CI) | 1.69 [0.90, 3.15] |
| 3.2 At two weeks | 12 | 592 | Risk Ratio (M‐H, Random, 95% CI) | 1.21 [0.81, 1.81] |
| 3.3 At four weeks | 23 | 1160 | Risk Ratio (M‐H, Random, 95% CI) | 1.65 [1.36, 2.00] |
| 3.4 At six to eight weeks | 14 | 807 | Risk Ratio (M‐H, Random, 95% CI) | 1.47 [1.12, 1.94] |
| 3.5 At three to twelve months | 3 | 153 | Risk Ratio (M‐H, Random, 95% CI) | 2.14 [1.41, 3.26] |
| 4 Depression improved (worst case ITT) | 28 | Risk Ratio (M‐H, Random, 95% CI) | Subtotals only | |
| 4.1 At one week | 6 | 394 | Risk Ratio (M‐H, Random, 95% CI) | 1.12 [0.48, 2.62] |
| 4.2 At two weeks | 10 | 601 | Risk Ratio (M‐H, Random, 95% CI) | 0.87 [0.49, 1.55] |
| 4.3 At four weeks | 21 | 1128 | Risk Ratio (M‐H, Random, 95% CI) | 1.27 [0.94, 1.72] |
| 4.4 At six to eight weeks | 13 | 899 | Risk Ratio (M‐H, Random, 95% CI) | 1.24 [0.91, 1.68] |
| 4.5 At three to twelve months | 2 | 61 | Risk Ratio (M‐H, Random, 95% CI) | 0.82 [0.02, 33.70] |
| 5 Side effects 1. Drop‐outs due to side effects | 23 | 1438 | Risk Ratio (M‐H, Random, 95% CI) | 2.11 [1.35, 3.28] |
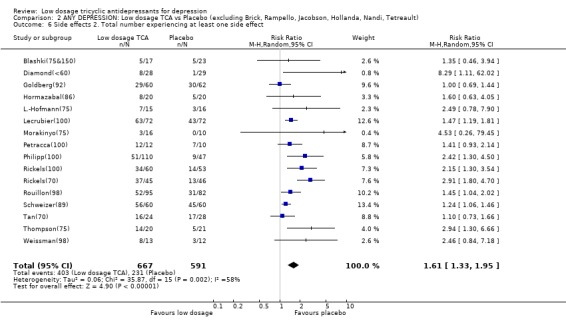
| 6 Side effects 2. Total number experiencing at least one side effect | 20 | 1400 | Risk Ratio (M‐H, Random, 95% CI) | 1.63 [1.36, 1.95] |
| 7 Depression improved (per protocol) for funnel plot analysis | 29 | Risk Ratio (M‐H, Random, 95% CI) | Subtotals only | |
| 7.1 At four weeks | 23 | 1160 | Risk Ratio (M‐H, Random, 95% CI) | 1.65 [1.36, 2.00] |
| 7.2 At six to eight weeks | 14 | 807 | Risk Ratio (M‐H, Random, 95% CI) | 1.47 [1.12, 1.94] |
1.1. Analysis.
Comparison 1 ANY DEPRESSION: Low dosage TCA vs Placebo, Outcome 1 Acceptability of treatment as measured by leaving study early for any reason.
1.2. Analysis.
Comparison 1 ANY DEPRESSION: Low dosage TCA vs Placebo, Outcome 2 Depression severity.
1.3. Analysis.
Comparison 1 ANY DEPRESSION: Low dosage TCA vs Placebo, Outcome 3 Depression improved (per protocol).
1.4. Analysis.
Comparison 1 ANY DEPRESSION: Low dosage TCA vs Placebo, Outcome 4 Depression improved (worst case ITT).
1.5. Analysis.
Comparison 1 ANY DEPRESSION: Low dosage TCA vs Placebo, Outcome 5 Side effects 1. Drop‐outs due to side effects.
1.6. Analysis.
Comparison 1 ANY DEPRESSION: Low dosage TCA vs Placebo, Outcome 6 Side effects 2. Total number experiencing at least one side effect.
1.7. Analysis.
Comparison 1 ANY DEPRESSION: Low dosage TCA vs Placebo, Outcome 7 Depression improved (per protocol) for funnel plot analysis.
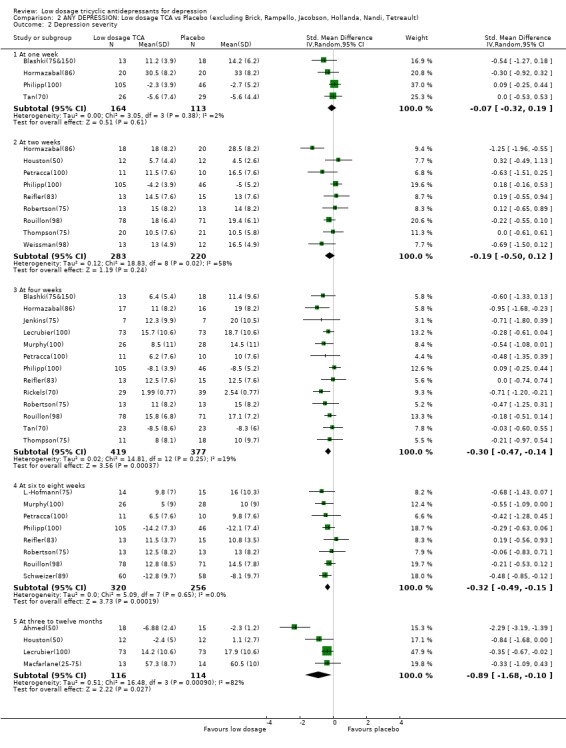
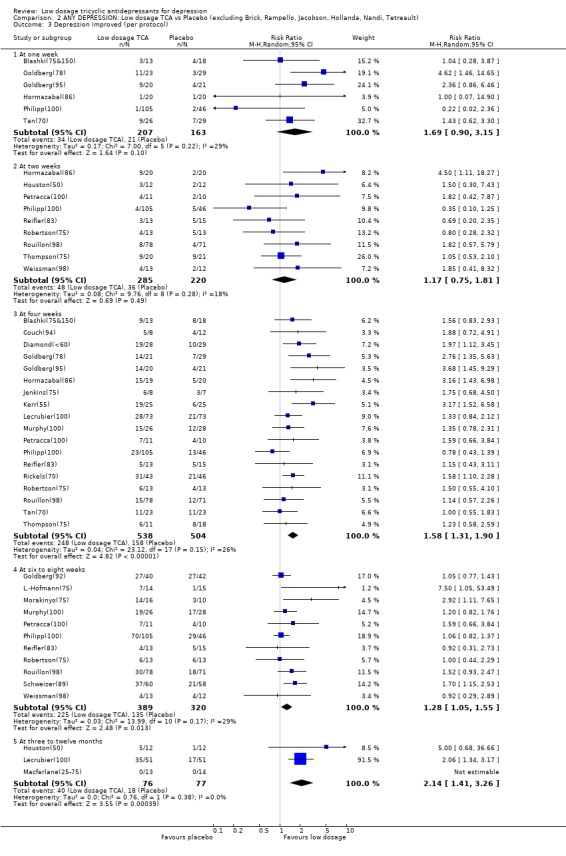
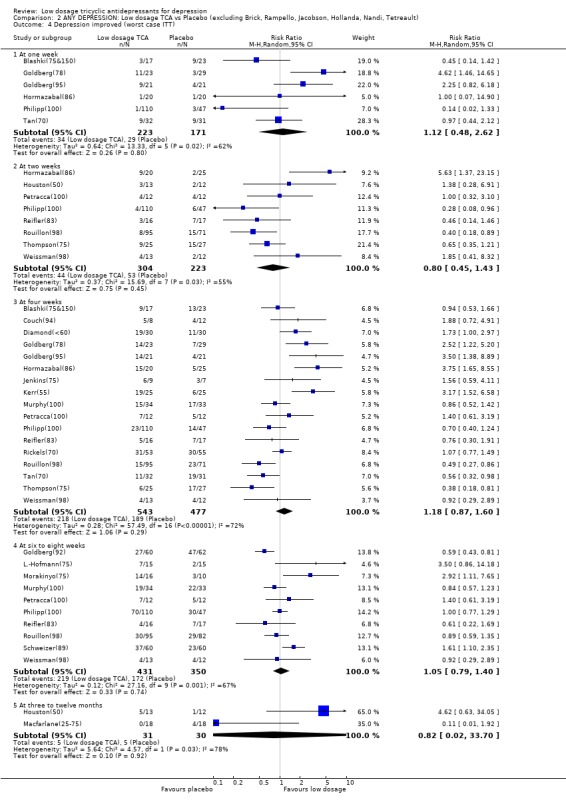
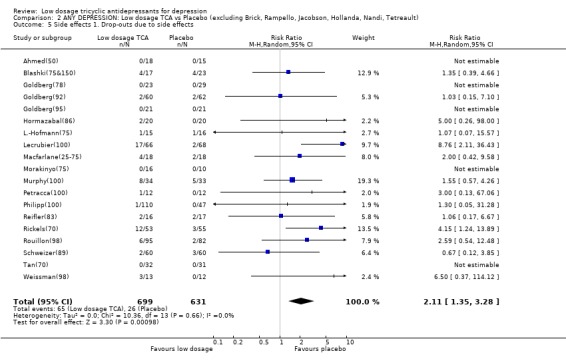
Comparison 2. ANY DEPRESSION: Low dosage TCA vs Placebo (excluding Brick, Rampello, Jacobson, Hollanda, Nandi, Tetreault).
| Outcome or subgroup title | No. of studies | No. of participants | Statistical method | Effect size |
|---|---|---|---|---|
| 1 Acceptability of treatment as measured by leaving study early for any reason | 25 | 1680 | Risk Ratio (M‐H, Random, 95% CI) | 1.09 [0.94, 1.28] |
| 2 Depression severity | 19 | Std. Mean Difference (IV, Random, 95% CI) | Subtotals only | |
| 2.1 At one week | 4 | 277 | Std. Mean Difference (IV, Random, 95% CI) | ‐0.07 [‐0.32, 0.19] |
| 2.2 At two weeks | 9 | 503 | Std. Mean Difference (IV, Random, 95% CI) | ‐0.19 [‐0.50, 0.12] |
| 2.3 At four weeks | 13 | 796 | Std. Mean Difference (IV, Random, 95% CI) | ‐0.30 [‐0.47, ‐0.14] |
| 2.4 At six to eight weeks | 8 | 576 | Std. Mean Difference (IV, Random, 95% CI) | ‐0.32 [‐0.49, ‐0.15] |
| 2.5 At three to twelve months | 4 | 230 | Std. Mean Difference (IV, Random, 95% CI) | ‐0.89 [‐1.68, ‐0.10] |
| 3 Depression improved (per protocol) | 25 | Risk Ratio (M‐H, Random, 95% CI) | Subtotals only | |
| 3.1 At one week | 6 | 370 | Risk Ratio (M‐H, Random, 95% CI) | 1.69 [0.90, 3.15] |
| 3.2 At two weeks | 9 | 505 | Risk Ratio (M‐H, Random, 95% CI) | 1.17 [0.75, 1.81] |
| 3.3 At four weeks | 18 | 1042 | Risk Ratio (M‐H, Random, 95% CI) | 1.58 [1.31, 1.90] |
| 3.4 At six to eight weeks | 11 | 709 | Risk Ratio (M‐H, Random, 95% CI) | 1.28 [1.05, 1.55] |
| 3.5 At three to twelve months | 3 | 153 | Risk Ratio (M‐H, Random, 95% CI) | 2.14 [1.41, 3.26] |
| 4 Depression improved (worst case ITT) | 23 | Risk Ratio (M‐H, Random, 95% CI) | Subtotals only | |
| 4.1 At one week | 6 | 394 | Risk Ratio (M‐H, Random, 95% CI) | 1.12 [0.48, 2.62] |
| 4.2 At two weeks | 8 | 527 | Risk Ratio (M‐H, Random, 95% CI) | 0.80 [0.45, 1.43] |
| 4.3 At four weeks | 17 | 1020 | Risk Ratio (M‐H, Random, 95% CI) | 1.18 [0.87, 1.60] |
| 4.4 At six to eight weeks | 10 | 781 | Risk Ratio (M‐H, Random, 95% CI) | 1.05 [0.79, 1.40] |
| 4.5 At three to twelve months | 2 | 61 | Risk Ratio (M‐H, Random, 95% CI) | 0.82 [0.02, 33.70] |
| 5 Side effects 1. Drop‐outs due to side effects | 19 | 1330 | Risk Ratio (M‐H, Random, 95% CI) | 2.11 [1.35, 3.28] |
| 6 Side effects 2. Total number experiencing at least one side effect | 16 | 1258 | Risk Ratio (M‐H, Random, 95% CI) | 1.61 [1.33, 1.95] |
2.1. Analysis.
Comparison 2 ANY DEPRESSION: Low dosage TCA vs Placebo (excluding Brick, Rampello, Jacobson, Hollanda, Nandi, Tetreault), Outcome 1 Acceptability of treatment as measured by leaving study early for any reason.
2.2. Analysis.
Comparison 2 ANY DEPRESSION: Low dosage TCA vs Placebo (excluding Brick, Rampello, Jacobson, Hollanda, Nandi, Tetreault), Outcome 2 Depression severity.
2.3. Analysis.
Comparison 2 ANY DEPRESSION: Low dosage TCA vs Placebo (excluding Brick, Rampello, Jacobson, Hollanda, Nandi, Tetreault), Outcome 3 Depression improved (per protocol).
2.4. Analysis.
Comparison 2 ANY DEPRESSION: Low dosage TCA vs Placebo (excluding Brick, Rampello, Jacobson, Hollanda, Nandi, Tetreault), Outcome 4 Depression improved (worst case ITT).
2.5. Analysis.
Comparison 2 ANY DEPRESSION: Low dosage TCA vs Placebo (excluding Brick, Rampello, Jacobson, Hollanda, Nandi, Tetreault), Outcome 5 Side effects 1. Drop‐outs due to side effects.
2.6. Analysis.
Comparison 2 ANY DEPRESSION: Low dosage TCA vs Placebo (excluding Brick, Rampello, Jacobson, Hollanda, Nandi, Tetreault), Outcome 6 Side effects 2. Total number experiencing at least one side effect.
Comparison 3. OPERATIONALLY DEFINED DEPRESSION: Low dosage TCA vs Placebo.
| Outcome or subgroup title | No. of studies | No. of participants | Statistical method | Effect size |
|---|---|---|---|---|
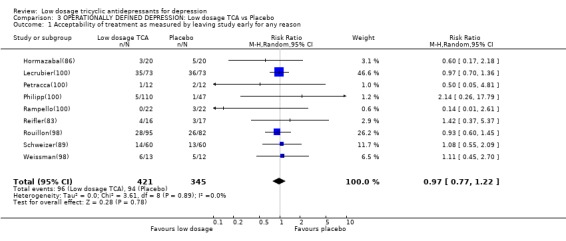
| 1 Acceptability of treatment as measured by leaving study early for any reason | 9 | 766 | Risk Ratio (M‐H, Random, 95% CI) | 0.97 [0.77, 1.22] |
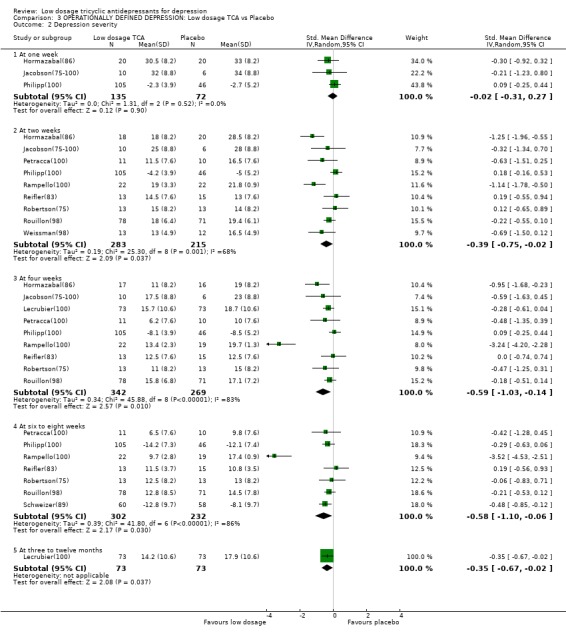
| 2 Depression severity | 11 | Std. Mean Difference (IV, Random, 95% CI) | Subtotals only | |
| 2.1 At one week | 3 | 207 | Std. Mean Difference (IV, Random, 95% CI) | ‐0.02 [‐0.31, 0.27] |
| 2.2 At two weeks | 9 | 498 | Std. Mean Difference (IV, Random, 95% CI) | ‐0.39 [‐0.75, ‐0.02] |
| 2.3 At four weeks | 9 | 611 | Std. Mean Difference (IV, Random, 95% CI) | ‐0.59 [‐1.03, ‐0.14] |
| 2.4 At six to eight weeks | 7 | 534 | Std. Mean Difference (IV, Random, 95% CI) | ‐0.58 [‐1.10, ‐0.06] |
| 2.5 At three to twelve months | 1 | 146 | Std. Mean Difference (IV, Random, 95% CI) | ‐0.35 [‐0.67, ‐0.02] |
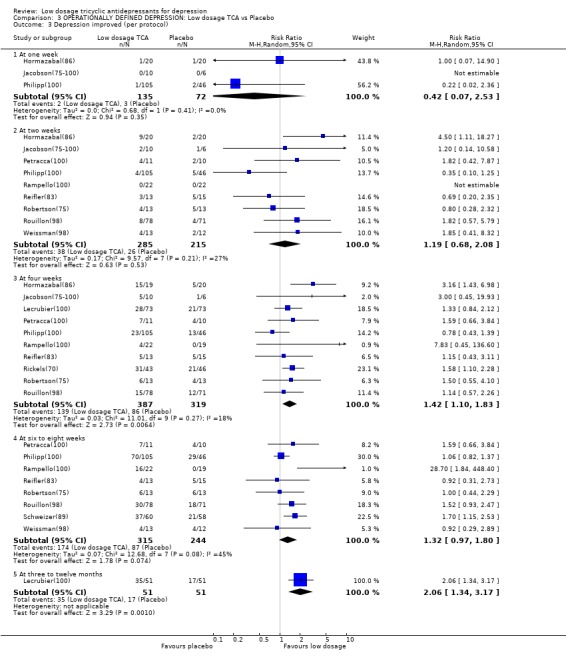
| 3 Depression improved (per protocol) | 12 | Risk Ratio (M‐H, Random, 95% CI) | Subtotals only | |
| 3.1 At one week | 3 | 207 | Risk Ratio (M‐H, Random, 95% CI) | 0.42 [0.07, 2.53] |
| 3.2 At two weeks | 9 | 500 | Risk Ratio (M‐H, Random, 95% CI) | 1.19 [0.68, 2.08] |
| 3.3 At four weeks | 10 | 706 | Risk Ratio (M‐H, Random, 95% CI) | 1.42 [1.10, 1.83] |
| 3.4 At six to eight weeks | 8 | 559 | Risk Ratio (M‐H, Random, 95% CI) | 1.32 [0.97, 1.80] |
| 3.5 At three to twelve months | 1 | 102 | Risk Ratio (M‐H, Random, 95% CI) | 2.06 [1.34, 3.17] |
| 4 Depression improved (worst case ITT) | 10 | Risk Ratio (M‐H, Random, 95% CI) | Subtotals only | |
| 4.1 At one week | 2 | 197 | Risk Ratio (M‐H, Random, 95% CI) | 0.32 [0.05, 2.14] |
| 4.2 At two weeks | 8 | 496 | Risk Ratio (M‐H, Random, 95% CI) | 0.82 [0.36, 1.88] |
| 4.3 At four weeks | 8 | 602 | Risk Ratio (M‐H, Random, 95% CI) | 1.03 [0.68, 1.55] |
| 4.4 At six to eight weeks | 7 | 580 | Risk Ratio (M‐H, Random, 95% CI) | 1.22 [0.86, 1.72] |
| 4.5 At three to twelve months | 0 | 0 | Risk Ratio (M‐H, Random, 95% CI) | 0.0 [0.0, 0.0] |
| 5 Side effects 1. Drop‐outs due to side effects | 9 | 754 | Risk Ratio (M‐H, Random, 95% CI) | 2.63 [1.28, 5.37] |
| 6 Side effects 2. Total number experiencing at least one side effect | 8 | 726 | Risk Ratio (M‐H, Random, 95% CI) | 1.48 [1.24, 1.77] |
3.1. Analysis.
Comparison 3 OPERATIONALLY DEFINED DEPRESSION: Low dosage TCA vs Placebo, Outcome 1 Acceptability of treatment as measured by leaving study early for any reason.
3.2. Analysis.
Comparison 3 OPERATIONALLY DEFINED DEPRESSION: Low dosage TCA vs Placebo, Outcome 2 Depression severity.
3.3. Analysis.
Comparison 3 OPERATIONALLY DEFINED DEPRESSION: Low dosage TCA vs Placebo, Outcome 3 Depression improved (per protocol).
3.4. Analysis.
Comparison 3 OPERATIONALLY DEFINED DEPRESSION: Low dosage TCA vs Placebo, Outcome 4 Depression improved (worst case ITT).
3.5. Analysis.
Comparison 3 OPERATIONALLY DEFINED DEPRESSION: Low dosage TCA vs Placebo, Outcome 5 Side effects 1. Drop‐outs due to side effects.
3.6. Analysis.
Comparison 3 OPERATIONALLY DEFINED DEPRESSION: Low dosage TCA vs Placebo, Outcome 6 Side effects 2. Total number experiencing at least one side effect.
Comparison 4. ANY DEPRESSION: Strictly low dosage TCA vs Placebo.
| Outcome or subgroup title | No. of studies | No. of participants | Statistical method | Effect size |
|---|---|---|---|---|
| 1 Acceptability of treatment as measured by leaving study early for any reason | 21 | 1175 | Risk Ratio (M‐H, Random, 95% CI) | 1.13 [0.93, 1.38] |
| 2 Depression severity | 17 | Std. Mean Difference (IV, Random, 95% CI) | Subtotals only | |
| 2.1 At one week | 4 | 253 | Std. Mean Difference (IV, Random, 95% CI) | ‐0.03 [‐0.29, 0.23] |
| 2.2 At two weeks | 7 | 306 | Std. Mean Difference (IV, Random, 95% CI) | 0.03 [‐0.21, 0.26] |
| 2.3 At four weeks | 13 | 651 | Std. Mean Difference (IV, Random, 95% CI) | ‐0.43 [‐0.65, ‐0.21] |
| 2.4 At six to eight weeks | 6 | 303 | Std. Mean Difference (IV, Random, 95% CI) | ‐0.40 [‐0.64, ‐0.17] |
| 2.5 At three to twelve months | 4 | 230 | Std. Mean Difference (IV, Random, 95% CI) | ‐0.89 [‐1.68, ‐0.10] |
| 3 Depression improved (per protocol) | 22 | Risk Ratio (M‐H, Random, 95% CI) | Subtotals only | |
| 3.1 At one week | 5 | 294 | Risk Ratio (M‐H, Random, 95% CI) | 1.38 [0.73, 2.61] |
| 3.2 At two weeks | 7 | 306 | Risk Ratio (M‐H, Random, 95% CI) | 1.01 [0.64, 1.59] |
| 3.3 At four weeks | 18 | 853 | Risk Ratio (M‐H, Random, 95% CI) | 1.58 [1.28, 1.94] |
| 3.4 At six to eight weeks | 7 | 329 | Risk Ratio (M‐H, Random, 95% CI) | 1.51 [1.04, 2.21] |
| 3.5 At three to twelve months | 3 | 153 | Risk Ratio (M‐H, Random, 95% CI) | 2.14 [1.41, 3.26] |
| 4 Depression improved (worst case ITT) | 19 | Risk Ratio (M‐H, Random, 95% CI) | Subtotals only | |
| 4.1 At one week | 4 | 302 | Risk Ratio (M‐H, Random, 95% CI) | 0.81 [0.33, 1.97] |
| 4.2 At two weeks | 5 | 288 | Risk Ratio (M‐H, Random, 95% CI) | 0.75 [0.42, 1.36] |
| 4.3 At four weeks | 15 | 763 | Risk Ratio (M‐H, Random, 95% CI) | 1.25 [0.89, 1.76] |
| 4.4 At six to eight weeks | 6 | 326 | Risk Ratio (M‐H, Random, 95% CI) | 1.48 [0.94, 2.33] |
| 4.5 At three to twelve months | 2 | 61 | Risk Ratio (M‐H, Random, 95% CI) | 0.82 [0.02, 33.70] |
| 5 Side effects 1. Drop‐outs due to side effects | 15 | 825 | Risk Ratio (M‐H, Random, 95% CI) | 2.39 [1.41, 4.06] |
| 6 Side effects 2. Total number experiencing at least one side effect | 13 | 823 | Risk Ratio (M‐H, Random, 95% CI) | 1.84 [1.44, 2.37] |
4.1. Analysis.
Comparison 4 ANY DEPRESSION: Strictly low dosage TCA vs Placebo, Outcome 1 Acceptability of treatment as measured by leaving study early for any reason.
4.2. Analysis.
Comparison 4 ANY DEPRESSION: Strictly low dosage TCA vs Placebo, Outcome 2 Depression severity.
4.3. Analysis.
Comparison 4 ANY DEPRESSION: Strictly low dosage TCA vs Placebo, Outcome 3 Depression improved (per protocol).
4.4. Analysis.
Comparison 4 ANY DEPRESSION: Strictly low dosage TCA vs Placebo, Outcome 4 Depression improved (worst case ITT).
4.5. Analysis.
Comparison 4 ANY DEPRESSION: Strictly low dosage TCA vs Placebo, Outcome 5 Side effects 1. Drop‐outs due to side effects.
4.6. Analysis.
Comparison 4 ANY DEPRESSION: Strictly low dosage TCA vs Placebo, Outcome 6 Side effects 2. Total number experiencing at least one side effect.
Comparison 5. OLD PEOPLE WITH ANY DEPRESSION: Low dosage TCA vs Placebo.
| Outcome or subgroup title | No. of studies | No. of participants | Statistical method | Effect size |
|---|---|---|---|---|
| 1 Acceptability of treatment as measured by leaving study early for any reason | 5 | 265 | Risk Ratio (M‐H, Random, 95% CI) | 1.09 [0.72, 1.65] |
| 2 Depression severity | 5 | Std. Mean Difference (IV, Random, 95% CI) | Subtotals only | |
| 2.1 At one week | 1 | 55 | Std. Mean Difference (IV, Random, 95% CI) | 0.0 [‐0.53, 0.53] |
| 2.2 At two weeks | 3 | 74 | Std. Mean Difference (IV, Random, 95% CI) | ‐0.35 [‐0.93, 0.24] |
| 2.3 At four weeks | 3 | 95 | Std. Mean Difference (IV, Random, 95% CI) | ‐0.12 [‐0.52, 0.29] |
| 2.4 At six to eight weeks | 3 | 167 | Std. Mean Difference (IV, Random, 95% CI) | ‐0.32 [‐0.71, 0.06] |
| 2.5 At three to twelve months | 0 | 0 | Std. Mean Difference (IV, Random, 95% CI) | 0.0 [0.0, 0.0] |
| 3 Depression improved (per protocol) | 5 | Risk Ratio (M‐H, Random, 95% CI) | Subtotals only | |
| 3.1 At one week | 1 | 55 | Risk Ratio (M‐H, Random, 95% CI) | 1.43 [0.62, 3.30] |
| 3.2 At two weeks | 3 | 74 | Risk Ratio (M‐H, Random, 95% CI) | 1.21 [0.55, 2.69] |
| 3.3 At four weeks | 3 | 95 | Risk Ratio (M‐H, Random, 95% CI) | 1.16 [0.74, 1.81] |
| 3.4 At six to eight weeks | 4 | 192 | Risk Ratio (M‐H, Random, 95% CI) | 1.52 [1.09, 2.11] |
| 3.5 At three to twelve months | 0 | 0 | Risk Ratio (M‐H, Random, 95% CI) | 0.0 [0.0, 0.0] |
| 4 Depression improved (worst case ITT) | 5 | Risk Ratio (M‐H, Random, 95% CI) | Subtotals only | |
| 4.1 At one week | 1 | 63 | Risk Ratio (M‐H, Random, 95% CI) | 0.97 [0.44, 2.12] |
| 4.2 At two weeks | 3 | 82 | Risk Ratio (M‐H, Random, 95% CI) | 0.86 [0.41, 1.83] |
| 4.3 At four weeks | 4 | 145 | Risk Ratio (M‐H, Random, 95% CI) | 0.78 [0.51, 1.19] |
| 4.4 At six to eight weeks | 4 | 202 | Risk Ratio (M‐H, Random, 95% CI) | 1.30 [0.88, 1.92] |
| 4.5 At three to twelve months | 0 | 0 | Risk Ratio (M‐H, Random, 95% CI) | 0.0 [0.0, 0.0] |
| 5 Side effects 1. Drop‐outs due to side effects | 5 | 265 | Risk Ratio (M‐H, Random, 95% CI) | 1.31 [0.44, 3.88] |
| 6 Side effects 2. Total number experiencing at least one side effect | 4 | 219 | Risk Ratio (M‐H, Random, 95% CI) | 1.26 [1.09, 1.45] |
5.1. Analysis.
Comparison 5 OLD PEOPLE WITH ANY DEPRESSION: Low dosage TCA vs Placebo, Outcome 1 Acceptability of treatment as measured by leaving study early for any reason.
5.2. Analysis.
Comparison 5 OLD PEOPLE WITH ANY DEPRESSION: Low dosage TCA vs Placebo, Outcome 2 Depression severity.
5.3. Analysis.
Comparison 5 OLD PEOPLE WITH ANY DEPRESSION: Low dosage TCA vs Placebo, Outcome 3 Depression improved (per protocol).
5.4. Analysis.
Comparison 5 OLD PEOPLE WITH ANY DEPRESSION: Low dosage TCA vs Placebo, Outcome 4 Depression improved (worst case ITT).
5.5. Analysis.
Comparison 5 OLD PEOPLE WITH ANY DEPRESSION: Low dosage TCA vs Placebo, Outcome 5 Side effects 1. Drop‐outs due to side effects.
5.6. Analysis.
Comparison 5 OLD PEOPLE WITH ANY DEPRESSION: Low dosage TCA vs Placebo, Outcome 6 Side effects 2. Total number experiencing at least one side effect.
Comparison 6. ANY DEPRESSION IN PRIMARY CARE: Low dosage TCA vs Placebo.
| Outcome or subgroup title | No. of studies | No. of participants | Statistical method | Effect size |
|---|---|---|---|---|
| 1 Acceptability of treatment as measured by leaving study early for any reason | 8 | 512 | Risk Ratio (M‐H, Random, 95% CI) | 1.38 [0.96, 1.99] |
| 2 Depression severity | 10 | Std. Mean Difference (IV, Random, 95% CI) | Subtotals only | |
| 2.1 At one week | 2 | 182 | Std. Mean Difference (IV, Random, 95% CI) | ‐0.14 [‐0.74, 0.46] |
| 2.2 At two weeks | 4 | 242 | Std. Mean Difference (IV, Random, 95% CI) | 0.16 [‐0.11, 0.42] |
| 2.3 At four weeks | 6 | 305 | Std. Mean Difference (IV, Random, 95% CI) | ‐0.29 [‐0.58, 0.01] |
| 2.4 At six to eight weeks | 5 | 371 | Std. Mean Difference (IV, Random, 95% CI) | ‐0.41 [‐0.62, ‐0.19] |
| 2.5 At three to twelve months | 2 | 51 | Std. Mean Difference (IV, Random, 95% CI) | ‐0.56 [‐1.12, 0.00] |
| 3 Depression improved (per protocol) | 10 | Risk Ratio (M‐H, Random, 95% CI) | Subtotals only | |
| 3.1 At one week | 2 | 182 | Risk Ratio (M‐H, Random, 95% CI) | 0.66 [0.16, 2.66] |
| 3.2 At two weeks | 4 | 242 | Risk Ratio (M‐H, Random, 95% CI) | 0.86 [0.52, 1.42] |
| 3.3 At four weeks | 7 | 326 | Risk Ratio (M‐H, Random, 95% CI) | 1.28 [0.98, 1.68] |
| 3.4 At six to eight weeks | 4 | 349 | Risk Ratio (M‐H, Random, 95% CI) | 1.23 [0.97, 1.55] |
| 3.5 At three to twelve months | 2 | 51 | Risk Ratio (M‐H, Random, 95% CI) | 5.0 [0.68, 36.66] |
| 4 Depression improved (worst case ITT) | 9 | Risk Ratio (M‐H, Random, 95% CI) | Subtotals only | |
| 4.1 At one week | 2 | 197 | Risk Ratio (M‐H, Random, 95% CI) | 0.35 [0.13, 0.98] |
| 4.2 At two weeks | 3 | 234 | Risk Ratio (M‐H, Random, 95% CI) | 0.60 [0.31, 1.15] |
| 4.3 At four weeks | 6 | 352 | Risk Ratio (M‐H, Random, 95% CI) | 0.86 [0.59, 1.25] |
| 4.4 At six to eight weeks | 3 | 344 | Risk Ratio (M‐H, Random, 95% CI) | 1.10 [0.77, 1.56] |
| 4.5 At three to twelve months | 2 | 61 | Risk Ratio (M‐H, Random, 95% CI) | 0.82 [0.02, 33.70] |
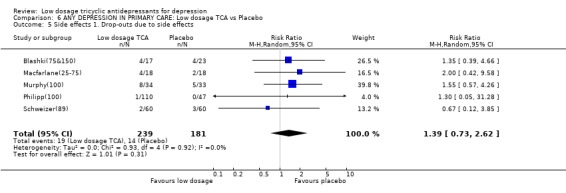
| 5 Side effects 1. Drop‐outs due to side effects | 5 | 420 | Risk Ratio (M‐H, Random, 95% CI) | 1.39 [0.73, 2.62] |
| 6 Side effects 2. Total number experiencing at least one side effect | 4 | 358 | Risk Ratio (M‐H, Random, 95% CI) | 1.82 [0.97, 3.40] |
6.1. Analysis.
Comparison 6 ANY DEPRESSION IN PRIMARY CARE: Low dosage TCA vs Placebo, Outcome 1 Acceptability of treatment as measured by leaving study early for any reason.
6.2. Analysis.
Comparison 6 ANY DEPRESSION IN PRIMARY CARE: Low dosage TCA vs Placebo, Outcome 2 Depression severity.
6.3. Analysis.
Comparison 6 ANY DEPRESSION IN PRIMARY CARE: Low dosage TCA vs Placebo, Outcome 3 Depression improved (per protocol).
6.4. Analysis.
Comparison 6 ANY DEPRESSION IN PRIMARY CARE: Low dosage TCA vs Placebo, Outcome 4 Depression improved (worst case ITT).
6.5. Analysis.
Comparison 6 ANY DEPRESSION IN PRIMARY CARE: Low dosage TCA vs Placebo, Outcome 5 Side effects 1. Drop‐outs due to side effects.
6.6. Analysis.
Comparison 6 ANY DEPRESSION IN PRIMARY CARE: Low dosage TCA vs Placebo, Outcome 6 Side effects 2. Total number experiencing at least one side effect.
Comparison 7. ANY DEPRESSION AMONG PSYCHIATRIC PATIENTS: Low dosage TCA vs Placebo.
| Outcome or subgroup title | No. of studies | No. of participants | Statistical method | Effect size |
|---|---|---|---|---|
| 1 Acceptability of treatment as measured by leaving study early for any reason | 11 | 858 | Risk Ratio (M‐H, Random, 95% CI) | 1.02 [0.84, 1.23] |
| 2 Depression severity | 7 | Std. Mean Difference (IV, Random, 95% CI) | Subtotals only | |
| 2.1 At one week | 2 | 95 | Std. Mean Difference (IV, Random, 95% CI) | ‐0.13 [‐0.53, 0.28] |
| 2.2 At two weeks | 3 | 212 | Std. Mean Difference (IV, Random, 95% CI) | ‐0.67 [‐1.33, ‐0.01] |
| 2.3 At four weeks | 5 | 396 | Std. Mean Difference (IV, Random, 95% CI) | ‐0.38 [‐0.69, ‐0.06] |
| 2.4 At six to eight weeks | 2 | 171 | Std. Mean Difference (IV, Random, 95% CI) | ‐0.40 [‐0.98, 0.18] |
| 2.5 At three to twelve months | 2 | 179 | Std. Mean Difference (IV, Random, 95% CI) | ‐1.27 [‐3.17, 0.63] |
| 3 Depression improved (per protocol) | 9 | Risk Ratio (M‐H, Random, 95% CI) | Subtotals only | |
| 3.1 At one week | 4 | 188 | Risk Ratio (M‐H, Random, 95% CI) | 2.14 [1.23, 3.70] |
| 3.2 At two weeks | 3 | 214 | Risk Ratio (M‐H, Random, 95% CI) | 2.40 [1.11, 5.16] |
| 3.3 At four weeks | 7 | 493 | Risk Ratio (M‐H, Random, 95% CI) | 1.83 [1.20, 2.79] |
| 3.4 At six to eight weeks | 4 | 278 | Risk Ratio (M‐H, Random, 95% CI) | 1.38 [0.88, 2.16] |
| 3.5 At three to twelve months | 1 | 102 | Risk Ratio (M‐H, Random, 95% CI) | 2.06 [1.34, 3.17] |
| 4 Depression improved (worst case ITT) | 8 | Risk Ratio (M‐H, Random, 95% CI) | Subtotals only | |
| 4.1 At one week | 4 | 197 | Risk Ratio (M‐H, Random, 95% CI) | 1.87 [0.85, 4.09] |
| 4.2 At two weeks | 3 | 236 | Risk Ratio (M‐H, Random, 95% CI) | 1.48 [0.27, 8.00] |
| 4.3 At four weeks | 7 | 415 | Risk Ratio (M‐H, Random, 95% CI) | 1.51 [0.70, 3.24] |
| 4.4 At six to eight weeks | 4 | 346 | Risk Ratio (M‐H, Random, 95% CI) | 0.99 [0.55, 1.79] |
| 4.5 At three to twelve months | 0 | 0 | Risk Ratio (M‐H, Random, 95% CI) | 0.0 [0.0, 0.0] |
| 5 Side effects 1. Drop‐outs due to side effects | 10 | 710 | Risk Ratio (M‐H, Random, 95% CI) | 3.80 [1.63, 8.86] |
| 6 Side effects 2. Total number experiencing at least one side effect | 8 | 695 | Risk Ratio (M‐H, Random, 95% CI) | 1.40 [1.17, 1.66] |
7.1. Analysis.
Comparison 7 ANY DEPRESSION AMONG PSYCHIATRIC PATIENTS: Low dosage TCA vs Placebo, Outcome 1 Acceptability of treatment as measured by leaving study early for any reason.
7.2. Analysis.
Comparison 7 ANY DEPRESSION AMONG PSYCHIATRIC PATIENTS: Low dosage TCA vs Placebo, Outcome 2 Depression severity.
7.3. Analysis.
Comparison 7 ANY DEPRESSION AMONG PSYCHIATRIC PATIENTS: Low dosage TCA vs Placebo, Outcome 3 Depression improved (per protocol).
7.4. Analysis.
Comparison 7 ANY DEPRESSION AMONG PSYCHIATRIC PATIENTS: Low dosage TCA vs Placebo, Outcome 4 Depression improved (worst case ITT).
7.5. Analysis.
Comparison 7 ANY DEPRESSION AMONG PSYCHIATRIC PATIENTS: Low dosage TCA vs Placebo, Outcome 5 Side effects 1. Drop‐outs due to side effects.
7.6. Analysis.
Comparison 7 ANY DEPRESSION AMONG PSYCHIATRIC PATIENTS: Low dosage TCA vs Placebo, Outcome 6 Side effects 2. Total number experiencing at least one side effect.
Comparison 8. ANY DEPRESSION: Very low dosage TCA vs Placebo.
| Outcome or subgroup title | No. of studies | No. of participants | Statistical method | Effect size |
|---|---|---|---|---|
| 1 Acceptability of treatment as measured by leaving study early for any reason | 13 | 551 | Risk Ratio (M‐H, Random, 95% CI) | 1.24 [0.91, 1.69] |
| 2 Depression severity | 10 | Std. Mean Difference (IV, Random, 95% CI) | Subtotals only | |
| 2.1 At one week | 2 | 86 | Std. Mean Difference (IV, Random, 95% CI) | ‐0.21 [‐0.73, 0.31] |
| 2.2 At two weeks | 3 | 91 | Std. Mean Difference (IV, Random, 95% CI) | 0.12 [‐0.29, 0.53] |
| 2.3 At four weeks | 6 | 214 | Std. Mean Difference (IV, Random, 95% CI) | ‐0.44 [‐0.72, ‐0.17] |
| 2.4 At six to eight weeks | 2 | 55 | Std. Mean Difference (IV, Random, 95% CI) | ‐0.37 [‐0.98, 0.23] |
| 2.5 At three to twelve months | 3 | 84 | Std. Mean Difference (IV, Random, 95% CI) | ‐1.13 [‐2.26, ‐0.01] |
| 3 Depression improved (per protocol) | 13 | Risk Ratio (M‐H, Random, 95% CI) | Subtotals only | |
| 3.1 At one week | 2 | 86 | Risk Ratio (M‐H, Random, 95% CI) | 1.31 [0.65, 2.64] |
| 3.2 At two weeks | 3 | 91 | Risk Ratio (M‐H, Random, 95% CI) | 1.02 [0.59, 1.76] |
| 3.3 At four weeks | 9 | 355 | Risk Ratio (M‐H, Random, 95% CI) | 1.63 [1.29, 2.07] |
| 3.4 At six to eight weeks | 3 | 81 | Risk Ratio (M‐H, Random, 95% CI) | 2.25 [0.76, 6.65] |
| 3.5 At three to twelve months | 2 | 51 | Risk Ratio (M‐H, Random, 95% CI) | 5.0 [0.68, 36.66] |
| 4 Depression improved (worst case ITT) | 12 | Risk Ratio (M‐H, Random, 95% CI) | Subtotals only | |
| 4.1 At one week | 2 | 103 | Risk Ratio (M‐H, Random, 95% CI) | 0.74 [0.36, 1.52] |
| 4.2 At two weeks | 2 | 77 | Risk Ratio (M‐H, Random, 95% CI) | 0.72 [0.40, 1.28] |
| 4.3 At four weeks | 8 | 401 | Risk Ratio (M‐H, Random, 95% CI) | 1.14 [0.72, 1.81] |
| 4.4 At six to eight weeks | 2 | 56 | Risk Ratio (M‐H, Random, 95% CI) | 3.09 [1.40, 6.84] |
| 4.5 At three to twelve months | 2 | 61 | Risk Ratio (M‐H, Random, 95% CI) | 0.82 [0.02, 33.70] |
| 5 Side effects 1. Drop‐outs due to side effects | 8 | 349 | Risk Ratio (M‐H, Random, 95% CI) | 2.17 [1.05, 4.50] |
| 6 Side effects 2. Total number experiencing at least one side effect | 7 | 338 | Risk Ratio (M‐H, Random, 95% CI) | 2.18 [1.28, 3.73] |
8.1. Analysis.
Comparison 8 ANY DEPRESSION: Very low dosage TCA vs Placebo, Outcome 1 Acceptability of treatment as measured by leaving study early for any reason.
8.2. Analysis.
Comparison 8 ANY DEPRESSION: Very low dosage TCA vs Placebo, Outcome 2 Depression severity.
8.3. Analysis.
Comparison 8 ANY DEPRESSION: Very low dosage TCA vs Placebo, Outcome 3 Depression improved (per protocol).
8.4. Analysis.
Comparison 8 ANY DEPRESSION: Very low dosage TCA vs Placebo, Outcome 4 Depression improved (worst case ITT).
8.5. Analysis.
Comparison 8 ANY DEPRESSION: Very low dosage TCA vs Placebo, Outcome 5 Side effects 1. Drop‐outs due to side effects.
8.6. Analysis.
Comparison 8 ANY DEPRESSION: Very low dosage TCA vs Placebo, Outcome 6 Side effects 2. Total number experiencing at least one side effect.
Comparison 9. Low dosage TCA vs Standard dosage TCA.
| Outcome or subgroup title | No. of studies | No. of participants | Statistical method | Effect size |
|---|---|---|---|---|
| 1 Acceptability of treatment as measured by leaving study early for any reason | 9 | 531 | Risk Ratio (M‐H, Random, 95% CI) | 0.95 [0.75, 1.20] |
| 2 Depression severity | 8 | Std. Mean Difference (IV, Random, 95% CI) | Subtotals only | |
| 2.1 At one week | 3 | 187 | Std. Mean Difference (IV, Random, 95% CI) | 0.44 [‐0.24, 1.12] |
| 2.2 At two weeks | 2 | 152 | Std. Mean Difference (IV, Random, 95% CI) | 0.30 [‐0.55, 1.15] |
| 2.3 At four weeks | 7 | 365 | Std. Mean Difference (IV, Random, 95% CI) | 0.29 [0.08, 0.50] |
| 2.4 At six to eight weeks | 2 | 103 | Std. Mean Difference (IV, Random, 95% CI) | 0.14 [‐0.90, 1.18] |
| 2.5 At two to six months | 0 | 0 | Std. Mean Difference (IV, Random, 95% CI) | 0.0 [0.0, 0.0] |
| 3 Depression improved (per protocol) | 9 | Risk Ratio (M‐H, Random, 95% CI) | Subtotals only | |
| 3.1 At one week | 2 | 160 | Risk Ratio (M‐H, Random, 95% CI) | 0.73 [0.06, 9.60] |
| 3.2 At two weeks | 3 | 179 | Risk Ratio (M‐H, Random, 95% CI) | 0.59 [0.25, 1.36] |
| 3.3 At four weeks | 7 | 365 | Risk Ratio (M‐H, Random, 95% CI) | 0.89 [0.74, 1.07] |
| 3.4 At six to eight weeks | 4 | 277 | Risk Ratio (M‐H, Random, 95% CI) | 1.10 [0.77, 1.58] |
| 3.5 At three to six months | 0 | 0 | Risk Ratio (M‐H, Random, 95% CI) | 0.0 [0.0, 0.0] |
| 4 Depression improved (worst case ITT) | 8 | Risk Ratio (M‐H, Random, 95% CI) | Subtotals only | |
| 4.1 At one week | 1 | 151 | Risk Ratio (M‐H, Random, 95% CI) | 0.88 [0.32, 2.41] |
| 4.2 At two weeks | 2 | 186 | Risk Ratio (M‐H, Random, 95% CI) | 0.78 [0.51, 1.20] |
| 4.3 At four weeks | 7 | 442 | Risk Ratio (M‐H, Random, 95% CI) | 1.17 [0.98, 1.40] |
| 4.4 At six to eight weeks | 3 | 278 | Risk Ratio (M‐H, Random, 95% CI) | 1.14 [0.84, 1.53] |
| 4.5 At three to eight months | 0 | 0 | Risk Ratio (M‐H, Random, 95% CI) | 0.0 [0.0, 0.0] |
| 5 Side effects 1. Drop‐outs due to side effects | 9 | 492 | Risk Ratio (M‐H, Random, 95% CI) | 0.45 [0.27, 0.76] |
| 6 Side effects 2. Total number experiencing at least one side effect | 7 | 297 | Risk Ratio (M‐H, Random, 95% CI) | 1.09 [0.86, 1.37] |
9.1. Analysis.
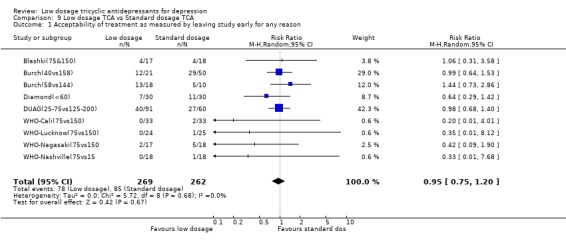
Comparison 9 Low dosage TCA vs Standard dosage TCA, Outcome 1 Acceptability of treatment as measured by leaving study early for any reason.
9.2. Analysis.
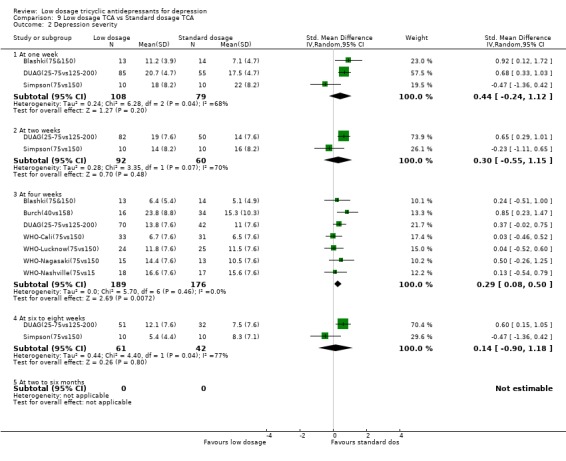
Comparison 9 Low dosage TCA vs Standard dosage TCA, Outcome 2 Depression severity.
9.3. Analysis.
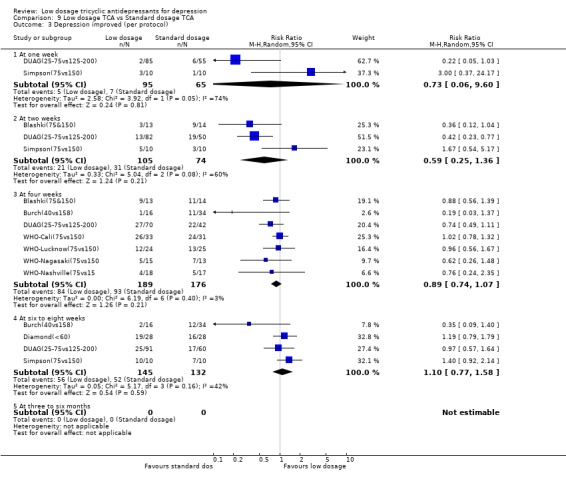
Comparison 9 Low dosage TCA vs Standard dosage TCA, Outcome 3 Depression improved (per protocol).
9.4. Analysis.
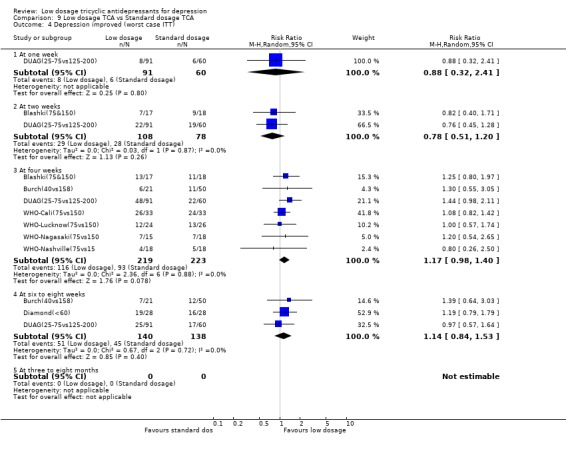
Comparison 9 Low dosage TCA vs Standard dosage TCA, Outcome 4 Depression improved (worst case ITT).
9.5. Analysis.
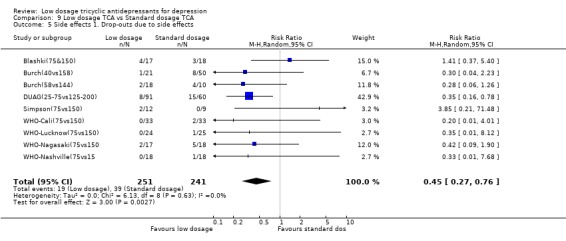
Comparison 9 Low dosage TCA vs Standard dosage TCA, Outcome 5 Side effects 1. Drop‐outs due to side effects.
9.6. Analysis.
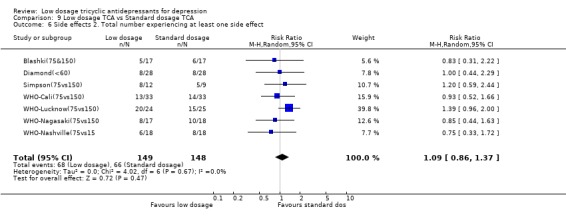
Comparison 9 Low dosage TCA vs Standard dosage TCA, Outcome 6 Side effects 2. Total number experiencing at least one side effect.
Characteristics of studies
Characteristics of included studies [ordered by study ID]
Ahmed(50).
| Methods | Allocation: random Blindness: described as double‐blind Duration: 12 weeks | |
| Participants | Diagnosis: "internal heat"; 75% were potentially depressed. Mainly adult Outpatients | |
| Interventions | 1. imipramine 50 mg/d 2. placebo 3. benzoctamin | |
| Outcomes | ad hoc depression severity scale | |
| Notes | ||
| Risk of bias | ||
| Bias | Authors' judgement | Support for judgement |
| Allocation concealment? | Unclear risk | B ‐ Unclear |
Blashki(75&150).
| Methods | Allocation: random with adequate concealment Blindness: described as double‐blind Duration: 4 weeks | |
| Participants | Diagnosis: ad hoc operationalised criteria for depression Mainly adult (mean=38) Outpatients at GPs | |
| Interventions | 1. amitriptyline 150 mg/d 2. amitriptyline 75 mg/d 3. placebo | |
| Outcomes | Depression severity: HRSD‐17 Response: >=50% reduction in HRSD calculated from mean&SD | |
| Notes | ||
| Risk of bias | ||
| Bias | Authors' judgement | Support for judgement |
| Allocation concealment? | Low risk | A ‐ Adequate |
Brick(30).
| Methods | Allocation: random Blindness: described as double‐blind Duration: 7 weeks | |
| Participants | Diagnosis: mild to severe (except the very severe) depression or anxiety according to MMPI & Taylor Mainly adult (mean=34‐36 years) Inmates | |
| Interventions | 1. amitriptyline 30 mg/d 2. placebo 3. amitriptyline + emylcamate | |
| Outcomes | Deprerssion severity: MMPI‐D Response: Excellent or good response according to patients' subjective evaluation | |
| Notes | ||
| Risk of bias | ||
| Bias | Authors' judgement | Support for judgement |
| Allocation concealment? | Unclear risk | B ‐ Unclear |
Burch(40vs158).
| Methods | Allocation: random Blindness: described as double‐blind Duration: 4‐6 weeks | |
| Participants | Diagnosis: primary depressive illness according to Feighner criteria Mainly adult (range: 18‐65) Inpatients | |
| Interventions | 1. amitriptyline 40 mg/d (28‐70 mg/d) 2. amitriptyline 158 mg/d (55‐280 mg/d) | |
| Outcomes | Depression severity: MADRS Response: MADRS=<9 | |
| Notes | ||
| Risk of bias | ||
| Bias | Authors' judgement | Support for judgement |
| Allocation concealment? | Unclear risk | B ‐ Unclear |
Burch(58vs144).
| Methods | Allocation: random Blindness: described as double‐blind Duration: 4‐6 weeks | |
| Participants | Diagnosis: primary depressive illness according to Feighner criteria Mainly old (range: 65<) Inpatients | |
| Interventions | 1. amitriptyline 57.5 mg/d (20‐125 mg/d) 2. amitpriptyline 144 mg/d (100‐190 mg/d) | |
| Outcomes | Depression severity: MADRS Response: MADRS=<9 | |
| Notes | ||
| Risk of bias | ||
| Bias | Authors' judgement | Support for judgement |
| Allocation concealment? | Unclear risk | B ‐ Unclear |
Couch(94).
| Methods | Allocation: random Blindness: described as double‐blind Duration: 4 weeks | |
| Participants | Diagnosis: migraine patients with HRSD‐18 >=14 Mainly adult (range: 15‐60) Outpatients at Headache Clinic | |
| Interventions | 1. amitriptyline 94 mg/d (50‐100 mg/d) 2. placebo | |
| Outcomes | Depression severity: HRSD‐18 Response: becoming "nondepressed" | |
| Notes | ||
| Risk of bias | ||
| Bias | Authors' judgement | Support for judgement |
| Allocation concealment? | Unclear risk | B ‐ Unclear |
Diamond(<60).
| Methods | Allocation: random Blindness: described as double‐blind Duration: 4 weeks | |
| Participants | Diagnosis: chronic tension headache patients with "depression" or "anxiety and depression" Mainly adult (range: 20‐60) | |
| Interventions | 1. amitriptyline <60 mg/d 2. placebo | |
| Outcomes | Depression severity: 4‐point scale Response: Excellent or good according to physician's global evaluation | |
| Notes | ||
| Risk of bias | ||
| Bias | Authors' judgement | Support for judgement |
| Allocation concealment? | Unclear risk | B ‐ Unclear |
DUAG(25‐75vs125‐200).
| Methods | Allocation: random Blindness: described as double‐blind Duration: 6 weeks | |
| Participants | Diagnosis: DSM‐III‐R major depression Mainly adult (range: 18‐70) Outpatients & inpatients | |
| Interventions | 1. clomipramine 25 mg/d 2. clomipramine 50 mg/d 3. clomipramine 75 mg/d 4. clomipramine 125 mg/d 5. clomipramine 200 mg/d | |
| Outcomes | Depression severity: HRSD‐17 Response: HRSD<=7 | |
| Notes | ||
| Risk of bias | ||
| Bias | Authors' judgement | Support for judgement |
| Allocation concealment? | Unclear risk | B ‐ Unclear |
Fryer(100).
| Methods | Allocation: random Blindness: described as double‐blind Duration: 4 weeks | |
| Participants | Diagnosis: >= 70 of T score for depression subscale of MMPI Mainly adult Inpatients | |
| Interventions | 1. imipramine 100 mg/d 2. placebo | |
| Outcomes | Depression severity: MMPI depression subscale | |
| Notes | ||
| Risk of bias | ||
| Bias | Authors' judgement | Support for judgement |
| Allocation concealment? | Unclear risk | B ‐ Unclear |
Goldberg(78).
| Methods | Allocation: random Blindness: described as double‐blind Duration: 4 weeks | |
| Participants | Diagnosis: "anxiety neurosis (usually mixed anxiety and depression)" Mainly adult (range: 19‐59) Outpatients | |
| Interventions | 1. doxepin 78.4 mg/d (25‐150 mg/d) 2. placebo | |
| Outcomes | Response: Marked to moderate change on Overall Global Improvement | |
| Notes | ||
| Risk of bias | ||
| Bias | Authors' judgement | Support for judgement |
| Allocation concealment? | Unclear risk | B ‐ Unclear |
Goldberg(92).
| Methods | Allocation: random Blindness: described as double‐blind Duration: 4 weeks | |
| Participants | Diagnosis: "psychoneurotic (mixed anxiety‐depressive) Mainly adult (range: 19‐60) Outpatients | |
| Interventions | 1. doxepin 94.6 mg/d (50‐100 mg/d) 2. placebo | |
| Outcomes | Response: Marked to moderate change on Overall Global Improvement | |
| Notes | ||
| Risk of bias | ||
| Bias | Authors' judgement | Support for judgement |
| Allocation concealment? | Unclear risk | B ‐ Unclear |
Goldberg(95).
| Methods | Allocation: random Blindness: described as double‐blind Duration: 6 weeks | |
| Participants | Diagnosis: neurotic depression according to NY University criteria | |
| Interventions | 1. amitriptyline 91.5 mg/d (75‐200 mg/d) 2. placebo 3. trazodone | |
| Outcomes | Depression severity: HRSD‐21 Response: >=50% reduction in HRSD | |
| Notes | ||
| Risk of bias | ||
| Bias | Authors' judgement | Support for judgement |
| Allocation concealment? | Unclear risk | B ‐ Unclear |
Hollanda(60).
| Methods | Allocation: random Blindness: described as double‐blind Duration: 4 weeks | |
| Participants | Diagnosis: endogenous or involutional or reactive depression according to traditiional criteria Mainly adult (range: 17‐58) Patient status not specified | |
| Interventions | 1. doxepin 60 mg/d 2. placebo | |
| Outcomes | Response: Marked to moderate overall improvement | |
| Notes | ||
| Risk of bias | ||
| Bias | Authors' judgement | Support for judgement |
| Allocation concealment? | Unclear risk | B ‐ Unclear |
Hormazabal(86).
| Methods | Allocation: random Blindness: described as double‐blind Duration: 4 weeks | |
| Participants | Diagnosis: depressive psychosis, depressive neurosis, reactive depression and others Mainly adult (mean=44‐42) Mainly outpatients | |
| Interventions | 1. amitriptyline 86.4 (SD=21) mg/d 2. placebo 3. cianopramine | |
| Outcomes | Depression severity: HRSD‐21 Response: Marked to moderate improvement on global evaluation | |
| Notes | ||
| Risk of bias | ||
| Bias | Authors' judgement | Support for judgement |
| Allocation concealment? | Unclear risk | B ‐ Unclear |
Houston(50).
| Methods | Allocation: random Blindness: described as double‐blind Duration: 52 weeks | |
| Participants | Diagnosis: >=7 on Leeds scale Mainly adult (range: 20‐46) Outpatients at GPs | |
| Interventions | 1. amitriptyline (slow release) 50 mg/d 2. placebo | |
| Outcomes | Depression severity: Leeds scale D score Response: >=50% reduction in Leeds scale calculated from mean&SD | |
| Notes | ||
| Risk of bias | ||
| Bias | Authors' judgement | Support for judgement |
| Allocation concealment? | Unclear risk | B ‐ Unclear |
Jacobson(75‐100).
| Methods | Allocation: random Blindness: described as double‐blind Duration: 4 weeks | |
| Participants | Diagnosis: depression (Feighner criteria) Age unknown Patient status unknown | |
| Interventions | 1. amitriptyline 75‐100 mg/d 2. placebo 3. amitriptyline + chlordiazepoxide | |
| Outcomes | Depression severity: HRSD‐24 Response: >=50% reduction in HRSD calculated from mean&SD | |
| Notes | ||
| Risk of bias | ||
| Bias | Authors' judgement | Support for judgement |
| Allocation concealment? | Unclear risk | B ‐ Unclear |
Jenkins(75).
| Methods | Allocation: random Blindness: described as double‐blind Duration: 4 weeks | |
| Participants | Diagnosis: low back pain patients with BDI>=14 Mainly adult (range: 18‐49) Patient status unknown | |
| Interventions | 1. imipramine 75 mg/d 2. placebo | |
| Outcomes | Depression severity: BDI Response: >=50% reduction in BDI | |
| Notes | ||
| Risk of bias | ||
| Bias | Authors' judgement | Support for judgement |
| Allocation concealment? | Unclear risk | B ‐ Unclear |
Kerr(55).
| Methods | Allocation: random Blindness: described as double‐blind Duration: 4 weeks | |
| Participants | Diagnosis: "anxiety and depression associated with menopause" Mainly adult (range: 44‐57) Patient status unknown | |
| Interventions | 1. amitriptyline 55 mg/d (30‐100 mg/d) 2. placebo | |
| Outcomes | Depression severity: one‐item assessment in 5 grades Response: "marked improvement or complete relief of symptoms" | |
| Notes | ||
| Risk of bias | ||
| Bias | Authors' judgement | Support for judgement |
| Allocation concealment? | Unclear risk | B ‐ Unclear |
L.‐Hofmann(75).
| Methods | Allocation: random Blindness: described as double‐blind Duration: 8 weeks | |
| Participants | Diagnosis: Obese binge eaters not meeting AN or BN according to DSM‐IV. Their baseline HRSD‐21 scores were 21 to 23 on average. Mainly adult (range: 20‐60) Outpatients | |
| Interventions | 1. imipramine 75 mg/d 2. placebo | |
| Outcomes | Depression severity: HRSD‐21, modified Response: >=50% reduction in HRSD calculated from mean&SD | |
| Notes | ||
| Risk of bias | ||
| Bias | Authors' judgement | Support for judgement |
| Allocation concealment? | Unclear risk | B ‐ Unclear |
Lecrubier(100).
| Methods | Allocation: random Blindness: described as double‐blind Duration: 6 months | |
| Participants | Diagnosis: DSM‐III‐R dysthymia (40%), dysthymia + major depression (40%), and major depression in partial remission (20%) Mainly adult (range: 18‐73, mean=43) Outpatients | |
| Interventions | 1. imipramine 100 mg/d 2. placebo 3. amisulpiride | |
| Outcomes | Depression severity: MADRS Response: very much improved or much improved on CGI | |
| Notes | ||
| Risk of bias | ||
| Bias | Authors' judgement | Support for judgement |
| Allocation concealment? | Unclear risk | B ‐ Unclear |
Macfarlane(25‐75).
| Methods | Allocation: random Blindness: described as double‐blind Duration: 12 weeks | |
| Participants | Diagnosis: rheumatoid arthritis patients with Zung SDS>=50 | |
| Interventions | 1. trimipramine 25‐75 mg/d 2. placebo | |
| Outcomes | Depression severity: Zung SDS Response: >=50% reduction in Zung SDS calculated from mean&SD | |
| Notes | ||
| Risk of bias | ||
| Bias | Authors' judgement | Support for judgement |
| Allocation concealment? | Unclear risk | B ‐ Unclear |
Morakinyo(75).
| Methods | Allocation: random Blindness: described as double‐blind Duration: 6 weeks | |
| Participants | Diagnosis: "depression" according to traditional diagnses Mainly adult (range: 20‐50) Patient status unknown | |
| Interventions | 1. amitriptyline 75 mg/d 2. placebo 3. amitriptyline + chlordiazepoxide | |
| Outcomes | Response: "improved" according to the overall response in three grades of "improved" "doubtful" and "not improved" | |
| Notes | ||
| Risk of bias | ||
| Bias | Authors' judgement | Support for judgement |
| Allocation concealment? | Unclear risk | B ‐ Unclear |
Murphy(100).
| Methods | Allocation: random Blindness: described as double‐blind Duration: 6 weeks | |
| Participants | Diagnosis: "depressive patients" according to traditional diagnosis Mainly adult (range: 18‐70) Outpatients at GPs | |
| Interventions | 1. imipramine 100 mg/d 2. placebo 3. mianserin | |
| Outcomes | Depression severity: ad hoc physician scale Response: >=50% reduction in the scale score calculated from mean&SD | |
| Notes | ||
| Risk of bias | ||
| Bias | Authors' judgement | Support for judgement |
| Allocation concealment? | Unclear risk | B ‐ Unclear |
Nandi(97).
| Methods | Allocation: random with adequate allocation concealment Blindness: described as double‐blind Duration: 4 weeks | |
| Participants | Diagnosis: "depression" according to traditional diagnosis Mainly adult Community residents | |
| Interventions | 1. imipramine 97.4 mg/d 2. placebo 3. natural process | |
| Outcomes | Depression severity: HRSD Response: >=50% reduction in HRSD calculated from mean&SD | |
| Notes | ||
| Risk of bias | ||
| Bias | Authors' judgement | Support for judgement |
| Allocation concealment? | Low risk | A ‐ Adequate |
Petracca(100).
| Methods | Allocation: random Blindness: described as double‐blind Duration: 6 weeks | |
| Participants | Diagnosis: DSM‐III‐R dysthymia or major depression Mainly old (mean=72) Patient status unknown | |
| Interventions | 1. clomipramine 100 mg/d 2. placebo | |
| Outcomes | Depression severity: HRSD‐17 Response: >=50 reduction in HRSD‐17 calculated from mean&SD | |
| Notes | ||
| Risk of bias | ||
| Bias | Authors' judgement | Support for judgement |
| Allocation concealment? | Unclear risk | B ‐ Unclear |
Philipp(100).
| Methods | Allocation: random Blindness: described as double‐blind Duration: 8 weeks | |
| Participants | Diagnosis: ICD‐10 moderate depressive episode (mild or severe ones excluded) Mainly adult (range: 18‐65) Outpatients at GPs | |
| Interventions | 1. imipramine 100 mg/d 2. placebo 3. hypericum extract | |
| Outcomes | Depression severity: HRSD‐17 Response: much or very much improved on CGI | |
| Notes | ||
| Risk of bias | ||
| Bias | Authors' judgement | Support for judgement |
| Allocation concealment? | Unclear risk | B ‐ Unclear |
Rampello(100).
| Methods | Allocation: random Blindness: described as double‐blind Duration: 6 weeks | |
| Participants | Diagnosis: DSM‐III‐R major depression or bipolar depression, anxious Mainly adult (range: 18‐62) Outpatients | |
| Interventions | 1. amitriptyline 100 mg/d 2. placebo 3. amineptine | |
| Outcomes | Depression severity: HRSD Response: >=50% reduction in HRSD calculated from mean&SD | |
| Notes | ||
| Risk of bias | ||
| Bias | Authors' judgement | Support for judgement |
| Allocation concealment? | Low risk | A ‐ Adequate |
Reifler(83).
| Methods | Allocation: random Blindness: described as double‐blind Duration: 8 weeks | |
| Participants | Diagnosis: Alzheimer dementia with major depression (DSM‐III) Mainly old (mean=72) Outpatients | |
| Interventions | 1. imipramine 83 mg/d (range?) 2. placebo | |
| Outcomes | Depression severity: HRSD‐17 Response: >=50% reduction in HRSD calculated from mean&SD | |
| Notes | ||
| Risk of bias | ||
| Bias | Authors' judgement | Support for judgement |
| Allocation concealment? | Unclear risk | B ‐ Unclear |
Rickels(100).
| Methods | Allocation: random Blindness: described as double‐blind Duration: 4 weeks | |
| Participants | Diagnosis: "mildly to moderately depressed outpatients (reactive neurotic depression, mixed anxiety‐depressive reaction) Mainly adult (mean=43‐45) Outpatients | |
| Interventions | 1. amitriptyline 100 mg/d 2. placebo | |
| Outcomes | Depression severity: Physician Depression Scale | |
| Notes | ||
| Risk of bias | ||
| Bias | Authors' judgement | Support for judgement |
| Allocation concealment? | Unclear risk | B ‐ Unclear |
Rickels(70).
| Methods | Allocation: random Blindness: described as double‐blind Duration: 4 weeks | |
| Participants | Diagnosis: "symptoms of depression and anxiety" Mainly adult Volunteers | |
| Interventions | 1. amitriptyline 70 mg/d (50‐100 mg/d) 2. placebo | |
| Outcomes | Depression severity: Physician Depression Scale Response: moderate to marked global improvement | |
| Notes | ||
| Risk of bias | ||
| Bias | Authors' judgement | Support for judgement |
| Allocation concealment? | Unclear risk | B ‐ Unclear |
Robertson(75).
| Methods | Allocation: random Blindness: described as double‐blind Duration: 6 weeks | |
| Participants | Diagnosis: epilepsy with RDC major depression Mainly adult (range: 18‐70) Patient status unknown | |
| Interventions | 1. amitriptyline 75 mg/d 2. placebo | |
| Outcomes | Depression severity: HRSD‐21 Response: >=50% reduction in HRSD calculated from mean&SD | |
| Notes | ||
| Risk of bias | ||
| Bias | Authors' judgement | Support for judgement |
| Allocation concealment? | Low risk | A ‐ Adequate |
Rouillon(98).
| Methods | Allocation: random Blindness: described as double‐blind Duration: 8 weeks | |
| Participants | Diagnosis: DSM‐III‐R residual depression Mainly adult (range: 18‐65) Outpatients | |
| Interventions | 1. clomipramine 97.5 mg/d (75‐150 mg/d) 2. placebo | |
| Outcomes | Depression severity: MADRS Response: MADRS<10 | |
| Notes | ||
| Risk of bias | ||
| Bias | Authors' judgement | Support for judgement |
| Allocation concealment? | Unclear risk | B ‐ Unclear |
Schweizer(89).
| Methods | Allocation: random Blindness: described as double‐blind Duration: 8 weeks | |
| Participants | Diagnosis: DSM‐III‐R unipolar major depression, comorbid with various chronic physical conditions Mainly old (range: 65‐89, mean=72) Outpatients | |
| Interventions | 1. imipramine 89 mg/d (25‐150 mg/d) 2. placebo | |
| Outcomes | Depression severity: HRSD‐17 Response: >=50% reduction in HRSD | |
| Notes | ||
| Risk of bias | ||
| Bias | Authors' judgement | Support for judgement |
| Allocation concealment? | Unclear risk | B ‐ Unclear |
Simpson(75vs150).
| Methods | Allocation: random Blindness: described as double‐blind Duration: 6 weeks | |
| Participants | Diagnosis: RDC endogenous major depression Mainly adult (range: 22‐60) Outpatients | |
| Interventions | 1. trimipramine 75 mg/d 2. trimipramine 150 mg/d | |
| Outcomes | Depression severity: HRSD‐21 Response: marked to moderate improvement on CGI | |
| Notes | ||
| Risk of bias | ||
| Bias | Authors' judgement | Support for judgement |
| Allocation concealment? | Unclear risk | B ‐ Unclear |
Tan(70).
| Methods | Allocation: random Blindness: described as double‐blind Duration: 4 weeks | |
| Participants | Diagnosis: "depression" without dementia or major physical illness Mainly old (>65, mean=80) Inpatients | |
| Interventions | 1. lofepramine 70 mg/d 2. placebo | |
| Outcomes | Depression severity: MADRS Response: >=50% reduction in MADRS calculated from mean&SD | |
| Notes | ||
| Risk of bias | ||
| Bias | Authors' judgement | Support for judgement |
| Allocation concealment? | Unclear risk | B ‐ Unclear |
Tetreault(50‐100).
| Methods | Allocation: random Blindness: described as double‐blind Duration: 6 weeks | |
| Participants | Diagnosis: Kiloh & Garside's "neurotic reactive depression" Age not specified Inpatients | |
| Interventions | 1. imipramine 50‐100 mg/d 2. placebo | |
| Outcomes | Depression severity: Wechsler scale Response: >=50% reduction in Wechsler scale calculated from mean&SD | |
| Notes | ||
| Risk of bias | ||
| Bias | Authors' judgement | Support for judgement |
| Allocation concealment? | Unclear risk | B ‐ Unclear |
Thompson(75).
| Methods | Allocation: random Blindness: described as double‐blind Duration: 4 weeks | |
| Participants | Diagnosis: GPs' usual diagnosis of "depression". 73% were RDC definite or probable major depression. Age not specified Outpatients at GPs | |
| Interventions | 1. dothiepin 75 mg/d 2. placebo | |
| Outcomes | Depression severity: HRSD‐17 Response: >=50% reduction in HRSD calculated from mean&SD | |
| Notes | ||
| Risk of bias | ||
| Bias | Authors' judgement | Support for judgement |
| Allocation concealment? | Unclear risk | B ‐ Unclear |
Tyrer(51).
| Methods | Allocation: random Blindness: described as double‐blind Duration: 6 weeks | |
| Participants | Diagnosis: DSM‐III dysthymic disorder Mainly adutl (range: 17‐76) Outpatients at GPs | |
| Interventions | 1. dothiepin 51.3 mg/d (25‐150 mg/d) 2. placebo | |
| Outcomes | Depression severity: MADRS | |
| Notes | ||
| Risk of bias | ||
| Bias | Authors' judgement | Support for judgement |
| Allocation concealment? | Unclear risk | B ‐ Unclear |
Weissman(98).
| Methods | Allocation: random Blindness: described as double‐blind Duration: 6 weeks | |
| Participants | Diagnosis: DSM‐III moderate to severe major depression, with minor chronic physical conditions Mainly old (range: 60‐85) Outpatients | |
| Interventions | 1. imipramine 97.5 mg/d (25‐225 mg/d) 2. placebo | |
| Outcomes | Depression severity: HRSD‐23 Response: >=50% reduction in HRSD calculated from mean&SD | |
| Notes | ||
| Risk of bias | ||
| Bias | Authors' judgement | Support for judgement |
| Allocation concealment? | Unclear risk | B ‐ Unclear |
WHO‐Cali(75vs150).
| Methods | Allocation: random Blindness: described as double‐blind Duration: 4 weeks | |
| Participants | Diagnosis: ICD‐9 manic‐depressive illness or neurotic depression Mainly adult (range: 18‐65) Outpatients (70%) and inpatients (30%) | |
| Interventions | 1. amitriptyline 37.5‐75 mg/d 2. amitriptyline 75‐150 mg/d | |
| Outcomes | Depression severity: HRSD‐17 Response: >=50% reduction in HRSD calculated from mean&SD | |
| Notes | ||
| Risk of bias | ||
| Bias | Authors' judgement | Support for judgement |
| Allocation concealment? | Unclear risk | B ‐ Unclear |
WHO‐Lucknow(75vs150).
| Methods | Allocation: random Blindness: described as double‐blind Duration: 4 weeks | |
| Participants | Diagnosis: ICD‐9 manic‐depressive illness or neurotic depression Mainly adult (range: 18‐65) Outpatients (20%) and inpatients (80%) | |
| Interventions | 1. imipramine 37.5‐75 mg/d 2. imipramine 75‐150 mg/d | |
| Outcomes | Depression severity: HRSD‐17 Response: >=50% reduction in HRSD calculated from mean&SD | |
| Notes | ||
| Risk of bias | ||
| Bias | Authors' judgement | Support for judgement |
| Allocation concealment? | Unclear risk | B ‐ Unclear |
WHO‐Nagasaki(75vs150.
| Methods | Allocation: random Blindness: described as double‐blind Duration: 4 weeks | |
| Participants | Diagnosis: ICD‐9 manic‐depressive illness or neurotic depression Mainly adult (range: 18‐65) Outpatients (85%) and inpatients (15%) | |
| Interventions | 1. amitriptyline 37.5‐75 mg/d 2. amitriptyline 75‐150 mg/d | |
| Outcomes | Depression severity: HRSD‐17 Response: >=50% reduction in HRSD calculated from mean&SD | |
| Notes | ||
| Risk of bias | ||
| Bias | Authors' judgement | Support for judgement |
| Allocation concealment? | Unclear risk | B ‐ Unclear |
WHO‐Nashville(75vs15.
| Methods | Allocation: random Blindness: described as double‐blind Duration: 4 weeks | |
| Participants | Diagnosis: ICD‐9 manic‐depressive illness or neurotic depression Mainly adult (range: 18‐65) Outpatients | |
| Interventions | 1. imipramine 37.5‐75 mg/d 2. imipramine 75‐150 mg/d | |
| Outcomes | Depression severity: HRSD‐17 Response: >=50% reduction in HRSD calculated from mean&SD | |
| Notes | ||
| Risk of bias | ||
| Bias | Authors' judgement | Support for judgement |
| Allocation concealment? | Unclear risk | B ‐ Unclear |
BDI: Beck Depression Inventory CGI: Clinical Global Impression HRSD: Hamilton Rating Scale for Depression MADRS: Montgomery‐Asberg Depression Rating Scale MMPI: Minnesota Multiphasic Personality Inventory MMPI‐D: MMPI Depression Scale RDC: Research Diagnostic Criteria Zung SDS: Zung Self‐rating Depression Scale
Characteristics of excluded studies [ordered by study ID]
| Study | Reason for exclusion |
|---|---|
| Gordon(25‐100) | Participants were suffering from severe COPD (chronic obstructive pulmonary disease) and no one satisfied DSM‐III criteria for depression. |
| Indaco(50) | Although the researchers administered Zung's SDS, only 3 out of 36 scored above the traditional cutoff for depression (Zung's SDS>=49). |
| Kieburtz(85) | Participants were suffering from painful neuropathy due to HIV and there is no mention that they (or at least most of them) were suffering from depression. |
| Max(65) | Participants were suffering from postherpetic neuralgia and we do not know how may would have met diagnostic criteria for major depression. |
| Max(90) | Participants were suffering from painful diabetic neuropathy and we do not know how may would have met diagnostic criteria for major depression. |
| Noone(30) | Participants were suffering from migraine and we do not know how may would have met diagnostic criteria for major depression. |
| Okasha(50) | Participants were suffering from psychogenic headache and we do not know how may would have met diagnostic criteria for major depression. |
| Perini(75) | Participants were suffering from alopecia areata and we do not know how may would have met diagnostic criteria for major depression. |
| Pfaffenrath(50‐75) | Participants were suffering from tension headache and we do not know how may would have met diagnostic criteria for major depression. |
| Sharav(24vs130) | Participants were suffering from chronic oral‐facial pain. Less than half were judged depressed according to Hamilton Rating Scale for Depression. |
| Sheikh(78) | Participants were suffering from panic disorder and we do not know how may would have met diagnostic criteria for major depression. |
| Sundblad(50) | Participants were suffering from premenstual syndrome and none satisfied DSM‐III‐R ciriteria for major depression or dysthymia for the past two years. |
SDS=Self‐rating Depression Scale
Contributions of authors
TAF developed the idea of this systematic review and did the literature search, study selection, data extraction, and data analysis. HMcG did the literature search, study selection, and data extraction. CB did the study selection and helped in the interpretation of the results. All the investigators contributed to the writing of the paper and will act as guarantors. We thank Gordon Guyatt and David Streiner for their helpful comments on earlier drafts.
Sources of support
Internal sources
No sources of support supplied
External sources
St. Luke's Life Science Institute, Japan.
Declarations of interest
TAF has received fees for speaking from several pharmaceutical companies, some of which manufacture various types of antidepressants such as trazodone, paroxetine, fluvoxamine and milnacipran.
Edited (no change to conclusions)
References
References to studies included in this review
Ahmed(50) {published data only}
- Ahmed MH, Onyemelukwe GC, Onyewoto II. A double blind controlled clinical trial of benzoctamine (Tacitin) and imipramine (Tofranil) in the treatment of "internal heat" and its associated symptoms. East African Medical Journal 1988;65(4):230‐7. [PubMed] [Google Scholar]
Blashki(75&150) {published data only}
- Blashki TG, Mowbray R, Davies B. Controlled trial of amitriptyline in general practice. BMJ 1971;1(741):133‐8. [DOI] [PMC free article] [PubMed] [Google Scholar]
Brick(30) {published data only}
- Brick H, Doub WH Jr, Perdue WC. Effects of amitriptyline on depressive and anxiety states in penitentiary inmates. Diseases of the Nervous System 1962;23:572‐8. [PubMed] [Google Scholar]
Burch(40vs158) {published data only}
- Burch JE, Ahmed O, Hullin RP, Mindham RH. Antidepressive effect of amitriptyline treatment with plasma drug levels controlled within three different ranges. Psychopharmacology 1988;94(2):197‐205. [DOI] [PubMed] [Google Scholar]
Burch(58vs144) {published data only}
- Burch JE, Ahmed O, Hullin RP, Mindham RH. Antidepressive effect of amitriptyline treatment with plasma drug levels controlled within three different ranges. Psychopharmacology 1988;94(2):197‐205. [DOI] [PubMed] [Google Scholar]
Couch(94) {published data only}
- Couch JR, Hassanein RS. Amitriptyline in migraine prophylaxis. Archives of Neurology 1979;36(11):695‐9. [DOI] [PubMed] [Google Scholar]
Diamond(<60) {published data only}
- Diamond S, Baltes BJ. Chronic tension headache ‐ treated with amitriptyline ‐ a double‐blind study. Headache 1971;11(3):110‐6. [DOI] [PubMed] [Google Scholar]
DUAG(25‐75vs125‐200) {published data only}
- Gram LF, Kragh‐Sorensen P, Bech P, Bolwig TG, Vestergaard P, Larsen JK. Clomipramine dose‐effect study in patients with depression: clinical end points and pharmacokinetics. Clinical Pharmacology and Therapeutics 1999;66(2):152‐65. [DOI] [PubMed] [Google Scholar]
Fryer(100) {published data only}
- Fryer DG, Timberlake WD. A trial of imipramine (Tofranil) in depressed patients with chronic physical disease. Journal of Chronic Diseases 1963;16:173‐8. [DOI] [PubMed] [Google Scholar]
Goldberg(78) {published data only}
- Goldberg HL, Finnerty RJ, Cole JO. Doxepin: is a single daily dose enough?. American Journal of Psychiatry 1974;131(9):1027‐9. [DOI] [PubMed] [Google Scholar]
- Goldberg HL, Finnery RJ. The use of doxepin in the treatment of symptoms of anxiety neurosis and accompanying depression: a collaborative controlled study. American Journal of Psychiatry 1972;129(1):74‐7. [DOI] [PubMed] [Google Scholar]
Goldberg(92) {published data only}
- Goldberg HL, Finnerty RJ. Trazodone in the treatment of neurotic depression. Journal of Clinical Psychiatry 1980;41(12 Pt 1):430‐4. [PubMed] [Google Scholar]
Goldberg(95) {published data only}
- Goldberg HL, Finnerty RJ, Cole JO. Doxepin: is a single daily dose enough?. American Journal of Psychiatry 1974;131(9):1027‐9. [DOI] [PubMed] [Google Scholar]
Hollanda(60) {published data only}
- Hollanda Junior L, Silva CN, da, Lira BS, Ferreira SC. Double‐blind clinical study with a new psychotropic agent: doxepin versus placebo [Estudo clinico, duplocego, com um novo psicotropico: doxepina vs placebo]. O Hospital 1970;77(3):799‐803. [PubMed] [Google Scholar]
Hormazabal(86) {published data only}
- Hormazabal L, Omer LM, Ismail S. Cianopramine and amitriptyline in the treatment of depressed patients ‐ a placebo‐controlled study. Psychopharmacology 1985;86(1‐2):205‐8. [DOI] [PubMed] [Google Scholar]
Houston(50) {published data only}
- Houston J, Berg I, Butler A, McGuire R. Amitriptyline for depressed women with young children in general practice. British Journal of Psychiatry 1983;142:103‐4. [PubMed] [Google Scholar]
Jacobson(75‐100) {published data only}
- Jacobson AF. Doctor‐patient concordance in a placebo‐controlled trial of limbitrol versus its components. Psychopharmacology Bulletin 1978;14(3):61‐3. [PubMed] [Google Scholar]
Jenkins(75) {published data only}
- Jenkins DG, Ebbutt AF, Evans CD. Tofranil in the treatment of low back pain. Journal of International Medical Research 1976;4(2 suppl):28‐40. [PubMed] [Google Scholar]
Kerr(55) {published data only}
- Kerr MM. Amitriptyline in emotional states at the menopause.. New Zealand Medical Journal 1970;72(461):243‐5. [PubMed] [Google Scholar]
L.‐Hofmann(75) {published data only}
- Laederach‐Hofmann K, Graf C, Horber F, Lippuner K, Lederer S, Michel R, et al. Imipramine and diet counseling with psychological support in the treatment of obese binge eaters: a randomized, placebo‐controlled double‐blind study. International Journal of Eating Disorders 1999;26(3):231‐44. [DOI] [PubMed] [Google Scholar]
Lecrubier(100) {published data only}
- Boyer P, Lecrubier Y. Atypical antipsychotic drugs in dysthymia: Placebo controlled studies of amisulpride versus imipramine, versus amineptine. European Psychiatry: the Journal of the Association of European Psychiatrists 1996;11(Suppl 3):135S‐40S. [Google Scholar]
- Lecrubier Y, Boyer P, Turjanski S, Rein W. Amisulpride versus imipramine and placebo in dysthymia and major depression. Amisulpride Study Group. Journal of Affective Disorders 1997;43(2):95‐103. [DOI] [PubMed] [Google Scholar]
Macfarlane(25‐75) {published data only}
- Macfarlane JG, Jalali S, Grace EM. Trimipramine in rheumatoid arthritis: a randomized double‐blind trial in relieving pain and joint tenderness. Current Medical Research and Opinion 1986;10(2):89‐93. [DOI] [PubMed] [Google Scholar]
Morakinyo(75) {published data only}
- Morakinyo VO. Amytriptyline and chlordiazepoxide (Limbitrol) in depressive states in Nigeriansa double‐blind study. African Journal of Medical Sciences 1970;1(4):409‐14. [PubMed] [Google Scholar]
Murphy(100) {published data only}
- Murphy JE. Mianserin in the treatment of depressive illness and anxiety states in general‐practice. British Journal of Clinical Pharmacology 1978;5(Suppl 1):81S‐5S. [PMC free article] [PubMed] [Google Scholar]
- Murphy JE, Donald JF, Molla AL. Mianserin in the treatment of depression in general‐practice. Practitioner 1976;217(1297):135‐8. [PubMed] [Google Scholar]
Nandi(97) {published data only}
- Nandi DN, Ajmany S, Ganguli H, Banerjee G, Boral GC, Ghosh A, Sarkar S. A clinical evaluation of depressives found in a rural survey in India.. British Journal of Psychiatry 1976;128:523‐7. [DOI] [PubMed] [Google Scholar]
Petracca(100) {published data only}
- Petracca G, Teson A, Chemerinski E, Leiguarda R, Starkstein SE. A double‐blind placebo‐controlled study of clomipramine in depressed patients with Alzheimer's disease. Journal of Neuropsychiatry and Clinical Neurosciences 1996;8(3):270‐5. [DOI] [PubMed] [Google Scholar]
Philipp(100) {published data only}
- Philipp M, Kohnen R, Hiller K‐O. Hypericum extract versus imipramine or placebo in patients with moderate depression: randomised multicentre study of treatment for eight weeks.. BMJ 1999;319(7224):1534‐8. [DOI] [PMC free article] [PubMed] [Google Scholar]
Rampello(100) {published data only}
- Rampello L, Nicoletti G, Raffaele R, Drago F. Comparative effects of amitriptyline and amineptine in patients affected by anxious depression. Neuropsychobiology 1995;31(3):130‐4. [DOI] [PubMed] [Google Scholar]
Reifler(83) {published data only}
- Reifler BV, Teri L, Raskind M, Veith R, Barnes R, White E, McLean P. Double‐blind trial of imipramine in Alzheimer's disease patients with and without depression. American Journal of Psychiatry 1989;146(1):45‐9. [DOI] [PubMed] [Google Scholar]
- Teri L, Reifler BV, Veith RC, Barnes R, White E, McLean P, Raskind M. Imipramine in the treatment of depressed Alzheimer's patients: impact on cognition. Journal of Gerontology 1991;46(6):P372‐7. [DOI] [PubMed] [Google Scholar]
Rickels(100) {published data only}
- Rickels K, Gordon PE, Jenkins BW, Perloff M, Sachs T, Stepansky W. Drug treatment in depressive illness. Diseases of the Nervous System 1970;31(1):30‐42. [PubMed] [Google Scholar]
- Rickels K, Hesbacher P, Downing RW. Differential drug effects in neurotic depression. Diseases of the Nervous System 1970;31(7):468‐75. [PubMed] [Google Scholar]
Rickels(70) {published data only}
- Rickels K, Csanalosi I, Chung HR, Case WG, Pereira Ogan A, Downing RW. Amitriptyline in anxious‐depressed outpatients: a controlled study. American Journal of Psychiatry 1974;131(1):25‐30. [DOI] [PubMed] [Google Scholar]
Robertson(75) {published data only}
- Robertson MM, Trimble MR. The treatment of depression in patients with epilepsy A double‐blind trial. Journal of Affective Disorders 1985;9(2):127‐36. [DOI] [PubMed] [Google Scholar]
Rouillon(98) {published data only}
- Rouillon F, Markabi S, Febvre N, Phillips R, Vaillant J. Controlled study of treatment of residual depression by clomipramine versus placebo. Encephale 1994;20(2):139‐45. [PubMed] [Google Scholar]
Schweizer(89) {published data only}
- Schweizer E, Rickels K, Hassman H. A double‐blind, placebo‐controlled comparison of imipramine and buspirone in the treatment of major depression in the elderly in the community. Psychopharmacology Bulletin 1994;30(4):639. [Google Scholar]
- Schweizer E, Rickels K, Hassman H, Garcia Espana F. Buspirone and imipramine for the treatment of major depression in the elderly. Journal of Clinical Psychiatry 1998;59(4):175‐83. [DOI] [PubMed] [Google Scholar]
Simpson(75vs150) {published data only}
- Simpson GM, Pi EH, Gross L, Baron D, November M. Plasma levels and therapeutic response with trimipramine treatment of endogenous depression. Journal of Clinical Psychiatry 1988;49(3):113‐6. [PubMed] [Google Scholar]
Tan(70) {published data only}
- Tan RS. Lowering antidepressant dosages in the elderly. Clinical Gerontologist 1995;16(1):67‐70. [Google Scholar]
- Tan RS, Barlow RJ, Abel C, Reddy S, Palmer AJ, Fletcher AE, et al. The effect of low dose lofepramine in depressed elderly patients in general medical wards. British Journal of Clinical Pharmacology 1994;37(4):321‐4. [DOI] [PMC free article] [PubMed] [Google Scholar]
Tetreault(50‐100) {published data only}
- Tetreault L, Doucet P, Blanchet A, Bordeleau JM. Comparative evaluation of the antidepressive properties of opipramol, imipramine and placebo in neurotic depression.. Union Medicale du Canada 1966;95(5):546‐53. [PubMed] [Google Scholar]
Thompson(75) {published data only}
- Thompson C, Thompson CM. The prescribing of antidepressants in general practice II: a placebo‐controlled trial of low‐dose dothiepin. Human Psychopharmacology 1989;4:191‐204. [Google Scholar]
Tyrer(51) {published data only}
- Tyrer P, Seivewright N, Ferguson B, Murphy S, Darling C, Brothwell J, et al. The Nottingham Study of Neurotic Disorder: relationship between personality status and symptoms. Psychological Medicine 1990;20(2):423‐31. [DOI] [PubMed] [Google Scholar]
- Tyrer P, Seivewright N, Murphy S, Ferguson B, Kingdon D, Barczak P, et al. The Nottingham study of neurotic disorder: comparison of drug and psychological treatments. Lancet 1988;2(8605):235‐40. [DOI] [PubMed] [Google Scholar]
Weissman(98) {published data only}
- Weissman MM, Prusoff B, Sholomskas AJ, Greenwald S. A double‐blind clinical trial of alprazolam, imipramine, or placebo in the depressed elderly. Journal of Clinical Psychopharmacology 1992;12(3):175‐82. [PubMed] [Google Scholar]
WHO‐Cali(75vs150) {published data only}
- Anonymous. Dose effects of antidepressant medication in different populations. A world health organization collaborative study. Journal of Affective Disorders 1986;10(Suppl 2):1‐67. [DOI] [PubMed] [Google Scholar]
WHO‐Lucknow(75vs150) {published data only}
- Anonymous. Dose effects of antidepressant medication in different populations A world health organization collaborative study. Journal of Affective Disorders 1986;10(Suppl 2):1‐67. [DOI] [PubMed] [Google Scholar]
WHO‐Nagasaki(75vs150 {published data only}
- Anonymous. Dose effects of antidepressant medication in different populations A world health organization collaborative study. Journal of Affective Disorders 1986;10(Suppl 2):1‐67. [DOI] [PubMed] [Google Scholar]
WHO‐Nashville(75vs15 {published data only}
- Anonymous. Dose effects of antidepressant medication in different populations A world health organization collaborative study. Journal of Affective Disorders 1986;10(Suppl 2):1‐67. [DOI] [PubMed] [Google Scholar]
References to studies excluded from this review
Gordon(25‐100) {published data only}
- Gordon GH, Michiels TM, Mahutte CK, Light RW. Effect of desipramine on control of ventilation and depression scores in patients with severe chronic obstructive pulmonary disease. Psychiatry Research 1985;15(1):25‐32. [DOI] [PubMed] [Google Scholar]
Indaco(50) {published data only}
- Indaco A, Carrieri PB. Amitriptyline in the treatment of headache in patients with Parkinson's disease: a double‐blind placebo‐controlled study. Neurology 1988;38(11):1720‐2. [DOI] [PubMed] [Google Scholar]
Kieburtz(85) {published data only}
- Kieburtz K, Simpson D, Yiannoutsos C, Ellis RJ, Marra CM, McKendall R, et al. A randomized trial of amitriptyline and mexiletine for painful neuropathy in HIV infection. Neurology 1998;51(6):1682‐8. [DOI] [PubMed] [Google Scholar]
Max(65) {published data only}
- Max MB, Schafer SC, Culnane M, Smoller B, Dubner R, Gracely RH. Amitriptyline, but not lorazepam, relieves posherpetic neuralgia. Neurology 1988;38(9):1427‐32. [DOI] [PubMed] [Google Scholar]
Max(90) {published data only}
- Max MB, Culnane M, Schafer SC, Gracely RH, Walther DJ, Smoller B, et al. Amitriptyline relieves diabetic neuropathy pain in patients with normal or depressed mood. Neurology 1987;37(4):589‐96. [DOI] [PubMed] [Google Scholar]
Noone(30) {published data only}
- Noon IF. Clomipramine in the prevention of migraine. Journal of International Medical Research 1980;8(Suppl 3):49‐52. [PubMed] [Google Scholar]
Okasha(50) {published data only}
- Okasha A, Ghaleb HA, Sadek A. A double blind trial for the clinical management of psychogenic headache. British Journal of Psychiatry 1973;122:181‐3. [DOI] [PubMed] [Google Scholar]
Perini(75) {published data only}
- Perini G, Zara M, Cipriani R, Carraro C, Preti A, Gava F, et al. Imipramine in alopecia areata A double‐blind, placebo‐controlled study.. Psychotherapy and Psychosomatics 1994;61(3‐4):195‐8. [DOI] [PubMed] [Google Scholar]
Pfaffenrath(50‐75) {published data only}
- Pfaffenrath V, Diener HC, Isler H, Meyer C, Scholz E, Taneri Z, et al. Efficacy and tolerance of amitriptyline oxide in the treatment of chronic tension‐type headaceh: a multi‐centre double‐blind study vs amitriptyline vs placebo [Wirksamkeit und Vertraeglichkeit vom Amitriptylinoxid beim chronischen Spannungskopfschmerz: eine multizentrische Doppelblindstudie versus Amitriptyline versus Plazebo]. Nervenarzt 1993;64(2):114‐20. [PubMed] [Google Scholar]
Sharav(24vs130) {published data only}
- Sharav Y, Singer E, Schmidt E, Dionne RA, Dubner R. The analgesic effect of amitriptyline on chronic facial pain. Pain 1987;31(2):199‐209. [DOI] [PubMed] [Google Scholar]
Sheikh(78) {published data only}
- Sheikh JI, Swales PJ. Treatment of panic disorder in older adults: a pilot study comparison of alprazolam, imipramine, and placebo. International Journal of Psychiatry in Medicine 1999;29(1):107‐17. [DOI] [PubMed] [Google Scholar]
Sundblad(50) {published data only}
- Sundblad C, Modigh K, Andersch B, Eriksson E. Clomipramine effectively reduces premenstrual irritability and dysphoria: a placebo‐controlled trial. Acta Psychiatrica Scandinavica 1992;85(1):39‐47. [DOI] [PubMed] [Google Scholar]
Additional references
Anderson 2000
- Anderson IM, Nutt DJ, Deakin JFW. Evidence‐based guidelines for treating depressive disorders with antidepressants: a revision of the 1993 British Association for Psychopharmacology guidelines. Journal of Psychopharmacology 2000;14(1):3‐20. [DOI] [PubMed] [Google Scholar]
APA 2000
- American Psychiatric Association. Practice guideline for the treatment of patients with major depressive disorder (Revision). American Journal of Psychiatry 2000;157(Suppl):1‐45. [PubMed] [Google Scholar]
Blashki 1971
- Blashki TG, Mowbry R, Davies B. Controlled trial of amitriptyline in general practice. BMJ 1971;1(741):133‐8. [DOI] [PMC free article] [PubMed] [Google Scholar]
Bollini 1999
- Bollini P, Pampallona S, Tibaldi G, Kupelnick B, Munizza C. Effectiveness of antidepressants: meta‐analysis of dose‐effect relationships in randomised clinical trials. British Journal of Psychiatry 1999;174:297‐303. [DOI] [PubMed] [Google Scholar]
Brugha 1992
- Brugha TS, Bebbington PE. The undertreatment of depression. European Archives of Psychiatry and Neurological Sciences 1992;242(2‐3):103‐8. [DOI] [PubMed] [Google Scholar]
Carson 2000
- Carson AJ. Size does matter: a study of antidepressant prescribing in a general hospital. Psychiatric Bulletin 2000;24:23‐5. [Google Scholar]
Chalmers 1983
- Chalmers TC, Celano P, Sacks HS, Smith H Jr. Bias in treatment assignment in controlled clinical trials. New England Journal of Medicine 1983;309(22):1358‐61. [DOI] [PubMed] [Google Scholar]
Colditz 1989
- Colditz GA, Miller JN, Mosteller F. How study design affects outcomes in comparisons of therapy. I: medical. Statistics in Medicine 1989;8(4):441‐54. [DOI] [PubMed] [Google Scholar]
DGP 1993
- Depression Guideline Panel. Clinical Practice Guideline: Depression in Primary Care 2: Treatment of Major Depression. Vol. AHCPR Publication 93‐0551, Rockville, MD: US Department of Heath and Human Services, Agency for Health Care Policy and Research, 1993. [Google Scholar]
Donoghue 1996
- Donoghue JM, Tylee A. The treatment of depression: prescribing patterns of antidepressants in primary care in the UK. British Journal of Psychiatry 1996;168:164‐8. [DOI] [PubMed] [Google Scholar]
Furukawa 2000
- Furukawa TA, Kitamura T, Takahashi K. Treatment received by depressed patients in Japan and its determinants: naturalistic observation from a multi‐center collaborative follow‐up study. Journal of Affective Disorders 2000;60(3):173‐9. [DOI] [PubMed] [Google Scholar]
Furukawa 2001
- Furukawa TA, Streiner DL, Young LT. Antidepressant and benzodiazepine for major depression (Cochrane Review). The Cochrane Library 2001, Issue Issue 4. [DOI] [PubMed] [Google Scholar]
Furukawa 2002
- Furukawa TA, Guyatt GH, Griffith LE. Can we individualize the 'number needed to treat'? An empirical study of summary effect measures in meta‐analyses. International Journal of Epidemiology 2002;31(1):72‐6. [DOI] [PubMed] [Google Scholar]
Gringras 1975
- Gringras M. A comparison of a low and high dosage regime of clomipramine (Anafrani). Journal of International Medical Research 1975;3(Suppl 1):47‐54. [Google Scholar]
Heeren 1997
- Heeren TJ, Derksen P, Heycop Ten Ham BF, Gent PPJ. Treatment, outcome and predictors of response in elderly depressed in‐patients. British Journal of Psychiatry 1997;170:436‐40. [DOI] [PubMed] [Google Scholar]
Hirschfeld 1997
- Hirschfeld RM, Keller MB, Panico S, Arons BS, Barlow D, Davidoff F, et al. The National Depressive and Manic‐Depressive Association consensus statement on the undertreatment of depression. JAMA 1997;277(4):333‐40. [PubMed] [Google Scholar]
Joffe 1996
- Joffe R, Sokolov S, Streiner D. Antidepressant treatment of depression: a metaanalysis. Canadian Journal of Psychiatry. Revue Canadienne de Psychiatrie 1996;41(10):613‐6. [DOI] [PubMed] [Google Scholar]
Keller 1982
- Keller MB, Klerman GL, Lavori PW, Fawcett JA, Coryell W, Endicott J. Treatment received by depressed patients. JAMA 1982;248(15):1848‐55. [PubMed] [Google Scholar]
Keller 1986
- Keller MB, Lavori PW, Klerman GL, Andreasen NC, Endicott J, Coryell W, et al. Low levels and lack of predictors of somatotherapy and psychotherapy received by depressed patients. Archives of General Psychiatry 1986;43(5):458‐66. [DOI] [PubMed] [Google Scholar]
MacDonald 1996
- MacDonald TM, McMahon AD, Reid IC, Fenton GW, McDevitt DG. Antidepressant drug use in primary care: a record linkage study in Tayside, Scotland. BMJ 1996;313(7061):860‐1. [DOI] [PMC free article] [PubMed] [Google Scholar]
Moher 1998
- Moher D, Pham B, Jones A, Cook DJ, Jadad AR, Moher M, et al. Does quality of reports of randomised trials affect estimates of intervention efficacy reported in meta‐analyses?. Lancet 1998;352(9128):609‐13. [DOI] [PubMed] [Google Scholar]
Moore 1997
- Moore MV. More on what is an effective dose. BMJ 1997;314(7083):827. [PMC free article] [PubMed] [Google Scholar]
Mulrow 1997
- Mulrow CD, Oxman AD. Cochrane Collaboration Handbook [updated 1 March 1997]. Oxford: Update Software, 1997. [Google Scholar]
Oxman 1992
- Oxman AD, Guyatt GH. A consumer's guide to subgroup analyses. Annals of Internal Medicine 1992;116(1):78‐84. [DOI] [PubMed] [Google Scholar]
Paykel 1988
- Paykel ES, Hollyman JA, Freeling P, Sedgwick P. Predictors of therapeutic benefit from amitriptyline in mild depression: a general practice placebo‐controlled study. Journal of Affective Disorders 1988;14(1):83‐95. [DOI] [PubMed] [Google Scholar]
Paykel 1992
- Paykel ES, Priest RG. Recognition and management of depression in general practice: consensus statement. BMJ 1992;305(6863):1198‐202. [DOI] [PMC free article] [PubMed] [Google Scholar]
QAP 1983
- Quality Assurance Project. A treatment outline for depressive disorders. Australian and New Zealand Journal of Psychiatry 1983;17(2):129‐48. [DOI] [PubMed] [Google Scholar]
Rosholm 1993
- Rosholm JU, Hallas J, Gram LF. Outpatient utilization of antidepressants: a prescription database analysis. Journal of Affective Disorders 1993;27(1):21‐8. [DOI] [PubMed] [Google Scholar]
Schulz 1995
- Schulz KF, Chalmers I, Hayes RJ, Altman DG. Empirical evidence of bias: dimensions of methodological quality associated with estimates of treatment effects in controlled trials. JAMA 1995;273(5):408‐12. [DOI] [PubMed] [Google Scholar]
Simon 1993
- Simon G, Korff M, Wagner EH, Barlow W. Patterns of antidepressant use in community practice. General Hospital Psychiatry 1993;15(6):399‐408. [DOI] [PubMed] [Google Scholar]
Simpson 1976
- Simpson GM, Lee JH, Cuculic Z, Kellner R. Two dosages of imipramine in hospitalized endogenous and neurotic depressives. Archive of General Psychiatry 1976;33(3):1093‐102. [DOI] [PubMed] [Google Scholar]
Stevens 1997
- Stevens L, Kinmonth AL, Peveler R, Thompson C. The Hampshire Depression Project: development and piloting of clinical practice guidelines and education about depression in primary health care. Medical Education 1997;31(5):375‐9. [DOI] [PubMed] [Google Scholar]
Thompson 1989
- Thompson C, Thompson CM. The prescribing of antidepressants in general practice II: a placebo‐controlled trial of low‐dose dothiepin. Human Psychopharmacology 1989;4:191‐204. [Google Scholar]
Trindade 1997
- Trindade, E, Menon, D. Selective serotonin reuptake inhibitors (SSRIs) for major depression. Part I: Evaluation of the clinical literature (Report 3E). Ottawa: Canadian Coordinating Office for Health Technology Assessment, 1997. [Google Scholar]
Wells 1994
- Wells KB, Katon W, Rogers B, Camp P. Use of minor tranquilizers and antidepressant medications by depressed outpatients: results from the Medical Outcomes Study. American Journal of Psychiatry 1994;151(5):694‐700. [DOI] [PubMed] [Google Scholar]
Yamada 2000
- Yamada K, Nishimura M, Honda I, Abe K, Oshiyama N, Ogawa T, et al. Antidepressant drug use in primary care. Katei Iryo (Family Medicine) 2000;7:10‐7. [Google Scholar]