Abstract
Background
Stroke care pathways have the potential to promote organised and efficient patient care that is based on best evidence and guidelines, but evidence to support their use is unclear.
Objectives
To assess the effects of care pathways, compared with standard medical care, among patients with acute stroke who had been admitted to hospital.
Search methods
We searched the Cochrane Stroke Group Trials Register (last searched in June 2003), the Cochrane Central Register of Controlled Trials (The Cochrane Library, Issue 2, 2003), MEDLINE (1975 to June 2003), EMBASE (1980 to June 2003), CINAHL (1982 to June 2003), ISI Proceedings: Science & Technology (1990 to November 2003), and HealthSTAR (1994 to May 2001). We also handsearched the Journal of Integrated Care Pathways (2001 to 2003), formerly Journal of Managed Care (1997 to 1998) and Journal of Integrated Care (1998 to 2001). Reference lists of articles were searched.
Selection criteria
Randomised controlled trials and non‐randomised studies that compared care pathway care with standard medical care.
Data collection and analysis
One reviewer selected studies for inclusion and the other independently checked the decisions. Two reviewers independently assessed the methodological quality of the studies. One reviewer extracted the data and the other checked the extracted data.
Main results
Three randomised controlled trials (340 patients) and 12 non‐randomised studies (4081 patients) were included. There was significant statistical heterogeneity in the analysis of many of the outcomes. We found no significant difference between care pathway and control groups in terms of death or discharge destination. Patients managed with a care pathway were: (1) more dependent at discharge (P = 0.04); (2) less likely to suffer a urinary tract infection (Odds Ratio (OR) 0.51, 95% Confidence Interval (CI) 0.34 to 0.79); (3) less likely to be readmitted (OR 0.11, 95% CI 0.03 to 0.39); and (4) more likely to have neuroimaging (OR 2.42, 95% CI 1.12 to 5.25). Evidence from randomised trials suggested that patient satisfaction and quality of life were significantly lower in the care pathway group (P = 0.02 and P < 0.005 respectively).
Authors' conclusions
Use of stroke care pathways may be associated with positive and negative effects. Since most of the results have been derived from non‐randomised studies, they are likely to be influenced by potential biases and confounding factors. There is currently insufficient supporting evidence to justify the routine implementation of care pathways for acute stroke management or stroke rehabilitation.
Plain language summary
In‐hospital care pathways for stroke
The effects of using care pathways to manage people admitted to hospital with stroke are not clear. Care in a hospital stroke unit can reduce the risks of death and disability after stroke. Care pathways aim to promote organised and efficient patient care based on the best evidence and guidelines. The review found that patients treated within a care pathway may be less likely to suffer some complications (e.g. urine infections), and more likely to have certain tests (e.g. brain scans). However, the use of care pathways may also reduce the patient's likelihood of functioning independently when discharged from hospital, their quality of life, and their satisfaction with hospital care. Currently, there is not enough evidence to justify introducing care pathways for the routine care of all patients with stroke. Further research is needed to find out if care pathways for stroke do more good than harm.
Background
Stroke is a major health problem in both the developed and developing world (Kaste 1998; Rothwell 2001). In industrialised countries, it is the second most common cause of death after ischaemic heart disease (Murray 1997) and almost half of all stroke survivors are left with a permanent handicap (Bamford 1991). Better treatment of patients with stroke is now a government priority in many countries.
At present, one of the most effective treatments for acute stroke is admission to a stroke unit which offers well‐organised multidisciplinary care. Stroke patients admitted to a stroke unit are more likely to be alive, independent, and living at home at one year (SUTC 2000). However, there are significant variations between hospitals in: their treatment strategy for acute stroke; organisation of services; access to stroke unit care; and clinical outcomes (Ebrahim 1999; Rudd 1999). Implementation of a stroke care pathway may be a method of promoting organised and efficient patient care that is based on the best‐available evidence and guidelines. This, in turn, should reduce variations in the delivery of stroke care.
Care pathways can be regarded as complex interventions made up of a number of components (Campbell 2000). In general, a care pathway can be defined as a plan of care that aims to promote organised and efficient multidisciplinary patient care that is based on the best available evidence and guidelines, for a specific condition. It is often implemented with some form of education (Pearson 1995) and usually forms all or part of the patient record. It documents the care given and can facilitate the evaluation of outcomes for continuous quality improvement (Overill 1998). A care pathway focuses on the practical delivery of multidisciplinary care in the form of daily written care plans with prompts to highlight important interventions. It is intended to assist healthcare professionals to achieve pre‐specified patient goals efficiently while improving quality of care (Hydo 1995; Lanska 1998). Care pathways are also known by other names such as clinical pathway, critical pathway, critical path method, and Care Maps™.
In the United States (US), care pathways have been applied to health care since the 1980s to improve efficiency of care and reduce hospitalisation costs (Pearson 1995). Care pathways have since been introduced for acute stroke management (Baker 1998; Hydo 1995; Lanska 1998; Summers 1998) and stroke rehabilitation (Falconer 1993). In the United Kingdom (UK), care pathways have been used since the 1990s to promote well‐organised and evidence‐based stroke care. There are some reports to suggest that care pathways might reduce length of hospital stay, costs, complications, and even mortality (Lanska 1998). However, the effects of care pathways on stroke management are not clear. This review sets out to assess the effects of care pathways on stroke management in hospital.
Objectives
We aimed to assess the effects of care pathways, compared with standard medical care, among patients with acute stroke who had been admitted to hospital. In particular, we aimed to assess the effects on functional outcome, process of care, quality of life, and hospitalisation costs.
Methods
Criteria for considering studies for this review
Types of studies
We sought unconfounded randomised controlled trials that compared care pathway care with standard medical care. However, since we anticipated that there would only be a few of these studies, we also sought studies with weaker research designs, i.e. quasi‐randomised trials, controlled and uncontrolled before‐and‐after studies, and interrupted time series. We sought studies with at least two study groups for comparison, with due allowance for the large number of biases that are likely to be associated with non‐randomised designs. When a study design suggested that some degree of confounding was present, we aimed to note the confounding factors and perform appropriate sensitivity analysis using these factors. Furthermore, we included only studies with an adequate description of its methodology such that studies claiming certain effects of care pathways but without adequate information were to be excluded. Randomised and non‐randomised studies were analysed separately as non‐randomised comparisons can overestimate treatment effects (Chalmers 1983; Sacks 1982), and the size and direction of the bias can be unpredictable (Deeks 2003).
Types of participants
We used the World Health Organization definition of stroke for this review (WHO 1989). We included all studies that recruited patients who had been admitted to hospital with a new neurological deficit consistent with a clinical diagnosis of stroke. However, we excluded studies that recruited only patients with subarachnoid haemorrhage since the management of these patients would have been very different to the generality of stroke patients. Studies that recruited all types of ischaemic and haemorrhagic strokes (including subarachnoid haemorrhage) were included. We also included studies that recruited patients with a mixture of conditions including stroke, but only where the results for stroke patients could be clearly extracted.
Types of interventions
We sought to assess whether care pathways improved outcome compared with standard care. We therefore included any study that had attempted to evaluate such an intervention. We defined a care pathway as a plan of care that: (1) involved two or more of the following aspects of care: assessment, investigation, diagnosis, or treatment; and (2) involved two or more disciplines (e.g. medical, nursing, physiotherapy, occupational therapy, speech and language therapy, dietician)
Furthermore, there were three main clinical settings for which care pathways were designed. (1) Acute stroke only, defined here as the first two weeks of hospital admission (2) Stroke rehabilitation only (3) Acute stroke and rehabilitation
These clinical settings applied to the care pathway rather than when the patients were recruited for the studies; in one study, patients were recruited within two weeks of stroke for a care pathway designed for stroke rehabilitation (Sulch 2000). We included studies that examined "case management", "disease management", "stroke protocols", or "stroke programmes" only if the description of the plan of care satisfied the above definition. We excluded those that had been specifically designed for a single aspect of care (e.g. diagnosis, administration of thrombolytic therapy). We also excluded studies that have examined care pathways designed only for patients undergoing carotid endarterectomy. We sought advice from the Effective Practice and Organisation of Care (EPOC) group regarding the definition of a care pathway for this review.
Types of outcome measures
Primary outcome measures
The primary measure of outcome was the proportion of patients who were dead or dependent at the end of the scheduled follow‐up period. For studies that did not systematically report dependency, we sought data on the proportion of patients who required long‐term institutional care. "Independent" individuals were defined as those who did not require regular physical assistance from another person for activities of daily living, such as mobility, dressing, transfers, and feeding. "Dependent" individuals were those who failed to meet one or more of these criteria. The criteria for independence were approximately equivalent to a modified Rankin score of 0 to 2, or a Barthel Index of greater than 18/20 (Wade 1992). Institutional care was defined as care within a residential home, nursing home, or hospital at the end of scheduled follow up or at discharge.
Secondary outcome measures
In this review, secondary outcome measures are the other outcome measures that have been reported in the included studies. We sought to include as wide a variety of outcomes as possible in order to describe the full range of potential effects of care pathway care. These included:
complications during the hospital stay (e.g. pneumonia, urinary tract infection, deep vein thrombosis, pressure sores);
use of investigations (e.g. proportion of patients having a computed tomography brain scan or carotid duplex study);
use of medications (e.g. inappropriate commencement of new antihypertensive agents in the acute period);
readmission or emergency department attendance;
patient and carer satisfaction;
quality of life (using recognised scoring system such as SF36 and Euroqol);
duration of hospital stay;
cost of hospitalisation.
Search methods for identification of studies
See: 'Specialised register' section in Cochrane Stroke Group
Relevant trials were identified in the Cochrane Stroke Group Trials Register, which was last searched by the Review Group Co‐ordinator in June 2003. In addition, we undertook specialised searches of the following electronic databases (Appendix 1):
Cochrane Central Register of Controlled Trials (The Cochrane Library, Issue 2, 2003);
MEDLINE (1975 to June 2003) ‐ since care pathways for healthcare have only existed since the beginning of 1980s, we only searched MEDLINE from 1975 onwards;
EMBASE (1980 to June 2003);
CINAHL (1982 to June 2003);
ISI Proceedings: Science & Technology (1990 to November 2003) ‐ a database of conference proceedings from ISI Web of Knowledge;
HealthSTAR (1994 to May 2001) ‐ HealthSTAR (Health Services Technology, Administration and Research) was an online bibliographic information service that resided as a separate database available from the National Library of Medicine, and it has been integrated into other databases since 2001.
We also handsearched the Journal of Integrated Care Pathways (2001 to 2003), formerly Journal of Managed Care (1997 to 1998) and Journal of Integrated Care (1998 to 2001). We also checked the reference lists of articles retrieved from the above searches and attempted to contact authors of relevant articles where clarification of information was needed. Personal contact with colleagues and researchers identified any ongoing and unpublished studies.
Data collection and analysis
Selection of trials
One reviewer (JK) screened all the titles, abstracts and keywords of publications identified by the searches to assess their eligibility. The reviewer was blinded to the names of the authors, institution where the work had been carried out, and the journal (by printing out the titles, abstracts and keywords without the author names etc). Publications that clearly did not meet the inclusion criteria were excluded at this stage. The other reviewer (PS) then independently checked the decisions. We then obtained a paper copy of the full publication of every study that was possibly relevant. Both reviewers then assessed them according to pre‐specified selection criteria. We excluded articles that did not contain results of any study (e.g. a report simply describing a new care pathway). We resolved any disagreement by discussion.
Assessment of methodological quality
Two reviewers (JK and PS) independently assessed the methodological quality of all the included studies and recorded the findings. We noted the important aspects of methodology: study design, type of control, method of allocation concealment, completeness of follow‐up, and the presence of blinding for assessments of non‐fatal outcomes. We did not use pre‐printed selection forms or an overall scoring system to evaluate methodological quality.
Data extraction
One reviewer (JK) extracted the data onto a data extraction form, and the other reviewer (PS) independently checked the extracted data. Data reported in the published sources were used for analyses in this review, but where additional data were needed (e.g. if there were missing data), we attempted to contact the chief investigator of the studies. Pilot testing of the data collection forms was done on a sample of studies to improve reliability. Disagreement was resolved by discussion and a consensus decision was made.
Data analysis
Data analysis abided by the guidelines set out by The Cochrane Collaboration regarding statistical methods (Mulrow 1999). We also consulted a statistician throughout the review. For dichotomous data, we expressed relative treatment effects as odds ratios with 95% confidence intervals. For continuous data, we used weighted mean difference with 95% confidence intervals. A p value of less than 0.05 was taken as significant. The denominators used in the analyses were the total numbers of patients included in the studies; dead patients have not been removed from any comparison groups.
Heterogeneity between studies was tested using the standard chi‐squared test. We used a 'random effects' method for all outcome measures, but it should be noted that the 'random effects' method gives more weight to the smaller studies than the 'fixed effect' method, and smaller studies are often of poorer quality and may be more susceptible to bias (Mulrow 1999). Readers of this review must be aware of the presence of between‐study variations for certain outcome measures and be extremely cautious when interpreting these results.
Results
Description of studies
Please also see Table 2.
1. Organisational components of the care pathways assessed by the included studies.
| Author, Year | State, Country | Clinical Setting | Organisation of care |
| Baker 1998 | Indianapolis, USA | Acute stroke | Patients were cared for in a neurology/orthopaedic ward in a community hospital. Stroke patients were screened according to specific guidleines for suitability for case management using a clinical pathway. Clinical pathway was also evaluated by variance analysis. A 2‐year pilot study was undertaken after implementation |
| Bowen 1994 | Washington, USA | Acute stroke | Unclear what type of ward in which patients in either group were cared for, but mostly likely acute general internal medical ward within an urban community hospital. Nurse initiated stroke protocol on admission, starting with algorithm at the emergency department and continued to the hospital unit with standard order sheets and protocol. Protocol was approved by specialists and primary care physicians. Resident doctors received specific education on stroke protocol. Stroke protocol was introduced as a method for cost‐containment |
| Crawley 1996 | Georgia, USA | Acute stroke and rehabilitation | Patients were cared for in a neurosciences unit in a teaching hospital. Case management using a criical path was developed by a multidiscplinary team and managed by a case manager (an assistant head‐nurse), who followed the patient from admission to discharge. Critical path was also evaluated by variance analysis |
| Falconer 1993 | Illinois, USA | Stroke rehabilitation | Unclear what type of ward in which patients in either group were initially cared for (a general medical ward or acute stroke unit), but patients were transferred to a rehabilitation unit in a specialised rehabilitation institute. Leader of the multidisciplinary team was the physician. A critical path (and the ideal length of stay) was generated by the computer according the therapy required |
| Hamrin 1990 | Linkoping, Sweden | Acute stroke and rehabilitation | Patients were cared for in a general internal medical ward in a teaching hospital. Numbers of nursing staff and therapists were similar in both groups. The project group was involved in multidisciplinary team meetings, educational meetings and communication with primary care team. |
| Kwan 2004 | Edinburgh, UK | Acute stroke | Patients were managed on the acute stroke unit which was a 10‐bedded unit situated within a 25‐bedded elderly care ward. Medical cover was provided by two stroke specialist consultants, one senior and one junior medical officer. The nurse‐to‐bed ratio was between 0.15 (night shift) to 0.27 (early shift). Rehabilitative therapy was provided by 1.5 whole time equivalent (WTE) physiotherapist, 1.5 WTE occupational therapist, 0.5 WTE speech therapist, a dietician and a social worker. Patients' progress was discussed at the weekly multidisciplinary team meetings. The care pathway was developed by the stroke team to guide patient care during the first five days of admission. The development process consisted of review of research evidence and clinical guidelines, design of the ICP document, and its implementation on the unit with training sessions for the staff. |
| Mosimaneotsile 2000 | Hawaii, USA | Stroke rehabilitation | Patients were cared for in a 100‐bedded private rehabilitation unit which catered for all types of patients including stroke. Multidisciplnary assessment was performed within 24 hours of admission. Reports of the assessments then guided treatment, goal‐setting and discharge planning. Regular multidisciplinary team conferences were conducted to discuss the patient's goals and progress. |
| Odderson 1993 | Washington, USA | Acute stroke | Unclear what type of ward in which patients in either group were cared for, but mostly likely a rehabilitation ward within an urban community hospital. Care pathway was developed by teams of physicians and professions allied to medicine, with specific inclusion and exclusion criteria. Patient care followed specific guidelines (e.g. deep vein thrombosis prevention, artificial feeding, bowel programme). Medicare was introduced in 1982 and prospective payment system in 1983 ‐ hospital was asked to reduce length of stay for certain conditions such as stroke |
| Pasquarello 1990 | Texas, USA | Acute stroke | Unclear what type of ward in which patients in either group were cared for, but mostly likely a general internal medical ward within a teaching hospital. Patients in the stroke programme were exclusively managed by a clinical nurse specialist (CNS). Patient education was provided by weekly group meetings (stroke recovery group) for 45 minutes. CNS was also involved in post‐discharge care, outpatient program and nursing education |
| Ross 1997 | Michigan, USA | Acute stroke | Unclear what type of ward in which patients in either group were cared for, but mostly likely a general internal medical ward within a community hospital. Critical pathway was developed by multidisciplinary task force and consisted of specific protocols (e.g. telemetry, carotid duplex <24 hours, two CT scans) and pre‐defined outcome measures and items for variance analysis. There was pre‐implementation education program for every discipline |
| Schull 1992 | Texas, USA | Acute stroke and rehabilitation | Patients were cared for in a neurology ward within a teaching hospital. There was a clinical nurse specialist as case manager. Case management was introduced as a cost‐containment tool |
| Sulch 2000 | London, UK | Stroke rehabilitation | Unclear what type of ward in which patients in either group were initially cared for (a general medical ward or acute stroke unit), but after randomisation, patients were transferred to a stroke rehabilitation unit within a teaching hospital. Care pathway was developed by a multidisciplinary group and implemented by an experienced nurse. There were special training sessions and a 3‐month pilot study |
| Wee 200 | Mississippi, USA | Acute stroke and rehabilitation | Unclear what type of ward in which patients in either group were cared for, but mostly likely a mixture of neurology and general internal medical ward within a community hospital. Organisation of care was poorly described. Clinical pathway was designed by the stroke team and approved by medical care committee. No care manager was employed. |
| Widjaja 2002 | Singapore | Acute stroke and rehabilitation | Organsation of care was poorly described. Stroke pathway was designed by the multidisciplinary team. |
| Wilkinson 2000 | Brisbane, Australia | Acute stroke | Patients were managed in a stroke unit within a district general hospital. Stroke pathway project was led by a geriatrician and pathway designed by a multidisciplinary team. The project also included opening of a new acute stroke unit and acquisition of new equipment. Implementation of the pathway involved focus groups, team meetings, visits to other hospital units, audits, and educational sessions for the healthcare staff. |
We screened a total of 12,248 titles, abstracts and keywords of publications. We excluded 11,994 of these immediately and retrieved 254 full‐text publications. From these 254 publications, only 62 were reports of studies. We included three randomised controlled trials (total of 340 patients) and 12 non‐randomised studies (total of 4081 patients) that compared care pathway care with standard care. One of the non‐randomised studies also compared care pathway care in an acute stroke unit with standard care in general medical wards (total of 285 patients). All included studies were published in the English language. Forty‐five studies were excluded for the following reasons:
Excluded randomised studies
Community‐based intervention (2 studies) (Allen 2002; Goldberg 1997)
The intervention tested did not fulfil the criteria for a care pathway (1 study) (Pearson 1988)
Claims of some beneficial effects of a new care pathway but there was inadequate information on the intervention and the methodology of the study (1 study) (Moloney 1999)
Excluded non‐randomised studies
The intervention tested in this study did not fulfil the definition criteria for a care pathway (17 studies)
The participants recruited in this study did not suffer a condition that fulfilled the definition for a stroke (2 studies)
Claims of some beneficial effects of a new care pathway but there was inadequate information on the intervention and the methodology of the study (8 studies)
The data for stroke and non‐stroke patients were combined and could not be separated (1 study)
All data were collected after the introduction of the intervention (6 studies)
Community‐based (or mixed hospital‐ and community‐based) intervention (2 studies)
Other reasons (5 studies)
Included randomised studies
We included three randomised controlled trials. Two studies (Falconer 1993; Sulch 2000) included patients with all types of stroke, whereas one study (Schull 1992) only included patients with ischaemic stroke. The intervention tested was generally well described and were known by different names: critical path method (Falconer 1993), case managed care with anticipatory comprehensive planning (Schull 1992) and integrated (managed) care pathway (Sulch 2000). The common elements of care shared by all these interventions included the involvement of multiple disciplines, setting of pre‐defined patient goals and therapeutic activities, and regular multidisciplinary team meetings. In one study, the care pathway was computer‐generated (Falconer 1993); in another study, it was a paper document that became part of the patient's case notes (Sulch 2000); in the third study, it was called an "anticipatory comprehensive planning" but it was unclear whether it involved a paper document (Schull 1992). The care pathways were implemented for stroke rehabilitation in two studies (Falconer 1993; Sulch 2000), and for acute stroke and rehabilitation in one study (Schull 1992). The patient care given to the control groups was poorly defined in every study, but in two studies, it was simply described as multidisciplinary care with regular team meetings to discuss patients' progress (Falconer 1993; Sulch 2000).
Included non‐randomised studies
We included 12 non‐randomised studies ‐ one retrospective comparative study (Baker 1998) and 11 before‐and‐after studies (Bowen 1994; Crawley 1996; Hamrin 1990; Kwan 2004; Mosimaneotsile 2000; Odderson 1993; Pasquarello 1990; Ross 1997; Wee 2000; Widjaja 2002; Wilkinson 2000), four of which had a concurrent control group (Bowen 1994; Kwan 2004; Odderson 1993; Ross 1997). None were truly controlled before‐and‐after studies (i.e. had control groups before and after the introduction of the care pathway). Four studies (Bowen 1994; Hamrin 1990; Kwan 2004; Widjaja 2002) included all types of stroke and transient ischaemic attacks, whereas six studies (Baker 1998; Crawley 1996; Odderson 1993; Pasquarello 1990; Ross 1997; Wee 2000) included only ischaemic strokes. The stroke type was not specified in two studies (Mosimaneotsile 2000; Wilkinson 2000). The interventions tested were known by different names: case managed care (Baker 1998; Crawley 1996); clinical or critical pathway (Odderson 1993; Ross 1997; Wee 2000; Widjaja 2002; Wilkinson 2000); integrated care pathway (Kwan 2004); Care Map™ (Mosimaneotsile 2000); multidisciplinary stroke protocol or programme (Bowen 1994; Pasquarello 1990); and systematic care planning with care plans (Hamrin 1990). The interventions were generally less well described than in randomised studies and the common elements of care included the involvement of multiple disciplines and care planning with specific care protocol. The care pathways involved paper documents in eight studies (Baker 1998; Bowen 1994; Hamrin 1990; Kwan 2004; Mosimaneotsile 2000; Odderson 1993; Ross 1997; Wee 2000), whereas it was unclear in four studies (Crawley 1996; Pasquarello 1990; Widjaja 2002; Wilkinson 2000). The care pathways were implemented for acute stroke in seven studies (Baker 1998; Bowen 1994; Kwan 2004; Odderson 1993; Pasquarello 1990; Ross 1997; Wilkinson 2000), stroke rehabilitation in one study (Mosimaneotsile 2000), and for acute stroke and rehabilitation in four studies (Crawley 1996; Hamrin 1990; Wee 2000; Widjaja 2002). Three of the acute stroke care pathways began with treatment at the emergency department (e.g. thrombolytic therapy) (Baker 1998; Bowen 1994; Ross 1997). The patient care provided by the control groups was generally poorly described.
In both the randomised and non‐randomised studies, the outcome measures and length of follow‐up were very variable between studies. It was therefore difficult to perform quantitative analyses for some outcome measures. For example, one study reported the median Barthel index as a measure of disability (Sulch 2000), whereas two other studies reported the mean Functional Independence Measure (Falconer 1993; Mosimaneotsile 2000). For continuous variables, some studies reported the means without standard deviations, whereas some reported the medians with interquartile ranges. Since means are influenced by extremes of values, our summary analyses could only use the means if the standard deviations were also reported. Where cost was reported, some studies have used the actual mean hospitalisation cost in US dollars (e.g. Crawley 1996; Schull 1992), whereas some have calculated the relative reduction in percentage (e.g. Odderson 1993). Many studies simply reported "no difference" for some outcome measures but no data were presented.
Risk of bias in included studies
Randomised studies
The reporting of methodology was adequate only in one study (Sulch 2000). In this study, randomisation was performed by computer in blocks of 10but the method of concealing treatment allocation was not stated. No randomised patient was reported to have crossed over to the other group. The medical care that the patients received before randomisation was not defined, nor was the location of acute care (e.g. acute stroke unit or general medical ward). The study stated that the treatment and control groups were managed by two "separate teams of nurses", but it did not state whether the doctors, therapists, or social worker(s) were shared between the two groups (which could be a source of contamination). Follow‐up assessments were undertaken by two observers who were "not directly involved in patient care", but it was unclear whether they were blinded to the treatment allocation, and what level of training and expertise each person had. It also did not report whether the patients or the statistician(s) were blinded to the treatment allocation. This was the only study that reported a power calculation (based on reducing the mean length of stay from 53 to 46 days). Follow‐up to six months was carried out in 136/136 (100%) patients. Reliability for the primary outcome measures was moderate to high; the kappa value for inter‐observer agreement on whether the patient was independent was 0.78 for the Barthel index and 0.86 for the Rankin scores (high).
The reporting of methodology in the other two randomised studies was poor. In one study (Falconer 1993), there was no information on the method of randomisation, concealment of allocation or blinding. Of the 128 patients randomised, seven did not complete the rehabilitation programme because of "sickness"; those patients were excluded from analysis. Patients were randomised within 120 days of stroke onset and some patients might already have had some rehabilitation prior to randomisation. The group sizes were unequal because of "random irregularities in the admission process". It did not state whether the doctors, nurses, therapists, or social workers were shared between the two groups. Again, the medical care that the patients received before randomisation was not defined, nor was the location of acute care. The proportion of patients who were followed up to one year was not reported. There was also no indication of the reliability of the primary outcome measures.
In the other randomised study (Schull 1992), sixty patients were "selected randomly" from among ischaemic stroke patients admitted to a neurology service over a six‐month period. They were then "divided randomly" into treatment and control groups with 30 patients in each. However, there was no information on the method of randomisation, allocation or blinding. Some initial selection bias could have been present. It did not state whether the doctors, nurses, therapists, or social workers were shared between the two groups. The care pathway was for both acute stroke and rehabilitation but there was no description of the location in which patient care was provided during each phase of the admission. There were no follow‐up assessments after discharge.
For the randomised studies, we report one comparison: care pathway care versus standard care. In all of these studies, the unit of analysis was the number of patients and not stroke events (assuming any readmission for recurrent stroke would be counted as a separate unit of analysis). None of the trials reported major differences in observed baseline characteristics between the two groups of patients. In two of the studies only limited data on baseline characteristics were reported (e.g. no data on subtype of stroke, pre‐stroke level of function) (Falconer 1993; Schull 1992). None of the authors of the randomised studies have been contacted.
Non‐randomised studies
In the non‐randomised studies, the reporting of methodology was generally poor. In the only comparative study (Baker 1998), 273 patients were retrospectively identified to have non‐haemorrhagic stroke ("diagnosis‐related group 14") and their records were retrieved. Of these records, 30 were randomly selected for review; 15 of these patients were by chance managed by care pathway and eight by standard medical care. Baseline characteristics only included age and gender but no other variables such as stroke severity or subtypes. The other 11 non‐randomised studies were before‐and‐after studies, four of which included a concurrent parallel control group but no historical parallel control group (Bowen 1994; Kwan 2004; Odderson 1993; Ross 1997). We found no quasi‐randomised studies or interrupted time series. For the 11 before‐and‐after studies, data collection was purely prospective in one study (Hamrin 1990), mixed prospective and retrospective in two studies (Crawley 1996; Kwan 2004), and purely retrospective in eight studies (Bowen 1994; Mosimaneotsile 2000; Odderson 1993; Pasquarello 1990; Ross 1997; Wee 2000; Widjaja 2002; Wilkinson 2000). In this review, the data for all the non‐randomised studies were analysed as a single group.
Only one non‐randomised study stated that the patients were consecutively recruited and adequately described the location and organisation of care for all the treatment groups (Kwan 2004). For the remaining studies, the patient care given to the care pathway group was generally adequately described, but the care given to the control group was poorly defined. Baseline characteristics of the patients in the treatment and control groups were reported to be balanced in three studies (Crawley 1996; Ross 1997; Widjaja 2002), but in six of the remaining studies, the groups were different in certain characteristics, such as race, gender, and strokes subtypes (Baker 1998; Bowen 1994; Hamrin 1990; Kwan 2004; Mosimaneotsile 2000; Pasquarello 1990). Baseline characteristics were not reported in three studies (Odderson 1993; Wee 2000; Wilkinson 2000). Due to lack of information, it was unclear in all but one of the non‐randomised studies (Kwan 2004) whether the introduction of the care pathway was independent of other organisational changes over time.
Effects of interventions
Comparison: Care pathways care versus standard care
In this review, we report a wide variety of outcome measures; this was to describe as many as possible of the potential effects of care pathway care. For each outcome measure, we presented the results for randomised and non‐randomised studies separately and also as an overall result (calculated with a 'random effects' method). As the number of studies overall reporting each outcome was small, it was not possible to break the results down according to the clinical setting of the care pathway (acute stroke, rehabilitation, or both). We found significant heterogeneity in eight of the outcome measures (also see Discussion).
Readers of this review should be extremely cautious when interpreting these results because of the presence of variations between the studies, the non‐randomised nature of most of the studies, the large number of outcomes reported, and the relatively small numbers of studies and patients available for each outcome measure. Results reaching statistical significance (P < 0.05) are marked with *.
Outcomes (and their corresponding graphs 01 to 33)
01. Death by the end of follow‐up
Three studies (one randomised and two non‐randomised, total of 783 patients) reported this outcome. The randomised study showed a trend toward more deaths by the end of follow‐up in the care pathway group (OR 1.77, 95%CI 0.61 to 5.14) (Sulch 2000). The two non‐randomised studies showed a trend toward fewer deaths by the end of follow‐up in the care pathway group (OR 0.69, 95%CI 0.44 to 1.07) (Hamrin 1990; Kwan 2004). The aggregate result showed no significant difference (OR 0.88, 95%CI 0.49 to 1.57, P = 0.7). Two studies (Bowen 1994; Falconer 1993) reported "no difference" in mortality but no data were given.
02. Death in hospital
Four non‐randomised studies (Hamrin 1990; Kwan 2004; Odderson 1993; Widjaja 2002) with 1099 patients showed no significant difference (OR 0.86, 95%CI 0.59 to 1.25, P = 0.4). Two studies (Bowen 1994; Falconer 1993) reported "no difference" in mortality but no data were given.
03. Dependency at discharge*
Two studies (one randomised and one non‐randomised, total of 667 patients) reported this outcome. Dependency was assessed with the Functional Independence Measure (FIM); higher scores indicated greater independence. The randomised study showed a trend toward the care pathway group being more dependent at discharge (WMD ‐4.9, 95%CI ‐14.6 to +4.8) (Falconer 1993). The non‐randomised study also showed a similar trend (WMD ‐3.6, 95%CI ‐7.4 to +0.2) (Mosimaneotsile 2000). The aggregate result showed that patients in the care pathway group were significantly more dependent at discharge (WMD ‐3.8, 95%CI ‐7.3 to ‐0.2, P = 0.04). For both studies, it was unclear how many of the patients died in hospital, so the summary analysis was unable to exclude these patients.
04. Dead or dependent at the end of follow‐up
One randomised study (Sulch 2000) with 152 patients showed no significant difference (OR 1.36, 95%CI 0.68 to 2.72, P = 0.4). Two studies (Bowen 1994; Falconer 1993) reported "no difference" in mortality but no data were given.
05. Discharge to institutional care
Seven studies (one randomised and six non‐randomised, total of 1613 patients) reported this outcome. The randomised study showed a trend toward fewer patients discharged to institutional care in the care pathway group (OR 0.57, 95%CI 0.24 to 1.35) (Sulch 2000). The six non‐randomised studies also showed a similar trend (OR 0.82, 95%CI 0.55 to 1.23) (Baker 1998; Hamrin 1990; Kwan 2004; Mosimaneotsile 2000; Odderson 1993; Pasquarello 1990). The aggregate result showed a trend toward fewer patients discharged to institutional care in the care pathway group (OR 0.79, 95%CI 0.55 to 1.13, P = 0.2). Two studies (Bowen 1994; Falconer 1993) reported "no difference" in discharge destinations but no data were given.
06. Death in hospital or discharge to institutional care
Three non‐randomised studies (Hamrin 1990; Kwan 2004; Odderson 1993) with 842 patients showed a trend toward fewer deaths in hospital or discharges to institutional care in the care pathway group (OR 0.8, 95%CI 0.61 to 1.05, P = 0.11). Two studies (Bowen 1994; Falconer 1993) reported "no difference" in death or discharge destinations but no data were given.
07. Discharge to home
Seven studies (one randomised and six non‐randomised, total of 1613 patients) reported this outcome. The randomised study showed no significant difference (OR 1.14, 95%CI 0.56 to 2.32) (Sulch 2000). The six non‐randomised studies also showed no significant difference (OR 1.2, 95%CI 0.84 to 1.7) (Baker 1998; Hamrin 1990; Kwan 2004; Mosimaneotsile 2000; Odderson 1993; Pasquarello 1990). The aggregate result showed no significant difference (OR 1.18, 95%CI 0.88 to 1.59, P = 0.3). Two studies (Bowen 1994; Falconer 1993) reported "no difference" in discharge destinations but no data were given.
08. Complication: Pneumonia
Four non‐randomised studies (Crawley 1996; Kwan 2004; Pasquarello 1990; Widjaja 2002) with 797 patients showed no significant difference (OR 0.89, 95%CI 0.53 to 1.5, P = 0.7). One study (Bowen 1994) reported "no difference" in pneumonia but no data were given.
09. Complication: Urinary tract infection*
Six non‐randomised studies (Bowen 1994; Crawley 1996; Kwan 2004; Odderson 1993; Pasquarello 1990; Widjaja 2002) with 1283 patients showed that significantly fewer patients suffered urinary tract infections in the care pathway group (OR 0.51, 95%CI 0.34 to 0.79, P = 0.02).
10. Complication: Deep vein thrombosis
Two non‐randomised studies (Crawley 1996; Kwan 2004) with 490 patients showed no significant difference (OR 1.92, 95%CI 0.22 to 16.7, P = 0.6). One study (Bowen 1994) reported "no difference" in complications but no data were given.
11. Complication: Pressure sores
Two non‐randomised studies (Kwan 2004; Pasquarello 1990) with 401 patients showed no significant difference (OR 0.55, 95%CI 0.09 to 3.45, P = 0.5).
12. Complication: Dehydration
One non‐randomised study (Pasquarello 1990) with 50 patients showed a trend toward fewer patients suffering from dehydration in care pathway group (OR 0.06, 95%CI <0.1 to 1.11, P = 0.06).
13. Complication: Fluid and electrolyte imbalance
One non‐randomised study (Pasquarello 1990) with 50 patients showed no significant difference (OR 0.48, 95%CI 0.04 to 5.65, P = 0.6).
14. Complication: Fever (all causes)
One non‐randomised study (Kwan 2004) with 351 patients showed no significant difference (OR 0.81, 95%CI 0.50 to 1.32, P = 0.4).
15. Complication: Seizures
Two non‐randomised studies (Kwan 2004; Pasquarello 1990) with 401 patients showed no significant difference (OR 0.85, 95%CI 0.3 to 2.42, P = 0.8).
16. Complication: Falls or fractures
Two non‐randomised studies (Kwan 2004; Pasquarello 1990) with 401 patients showed no significant difference (OR 0.88, 95%CI 0.2 to 3.87, P = 0.9).
17. Complication: Constipation
One non‐randomised study (Kwan 2004) with 351 patients showed no significant difference (OR 0.72, 95%CI 0.39 to 1.31, P = 0.3).
18. Complication: Myocardial infarction
One non‐randomised study (Crawley 1996) with 139 patients showed no significant difference (OR 1.56, 95%CI 0.06 to 39.39, P = 0.8).
19. Investigation: First or second computed tomography (CT) brain scan*
Four non‐randomised studies (Hamrin 1990; Kwan 2004; Ross 1997; Wee 2000) with 1315 patients showed that significantly more patients received a first or second CT brain scan in the care pathway group (OR 2.42, 95%CI 1.12 to 5.25, P = 0.02).
20. Investigation: CT brain scan performed within 24 hours*
Two non‐randomised studies (Kwan 2004; Wee 2000) with 491 patients showed that significantly more patients received an early CT brain scan within 24 hours in the care pathway group (OR 2.12, 95%CI 1.33 to 3.38, P = 0.002).
21. Investigation: Carotid duplex study
Three non‐randomised studies (Bowen 1994; Kwan 2004; Wee 2000) with 766 patients showed a trend toward more patients receiving a carotid duplex study in care pathway group (OR 1.79, 95%CI 0.76 to 4.2, P = 0.18).
22. Investigation: Echocardiography
Two non‐randomised studies (Kwan 2004; Wee 2000) with 491 patients showed a trend toward more patients receiving an echocardiogram in care pathway group (OR 2.08, 95%CI 0.94 to 4.58, P = 0.07).
23. Investigation: Electrocardiography
Three non‐randomised studies (Kwan 2004; Ross 1997; Wee 2000) with 1035 patients showed no significant difference (OR 0.92, 95%CI 0.45 to 1.89, P = 0.8). One study (Bowen 1994) reported "no difference" in echocardiography but no data were given.
24. Investigation: Chest x‐ray
Two non‐randomised studies (Kwan 2004; Wee 2000) with 491 patients showed a trend toward fewer patients receiving a chest x‐ray in care pathway group (OR 0.55, 95%CI 0.23 to 1.31, P = 0.18).
25. Investigation: Cerebral angiography (catheter and MR angiography)
Two non‐randomised studies (Kwan 2004; Wee 2000) with 491 patients showed no significant difference (OR 3.55, 95%CI 0.24 to 51.91, P = 0.4).
26. Medication: Use of heparin (subcutaneous or intravenous) in the acute period
Two non‐randomised studies (Kwan 2004; Wee 2000) with 491 patients showed no significant difference (OR 1.23, 95%CI 0.25 to 6.01, P = 0.8).
27. Medication: Use of new antihypertensive therapy in the acute period
Two non‐randomised studies (Kwan 2004; Wee 2000) with 491 patients showed a trend toward fewer patients being inappropriately started on new antihypertensive therapy in the acute period in care pathway group (OR 0.15, 95%CI <0.01 to 4.65, P = 0.3). Clinical guidelines state that new antihypertensive therapy should not be commenced in the acute period after stroke (RCP 2001).
28. Medication: Use of intravenous fluids
One non‐randomised study (Kwan 2004) with 351 patients showed no significant difference (OR 0.96, 95%CI 0.62 to 1.47, P = 0.8).
29. Procedure: Urinary catheterisation for patients with incontinence
One non‐randomised study (Kwan 2004) with 351 patients showed no significant difference (OR 0.78, 95%CI 0.41 to 1.48, P = 0.4).
30. Procedure: Use of thrombo‐embolism deterrent stockings
Two non‐randomised studies (Kwan 2004; Wee 2000) with 491 patients showed no significant difference (OR 1.46, 95%CI 0.31 to 6.94, P = 0.6).
31. Patient and carer satisfaction*
One randomised study (Falconer 1993) with 121 patients reported this outcome. Patient satisfaction was measured with an ordinal scale ranging from 1(least satisfied) to 10(most satisfied). Patients answered the questions wherever possible unless the patient experienced significant communication problems (then relatives or carers would answer). The randomised study showed that patients were significantly less satisfied with their hospital care in the care pathway group (WMD ‐1.1, 95%CI ‐1.91 to ‐0.29, P = 0.008).
32. Duration of hospital stay
Six studies (two randomised and four non‐randomised, total of 1915 patients) reported this outcome. The two randomised studies showed a trend toward longer mean length of hospital stay in care pathway group (WMD 3.99, 95%CI ‐0.29 to +8.27 days) (Falconer 1993; Sulch 2000). The four non‐randomised studies showed that mean length of hospital stay was significantly shorter in the care pathway group (WMD ‐1.89, 95%CI ‐2.95 to ‐0.82 days) (Kwan 2004; Mosimaneotsile 2000; Odderson 1993; Ross 1997). The aggregate result showed a non‐significant trend toward shorter mean length of hospital stay in the care pathway group (WMD ‐1.39, 95%CI ‐2.8 to +0.02 days, P = 0.14). Studies that did not report standard deviations could not be included for summary analysis. These studies include: (1) one randomised study that found shorter mean length of hospital stay in care pathway group (11.4 versus 14.3 days) (Schull 1992); (2) five non‐randomised studies that found shorter mean length of hospital stay in care pathway group (Bowen 1994; Crawley 1996; Hamrin 1990; Widjaja 2002; Wilkinson 2000); and (3) three non‐randomised studies that found longer mean length of hospital stay in the care pathway group (Baker 1998; Pasquarello 1990; Wee 2000). There was substantial heterogeneity overall (I2 = 58.9%, P = 0.03), so no firm conclusion about the effect of care pathway care on length of stay can be drawn.
33. Readmission or emergency department attendance*
Two studies (one randomised and one non‐randomised, total of 110 patients) reported this outcome. The randomised study showed significantly fewer readmissions or emergency department attendances in the care pathway group (OR 0.15, 95%CI 0.04 to 0.59) (Schull 1992). The non‐randomised study also showed significantly fewer readmissions or emergency department attendances in the care pathway group (OR 0.03, 95%CI < 0.1 to 0.63) (Pasquarello 1990). The aggregate result showed significantly fewer readmissions or emergency department attendances in the care pathway group (OR 0.11, 95%CI 0.03 to 0.39, P = 0.0006).
Other important outcomes (not displayed graphically)
Therapy input
Two studies (one randomised and one non‐randomised, total of 427 patients) reported this outcome. The randomised study showed no significant difference in the cumulative duration of physiotherapy or occupational therapy at various follow‐up time points (Sulch 2000). The non‐randomised study found "no difference" in therapy input but no data were given (Bowen 1994).
Quality of life*
One randomised study (Sulch 2000) with 152 patients reported this outcome, measured with the Euroqol score as a measure of quality of life. This study found no significant difference in the Euroqol score at one or three months. However, at six months, the median Euroqol score was found to be significantly lower in the care pathway group (care pathway group = 63 versus control group = 72, P < 0.005), which suggests a lower quality of life in the care pathway group. The study also found that controls performed better in the Euroqol domain for social functioning (P = 0.014), but patients in the care pathway group performed better in the Euroqol domain for self‐care (P = 0.041).
Hospitalisation cost
Five studies (two randomised and three non‐randomised) reported this outcome. One randomised study found no significant difference in hospitalisation cost between care pathway and control groups (Falconer 1993) and another randomised study found a lower mean hospitalisation cost in the care pathway group (Schull 1992). Two non‐randomised studies found a fall in the mean hospitalisation cost (Bowen 1994; Crawley 1996) and one non‐randomised study found a 14.6% fall (but no actual cost data given) in the mean hospitalisation cost (Odderson 1993). No study reported the standard deviation or any other measure of variance.
Quality of documentation
Two studies (one randomised and one non‐randomised) reported this outcome. Both found that quality of documentation was significantly better (i.e. more likely to be recorded) in the care pathway group. The randomised study found that patients in care pathway group had significantly more comprehensive documentation of: (1) certain aspects of neurological and nutritional assessments; and (2) notification to the general practitioner regarding the patient's discharge from hospital (Sulch 2000). The non‐randomised study found that introduction of the care pathway significantly improved the documentation of: (1) certain aspects of neurological assessment; and (2) anatomical site of the brain lesion and its pathological type (all items were defined according to the Royal College of Physicians Sentinel Audit Package) (Kwan 2004).
Discussion
This review includes both randomised and non‐randomised studies. Readers must be extremely cautious when interpreting the results because of the potential for bias and confounding, and because there is significant statistical heterogeneity between the studies (Chalmers 1983; Deeks 2003; Egger 1998; Sacks 1982).
The most obvious bias is selection bias, i.e. stroke patients may have been selected to be managed with a care pathway and may have differed from those who were managed with standard medical care. In one study, it was stated that patients were selected for care pathway care using strict screening criteria (Baker 1998) and we suspect that this was also the common practice in other studies. Consequently, the clinicians may have selected the stroke patients with better (or worse) prognosis and biased their findings.
There are other potentially important biases in non‐randomised studies. Most of the studies were retrospective and only one study (Kwan 2004) included consecutive cases. It is possible that some cases were missed or excluded, which may have influenced outcome. The investigators who assessed the outcomes were not reported to be blinded to the treatment option and this may have biased their assessment of non‐fatal outcomes. Moreover, publication bias may have influenced the results of the non‐randomised studies, such that those showing no benefit or worse outcome with care pathway care may have been less likely to be published (Sutton 2000). Finally, authors may choose to write "no difference" rather than report the actual data, or to omit the negative results altogether from their publication. This data‐dependent reporting bias may have influenced the outcome.
Another important factor that complicates these analyses is imbalance of prognostic factors and case mix at baseline. This is a problem in small randomised trials and a much bigger problem in non‐randomised studies of all sizes. Adjustment for measured baseline covariates known to influence prognosis may reduce the effect of such imbalance, but it cannot deal with unmeasured variables. In a randomised trial, such variables are balanced by the process of randomisation, but this is not possible in non‐randomised studies. Analyses adjusted for baseline prognostic factors were reported in some studies (Kwan 2004), but as we did not have individual patient data sets for each study, we were unable to adjust any of our analyses.
Other factors that add to the difficulty in interpreting the results of this review include differences in patient care between comparison groups (on top of the introduction of the care pathway), variations in the definition and components of the intervention (see below), and the small number of studies included in the data analysis. Since the reporting of methodology in many studies was poor, there may be other confounding factors and sources of contamination that have not been identified. Another factor that limited the reliability of the quantitative meta‐analyses was the presence of statistical heterogeneity in a large number of the analyses (i.e. dead or dependent by the end of follow‐up, use of CT scanning, carotid duplex scanning, cerebral angiography, heparin, antihypertensives (less than five days), TED stockings, and duration of hospital stay). We have presented the numerical analyses in order to make the data available to readers, but the overall estimates of effect in the presence of such heterogeneity are very difficult to interpret.
This review has highlighted the variable definition of a care pathway. No two included studies seemed to have used the term 'care pathway' to describe the same type of intervention. Their care pathways appeared to have differed in terms of their components, target patient groups, location of use, and methods of design and implementation. We have attempted to contact several trialists (Abissi 1995; Moloney 1999) to clarify the details of their interventions, study methodology and results. However, none of them provided the required information and they have therefore been excluded from this review (update).
Like stroke unit care, it may be extremely difficult to know with any degree of certainty which components may account for which effect. By examining the characteristics of the care pathways described in the included studies, we were at least able to extract their shared components, which were basically those outlined in our definition of a 'care pathway' used for this review (see 'Types of interventions'). However, the relationship between the components of the care pathway and the effects observed was not the subject of this review.
With the above intention in mind, we found no evidence that care pathway care provided additional benefit over standard care in terms of major clinical outcomes (death or discharge destination). In fact, there was some evidence from one randomised (Falconer 1993) and one non‐randomised study (Mosimaneotsile 2000) that patients in the care pathway group might have a significantly lower level of independence as measured by Functional Independence Measure. Furthermore, evidence from two randomised trials showed that patient satisfaction and quality of life might be lower in patients managed using a care pathway (Falconer 1993; Sulch 2000). The reasons for these observed effects are unclear, but if the aim of the care pathways in these studies was to shorten the duration of hospital stay, then there may be pressure for the staff to discharge the patients as quickly as possible, but the patients or carers might not have been ready for discharge. These outcomes should be assessed in future studies.
Data, chiefly from non‐randomised studies, provided weak evidence that care pathway care might be associated with better process of care, hence leading to fewer complications (urinary tract infections, readmissions or emergency department attendances) and more thorough investigations (more CT brain scans). However, no study reported the proportion of therapeutic activities that achieved pre‐defined standards based on the best evidence or guidelines. It is probable that the care pathways were designed and implemented with different objectives; some might have promoted the routine use of certain interventions (e.g. chest x‐rays for all patients), whilst others might have tried to limit them to selected groups of patients (e.g. chest x‐rays only if clinical examination reveals abnormal physical signs). This type of uncertainty and heterogeneity further complicates the interpretation of the results. The relationship between process of care and outcome after stroke is complex (McNaughton 2003), and it is possible that certain aspects of stroke care within the care pathways examined in this review (e.g. use of urinary catheters and intravenous fluids) might have had some influence on the outcomes reported.
The economic impact of using care pathways has been evaluated by several studies, but no firm conclusion can be drawn in this review. The chief determinant of cost is length of hospital stay. The analyses of length of stay are difficult to interpret because two randomised studies suggested care pathway care increased the length of stay, whereas four non‐randomised studies showed a reduction, i.e. there was significant heterogeneity (P < 0.05). These apparent effects could (at least in part) be accounted for by differences in case mix between treatment and control groups rather than the effect of care pathway per se. Although these data do not provide a reliable summary estimate on the length of hospital stay, they at least provide a plausible range for the potential effects of care pathway care. In this review, four studies (Bowen 1994; Crawley 1996; Odderson 1993; Schull 1992) reported a reduction in mean hospital cost, and two studies found no difference in cost (Falconer 1993; Wee 2000). Only one study reported the items of costs (i.e. what items were included in the final sum) and their individual values (Falconer 1993). Without knowing the cost of individual items, comparison between studies is meaningless. Furthermore, using care pathways can be associated with many indirect and opportunity costs such as the time and effort invested in designing the pathway, time and resources in promoting its use and educating the staff from different disciplines, printing costs of the paper documents and wall posters, as well as time and effort in maintaining staff enthusiasm and continuous quality improvement (e.g. variance analysis) after its implementation. All these costs are extremely difficult to estimate and could substantially increase the total cost of using care pathways. More detailed assessment of the economic impact of using care pathways in future research would be very helpful.
Authors' conclusions
Implications for practice.
There is insufficient evidence currently available to support routine implementation of care pathways for the hospital management of acute stroke or stroke rehabilitation.
Implications for research.
Further research is necessary before widespread implementation of stroke care pathways is recommended. In particular, randomised and well‐conducted non‐randomised studies should be undertaken. The present review has included non‐randomised studies which may only represent weak evidence, but they at least suggest which variables might be tested in future randomised trials (e.g. quality of life, patient and carer satisfaction, cost of usage). Qualitative research may also provide more information on the best method of design, implementation and evaluation of care pathways.
What's new
| Date | Event | Description |
|---|---|---|
| 25 August 2008 | Amended | Converted to new review format. |
History
Protocol first published: Issue 4, 2001 Review first published: Issue 3, 2002
| Date | Event | Description |
|---|---|---|
| 15 May 2004 | New search has been performed | In this updated review (2004), we have included five additional non‐randomised studies and much new data on many of the outcome measures. |
Acknowledgements
We would like to thank Brenda Thomas for her assistance in designing the search strategy, and Hazel Fraser for her help in searching the Cochrane Stroke Group Specialised Trials Register. We also thank the Cochrane Effective Practice and Organisation of Care (EPOC) Group for their editorial advice, especially on the methodology of this review and data analysis. We are also grateful to Peter Langhorne and Livia Candelise for their editorial comments.
Appendices
Appendix 1. MEDLINE search strategy
The search strategy for MEDLINE (Ovid) is described below. This strategy was adapted to suit the other electronic databases.
1 exp cerebrovascular disorders/ 2 (stroke$ or poststroke$ or cva$).tw. 3 (cerebrovascular$ or cerebral vascular).tw. 4 (cerebral or cerebellar or brainstem or vertebrobasilar).tw. 5 (infarct$ or isch?emi$ or thrombo$ or apoplexy or emboli$).tw. 6 4 and 5 7 (cerebral or intracerebral or intracranial or parenchymal).tw. 8 (brain or intraventricular or brainstem or cerebellar).tw. 9 (infratentorial or supratentorial or subarachnoid).tw. 10 7 or 8 or 9 11 (haemorrhage or hemorrhage or haematoma or hematoma).tw. 12 (bleeding or aneurysm).tw. 13 11 or 12 14 10 and 13 15 trans$ isch?emic attack$.tw. 16 brain attack.tw. 17 1 or 2 or 3 or 6 or 14 or 15 or 16 18 critical pathway/ 19 patient care planning/ 20 case management/ or disease management/ 21 patient care team/ or exp patient care management/ 22 clinical protocols/ 23 program development/ 24 exp Delivery of health care, integrated/ 25 Managed care programs/ 26 ((care or clinical) adj10 map).tw. 27 stroke program$.tw. 28 ((clinical or treatment or care) adj10 (protocol or planning)).tw. 29 managed care.tw. 30 ((multidisciplinary or inter?disciplinary or integrated) adj10 care).tw. 31 (path or paths or pathway$ or map or maps or caremap$).tw. 32 randomized controlled trial.pt. 33 randomized controlled trials/ 34 controlled clinical trial.pt. 35 controlled clinical trials/ 36 random allocation/ 37 double‐blind method/ 38 single‐blind method/ 39 clinical trial.pt. 40 exp clinical trials/ 41 (clin$ adj25 trial$).tw. 42 ((singl$ or doubl$ or tripl$ or trebl$) adj25 (blind$ or mask$)).tw. 43 random$.tw. 44 research design/ 45 clinical trial phase ii.pt. 46 clinical trial phase iii.pt. 47 clinical trial phase iv.pt. 48 multicenter study.pt. 49 intervention studies/ 50 control$.tw. 51 "comparative study"/ 52 exp evaluation studies/ 53 Follow‐up studies/ 54 Prospective studies/ 55 prospective.tw. 56 (quasi?experimental or quasi?random$).tw. 57 matched pair analysis/ 58 meta‐analysis.pt. 59 meta‐analysis/ 60 (meta?analysis or systematic review or overview).tw. 61 32 or 33 or 34 or 35 or 36 or 37 or 38 or 39 or 40 or 41 or 42 or 43 or 44 or 45 or 46 or 47 or 48 or 49 or 50 or 51 or 52 or 53 or 54 or 55 or 56 or 57 or 58 or 59 or 60 62 exp epidemiologic studies/ 63 program evaluation/ 64 efficiency, organizational/ 65 time series.tw. 66 ((case‐control or observational) adj10 (stud$ or evaluat$)).tw. 67 exp Quality of Health Care/ 68 exp patient care/ 69 exp Health Care Evaluation Mechanisms/ 70 quality‐adjusted life years/ 71 benchmarking/ 72 or/62‐71 73 or/18‐31 74 17 and 73 75 74 and 61 76 74 and 72 77 76 not 75 78 74 not (75 or 76)
Data and analyses
Comparison 1. Care pathway care versus standard care.
| Outcome or subgroup title | No. of studies | No. of participants | Statistical method | Effect size |
|---|---|---|---|---|
| 1 Death by the end of follow‐up | 3 | 783 | Odds Ratio (M‐H, Random, 95% CI) | 0.88 [0.49, 1.57] |
| 1.1 Randomised studies | 1 | 152 | Odds Ratio (M‐H, Random, 95% CI) | 1.77 [0.61, 5.14] |
| 1.2 Non‐randomised studies | 2 | 631 | Odds Ratio (M‐H, Random, 95% CI) | 0.69 [0.44, 1.07] |
| 2 Death in hospital | 4 | 1099 | Odds Ratio (M‐H, Random, 95% CI) | 0.86 [0.59, 1.25] |
| 2.1 Randomised studies (no data) | 0 | 0 | Odds Ratio (M‐H, Random, 95% CI) | 0.0 [0.0, 0.0] |
| 2.2 Non‐randomised studies | 4 | 1099 | Odds Ratio (M‐H, Random, 95% CI) | 0.86 [0.59, 1.25] |
| 3 Dependency at discharge (mean Functional Indepedence Measure) | 2 | 667 | Mean Difference (IV, Random, 95% CI) | ‐3.77 [‐7.31, ‐0.23] |
| 3.1 Randomised studies | 1 | 121 | Mean Difference (IV, Random, 95% CI) | ‐4.90 [‐14.58, 4.78] |
| 3.2 Non‐randomised studies | 1 | 546 | Mean Difference (IV, Random, 95% CI) | ‐3.60 [‐7.40, 0.20] |
| 4 Dead or dependent (modified Rankin Score >2) by the end of follow‐up | 1 | 152 | Odds Ratio (M‐H, Random, 95% CI) | 1.36 [0.68, 2.72] |
| 4.1 Randomised studies | 1 | 152 | Odds Ratio (M‐H, Random, 95% CI) | 1.36 [0.68, 2.72] |
| 4.2 Non‐randomised studies (no data) | 0 | 0 | Odds Ratio (M‐H, Random, 95% CI) | 0.0 [0.0, 0.0] |
| 5 Discharged to Institutional care | 7 | 1613 | Odds Ratio (M‐H, Random, 95% CI) | 0.79 [0.55, 1.13] |
| 5.1 Randomised studies | 1 | 152 | Odds Ratio (M‐H, Random, 95% CI) | 0.57 [0.24, 1.35] |
| 5.2 Non‐randomised studies | 6 | 1461 | Odds Ratio (M‐H, Random, 95% CI) | 0.82 [0.55, 1.23] |
| 6 Death in hospital or discharged to institutional care | 3 | 842 | Odds Ratio (M‐H, Random, 95% CI) | 0.80 [0.61, 1.05] |
| 6.1 Randomised studies (no data) | 0 | 0 | Odds Ratio (M‐H, Random, 95% CI) | 0.0 [0.0, 0.0] |
| 6.2 Non‐randomised studies | 3 | 842 | Odds Ratio (M‐H, Random, 95% CI) | 0.80 [0.61, 1.05] |
| 7 Discharged to home | 7 | 1613 | Odds Ratio (M‐H, Random, 95% CI) | 1.18 [0.88, 1.59] |
| 7.1 Randomised studies | 1 | 152 | Odds Ratio (M‐H, Random, 95% CI) | 1.14 [0.56, 2.32] |
| 7.2 Non‐randomised studies | 6 | 1461 | Odds Ratio (M‐H, Random, 95% CI) | 1.20 [0.84, 1.70] |
| 8 Complication: Pneumonia | 4 | 797 | Odds Ratio (M‐H, Random, 95% CI) | 0.89 [0.53, 1.50] |
| 8.1 Randomised studies (no data) | 0 | 0 | Odds Ratio (M‐H, Random, 95% CI) | 0.0 [0.0, 0.0] |
| 8.2 Non‐randomised studies | 4 | 797 | Odds Ratio (M‐H, Random, 95% CI) | 0.89 [0.53, 1.50] |
| 9 Complication: Urinary tract infection | 6 | 1283 | Odds Ratio (M‐H, Random, 95% CI) | 0.51 [0.34, 0.79] |
| 9.1 Randomised studies (no data) | 0 | 0 | Odds Ratio (M‐H, Random, 95% CI) | 0.0 [0.0, 0.0] |
| 9.2 Non‐randomised studies | 6 | 1283 | Odds Ratio (M‐H, Random, 95% CI) | 0.51 [0.34, 0.79] |
| 10 Complication: Deep vein thrombosis | 2 | 490 | Odds Ratio (M‐H, Random, 95% CI) | 1.92 [0.22, 16.70] |
| 10.1 Randomised studies (no data) | 0 | 0 | Odds Ratio (M‐H, Random, 95% CI) | 0.0 [0.0, 0.0] |
| 10.2 Non‐randomised studies | 2 | 490 | Odds Ratio (M‐H, Random, 95% CI) | 1.92 [0.22, 16.70] |
| 11 Complication: Pressure sores | 2 | 401 | Odds Ratio (M‐H, Random, 95% CI) | 0.55 [0.09, 3.45] |
| 11.1 Randomised studies (no data) | 0 | 0 | Odds Ratio (M‐H, Random, 95% CI) | 0.0 [0.0, 0.0] |
| 11.2 Non‐randomised studies | 2 | 401 | Odds Ratio (M‐H, Random, 95% CI) | 0.55 [0.09, 3.45] |
| 12 Complication: Dehydration | 1 | 50 | Odds Ratio (M‐H, Random, 95% CI) | 0.06 [0.00, 1.11] |
| 12.1 Randomised studies (no data) | 0 | 0 | Odds Ratio (M‐H, Random, 95% CI) | 0.0 [0.0, 0.0] |
| 12.2 Non‐randomised studies | 1 | 50 | Odds Ratio (M‐H, Random, 95% CI) | 0.06 [0.00, 1.11] |
| 13 Complication: Fluid and electrolyte imbalance | 1 | 50 | Odds Ratio (M‐H, Random, 95% CI) | 0.48 [0.04, 5.65] |
| 13.1 Randomised studies (no data) | 0 | 0 | Odds Ratio (M‐H, Random, 95% CI) | 0.0 [0.0, 0.0] |
| 13.2 Non‐randomised studies | 1 | 50 | Odds Ratio (M‐H, Random, 95% CI) | 0.48 [0.04, 5.65] |
| 14 Complication: Fever (all causes) | 1 | 351 | Odds Ratio (M‐H, Random, 95% CI) | 0.81 [0.50, 1.32] |
| 14.1 Randomised studies (no data) | 0 | 0 | Odds Ratio (M‐H, Random, 95% CI) | 0.0 [0.0, 0.0] |
| 14.2 Non‐randomised studies | 1 | 351 | Odds Ratio (M‐H, Random, 95% CI) | 0.81 [0.50, 1.32] |
| 15 Complication: Seizures | 2 | 401 | Odds Ratio (M‐H, Random, 95% CI) | 0.85 [0.30, 2.42] |
| 15.1 Randomised studies (no data) | 0 | 0 | Odds Ratio (M‐H, Random, 95% CI) | 0.0 [0.0, 0.0] |
| 15.2 Non‐randomised studies | 2 | 401 | Odds Ratio (M‐H, Random, 95% CI) | 0.85 [0.30, 2.42] |
| 16 Complication: Falls or fractures | 2 | 401 | Odds Ratio (M‐H, Random, 95% CI) | 0.88 [0.20, 3.87] |
| 16.1 Randomised studies (no data) | 0 | 0 | Odds Ratio (M‐H, Random, 95% CI) | 0.0 [0.0, 0.0] |
| 16.2 Non‐randomised studies | 2 | 401 | Odds Ratio (M‐H, Random, 95% CI) | 0.88 [0.20, 3.87] |
| 17 Complication: Constipation | 1 | 351 | Odds Ratio (M‐H, Random, 95% CI) | 0.72 [0.39, 1.31] |
| 17.1 Randomised studies (no data) | 0 | 0 | Odds Ratio (M‐H, Random, 95% CI) | 0.0 [0.0, 0.0] |
| 17.2 Non‐randomised studies | 1 | 351 | Odds Ratio (M‐H, Random, 95% CI) | 0.72 [0.39, 1.31] |
| 18 Complication: Myocardial infarction | 1 | 139 | Odds Ratio (M‐H, Random, 95% CI) | 1.56 [0.06, 39.39] |
| 18.1 Randomised studies (no data) | 0 | 0 | Odds Ratio (M‐H, Random, 95% CI) | 0.0 [0.0, 0.0] |
| 18.2 Non‐randomised studies | 1 | 139 | Odds Ratio (M‐H, Random, 95% CI) | 1.56 [0.06, 39.39] |
| 19 Investigation: First or second computed tomography brain scan | 4 | 1315 | Odds Ratio (M‐H, Random, 95% CI) | 2.42 [1.12, 5.25] |
| 19.1 Randomised studies (no data) | 0 | 0 | Odds Ratio (M‐H, Random, 95% CI) | 0.0 [0.0, 0.0] |
| 19.2 Non‐randomised studies | 4 | 1315 | Odds Ratio (M‐H, Random, 95% CI) | 2.42 [1.12, 5.25] |
| 20 Investigation: Computed tomography brain scan within 24 hours | 2 | 491 | Odds Ratio (M‐H, Random, 95% CI) | 2.12 [1.33, 3.38] |
| 20.1 Randomised studies (no data) | 0 | 0 | Odds Ratio (M‐H, Random, 95% CI) | 0.0 [0.0, 0.0] |
| 20.2 Non‐randomised studies | 2 | 491 | Odds Ratio (M‐H, Random, 95% CI) | 2.12 [1.33, 3.38] |
| 21 Investigation: Carotid duplex study | 3 | 766 | Odds Ratio (M‐H, Random, 95% CI) | 1.79 [0.76, 4.20] |
| 21.1 Randomised studies (no data) | 0 | 0 | Odds Ratio (M‐H, Random, 95% CI) | 0.0 [0.0, 0.0] |
| 21.2 Non‐randomised studies | 3 | 766 | Odds Ratio (M‐H, Random, 95% CI) | 1.79 [0.76, 4.20] |
| 22 Investigation: Echocardiography | 2 | 491 | Odds Ratio (M‐H, Random, 95% CI) | 2.08 [0.94, 4.58] |
| 22.1 Randomised studies (no data) | 0 | 0 | Odds Ratio (M‐H, Random, 95% CI) | 0.0 [0.0, 0.0] |
| 22.2 Non‐randomised studies | 2 | 491 | Odds Ratio (M‐H, Random, 95% CI) | 2.08 [0.94, 4.58] |
| 23 Investigation: Electrocardiography | 3 | 1035 | Odds Ratio (M‐H, Random, 95% CI) | 0.92 [0.45, 1.89] |
| 23.1 Randomised studies (no data) | 0 | 0 | Odds Ratio (M‐H, Random, 95% CI) | 0.0 [0.0, 0.0] |
| 23.2 Non‐randomised studies | 3 | 1035 | Odds Ratio (M‐H, Random, 95% CI) | 0.92 [0.45, 1.89] |
| 24 Investigation: Chest x‐ray | 2 | 491 | Odds Ratio (M‐H, Random, 95% CI) | 0.55 [0.23, 1.31] |
| 24.1 Randomised studies (no data) | 0 | 0 | Odds Ratio (M‐H, Random, 95% CI) | 0.0 [0.0, 0.0] |
| 24.2 Non‐randomised studies | 2 | 491 | Odds Ratio (M‐H, Random, 95% CI) | 0.55 [0.23, 1.31] |
| 25 Investigation: Cerebral angiography (catheter or MR angiography) | 2 | 491 | Odds Ratio (M‐H, Random, 95% CI) | 3.55 [0.24, 51.91] |
| 25.1 Randomised studies (no data) | 0 | 0 | Odds Ratio (M‐H, Random, 95% CI) | 0.0 [0.0, 0.0] |
| 25.2 Non‐randomised studies | 2 | 491 | Odds Ratio (M‐H, Random, 95% CI) | 3.55 [0.24, 51.91] |
| 26 Medication: Use of heparin (subcutaneous or intravenous) in acute period | 2 | 491 | Odds Ratio (M‐H, Random, 95% CI) | 1.23 [0.25, 6.01] |
| 26.1 Randomised studies (no data) | 0 | 0 | Odds Ratio (M‐H, Random, 95% CI) | 0.0 [0.0, 0.0] |
| 26.2 Non‐randomised studies | 2 | 491 | Odds Ratio (M‐H, Random, 95% CI) | 1.23 [0.25, 6.01] |
| 27 Medication: Use of new antihypertensive therapy in the acute period | 2 | 491 | Odds Ratio (M‐H, Random, 95% CI) | 0.15 [0.00, 4.65] |
| 27.1 Randomised studies (no data) | 0 | 0 | Odds Ratio (M‐H, Random, 95% CI) | 0.0 [0.0, 0.0] |
| 27.2 Non‐randomised studies | 2 | 491 | Odds Ratio (M‐H, Random, 95% CI) | 0.15 [0.00, 4.65] |
| 28 Medication: Use of intravenous fluids | 1 | 351 | Odds Ratio (M‐H, Random, 95% CI) | 0.96 [0.62, 1.47] |
| 28.1 Randomised studies (no data) | 0 | 0 | Odds Ratio (M‐H, Random, 95% CI) | 0.0 [0.0, 0.0] |
| 28.2 Non‐randomised studies | 1 | 351 | Odds Ratio (M‐H, Random, 95% CI) | 0.96 [0.62, 1.47] |
| 29 Procedure: Urinary catheterisation for patients with incontinence | 1 | 155 | Odds Ratio (M‐H, Random, 95% CI) | 0.78 [0.41, 1.48] |
| 29.1 Randomised studies (no data) | 0 | 0 | Odds Ratio (M‐H, Random, 95% CI) | 0.0 [0.0, 0.0] |
| 29.2 Non‐randomised studies | 1 | 155 | Odds Ratio (M‐H, Random, 95% CI) | 0.78 [0.41, 1.48] |
| 30 Procedure: Use of thrombo‐embolism deterrent stockings | 2 | 491 | Odds Ratio (M‐H, Random, 95% CI) | 1.46 [0.31, 6.94] |
| 30.1 Randomised studies (no data) | 0 | 0 | Odds Ratio (M‐H, Random, 95% CI) | 0.0 [0.0, 0.0] |
| 30.2 Non‐randomised studies | 2 | 491 | Odds Ratio (M‐H, Random, 95% CI) | 1.46 [0.31, 6.94] |
| 31 Patient satisfaction | 1 | 121 | Mean Difference (IV, Random, 95% CI) | ‐1.10 [‐1.91, ‐0.29] |
| 31.1 Randomised studies | 1 | 121 | Mean Difference (IV, Random, 95% CI) | ‐1.10 [‐1.91, ‐0.29] |
| 31.2 Non‐randomised studies (no data) | 0 | 0 | Mean Difference (IV, Random, 95% CI) | 0.0 [0.0, 0.0] |
| 32 Duration of hospital stay | 6 | 1915 | Mean Difference (IV, Random, 95% CI) | ‐1.39 [‐2.80, 0.02] |
| 32.1 Randomised studies | 2 | 273 | Mean Difference (IV, Random, 95% CI) | 3.99 [‐0.29, 8.27] |
| 32.2 Non‐randomised studies | 4 | 1642 | Mean Difference (IV, Random, 95% CI) | ‐1.89 [‐2.95, ‐0.82] |
| 33 Readmission or emergency department attendance after discharge | 2 | 110 | Odds Ratio (M‐H, Random, 95% CI) | 0.11 [0.03, 0.39] |
| 33.1 Randomised studies | 1 | 60 | Odds Ratio (M‐H, Random, 95% CI) | 0.15 [0.04, 0.59] |
| 33.2 Non‐randomised studies | 1 | 50 | Odds Ratio (M‐H, Random, 95% CI) | 0.03 [0.00, 0.63] |
1.1. Analysis.
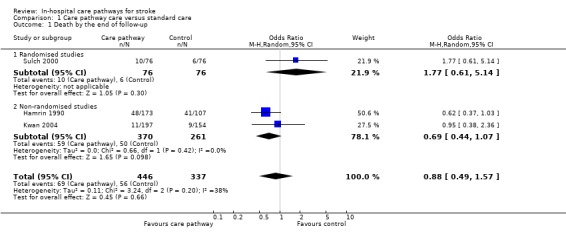
Comparison 1 Care pathway care versus standard care, Outcome 1 Death by the end of follow‐up.
1.2. Analysis.
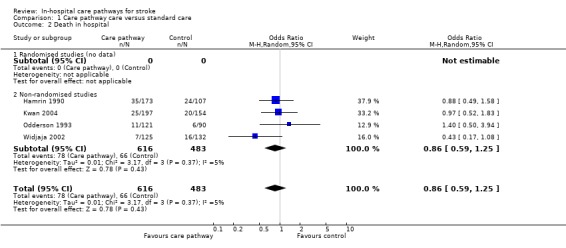
Comparison 1 Care pathway care versus standard care, Outcome 2 Death in hospital.
1.3. Analysis.
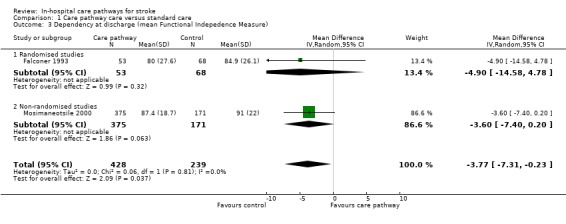
Comparison 1 Care pathway care versus standard care, Outcome 3 Dependency at discharge (mean Functional Indepedence Measure).
1.4. Analysis.
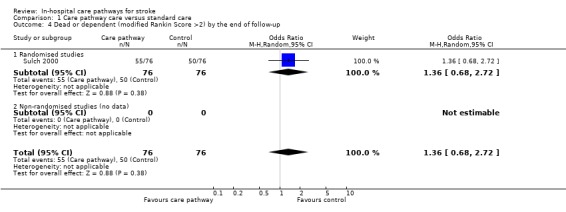
Comparison 1 Care pathway care versus standard care, Outcome 4 Dead or dependent (modified Rankin Score >2) by the end of follow‐up.
1.5. Analysis.
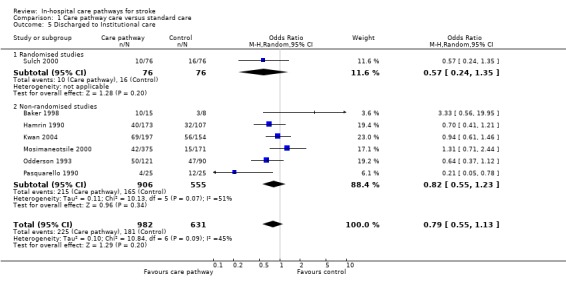
Comparison 1 Care pathway care versus standard care, Outcome 5 Discharged to Institutional care.
1.6. Analysis.
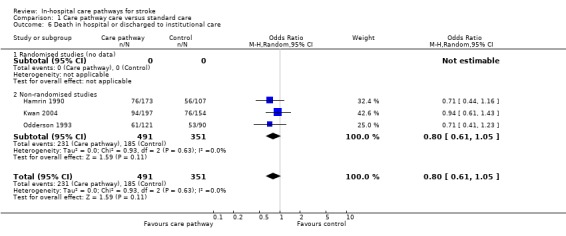
Comparison 1 Care pathway care versus standard care, Outcome 6 Death in hospital or discharged to institutional care.
1.7. Analysis.
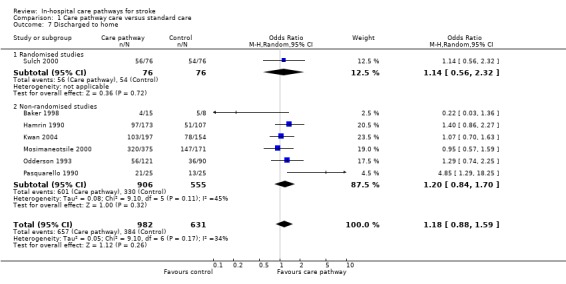
Comparison 1 Care pathway care versus standard care, Outcome 7 Discharged to home.
1.8. Analysis.
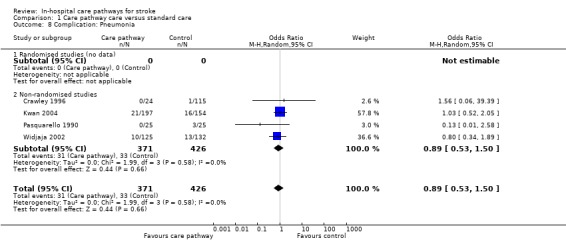
Comparison 1 Care pathway care versus standard care, Outcome 8 Complication: Pneumonia.
1.9. Analysis.
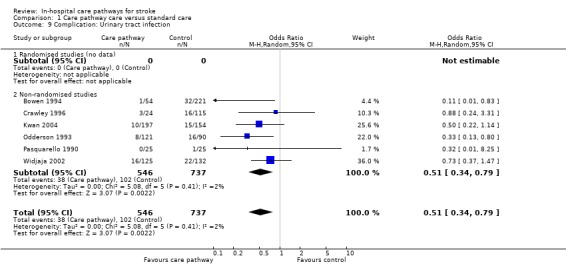
Comparison 1 Care pathway care versus standard care, Outcome 9 Complication: Urinary tract infection.
1.10. Analysis.
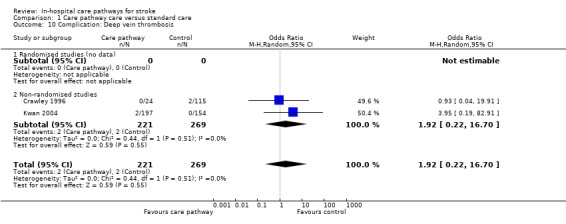
Comparison 1 Care pathway care versus standard care, Outcome 10 Complication: Deep vein thrombosis.
1.11. Analysis.
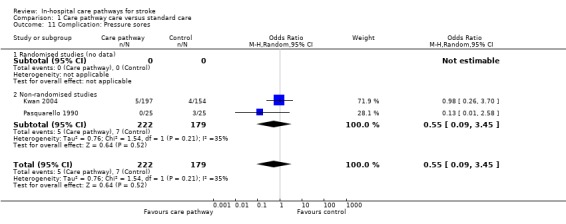
Comparison 1 Care pathway care versus standard care, Outcome 11 Complication: Pressure sores.
1.12. Analysis.
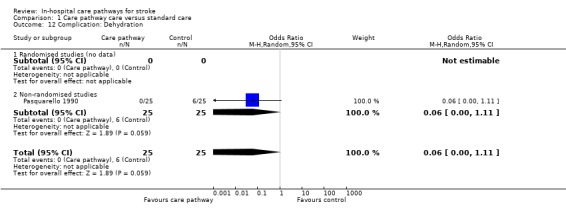
Comparison 1 Care pathway care versus standard care, Outcome 12 Complication: Dehydration.
1.13. Analysis.
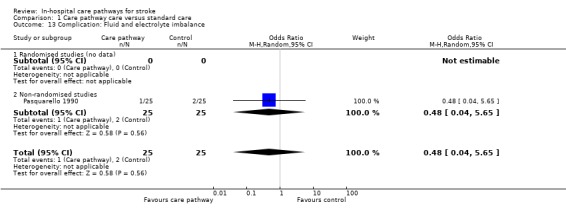
Comparison 1 Care pathway care versus standard care, Outcome 13 Complication: Fluid and electrolyte imbalance.
1.14. Analysis.
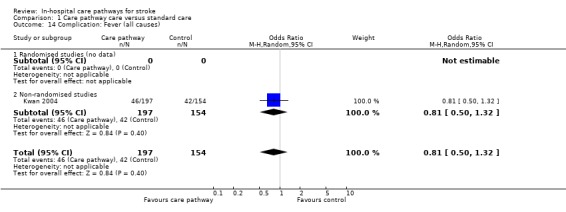
Comparison 1 Care pathway care versus standard care, Outcome 14 Complication: Fever (all causes).
1.15. Analysis.
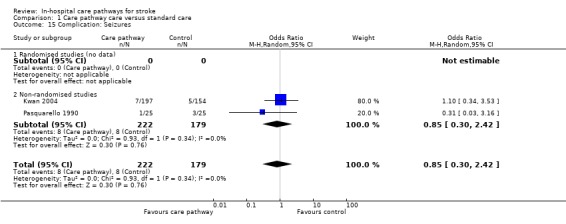
Comparison 1 Care pathway care versus standard care, Outcome 15 Complication: Seizures.
1.16. Analysis.
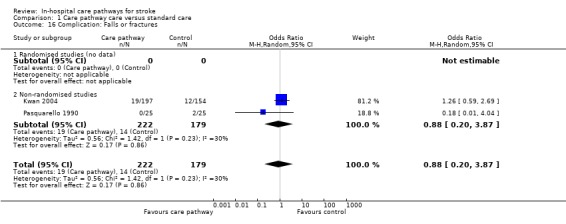
Comparison 1 Care pathway care versus standard care, Outcome 16 Complication: Falls or fractures.
1.17. Analysis.
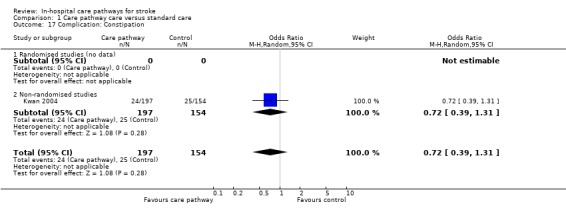
Comparison 1 Care pathway care versus standard care, Outcome 17 Complication: Constipation.
1.18. Analysis.
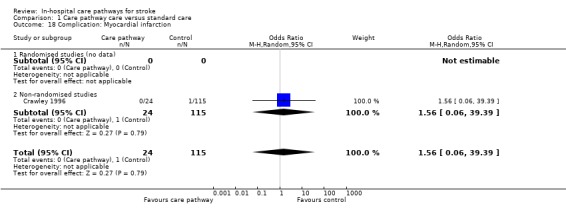
Comparison 1 Care pathway care versus standard care, Outcome 18 Complication: Myocardial infarction.
1.19. Analysis.
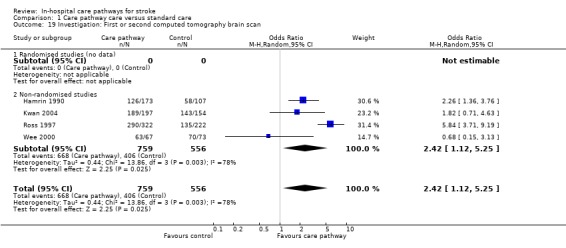
Comparison 1 Care pathway care versus standard care, Outcome 19 Investigation: First or second computed tomography brain scan.
1.20. Analysis.
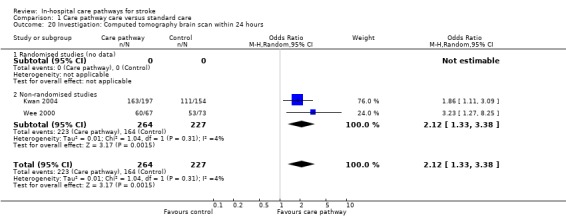
Comparison 1 Care pathway care versus standard care, Outcome 20 Investigation: Computed tomography brain scan within 24 hours.
1.21. Analysis.
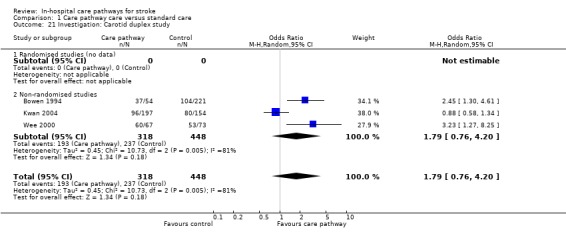
Comparison 1 Care pathway care versus standard care, Outcome 21 Investigation: Carotid duplex study.
1.22. Analysis.
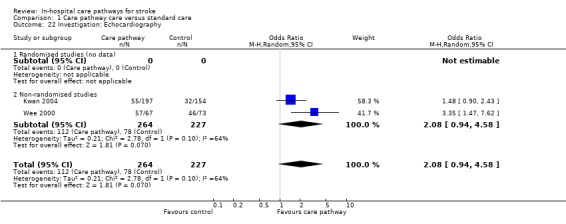
Comparison 1 Care pathway care versus standard care, Outcome 22 Investigation: Echocardiography.
1.23. Analysis.
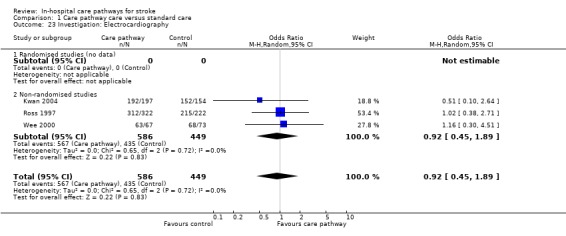
Comparison 1 Care pathway care versus standard care, Outcome 23 Investigation: Electrocardiography.
1.24. Analysis.
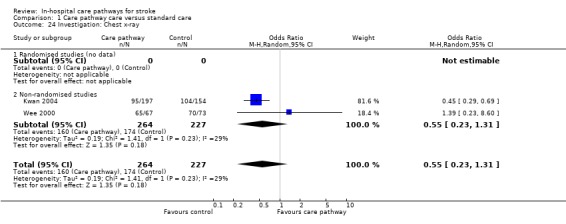
Comparison 1 Care pathway care versus standard care, Outcome 24 Investigation: Chest x‐ray.
1.25. Analysis.
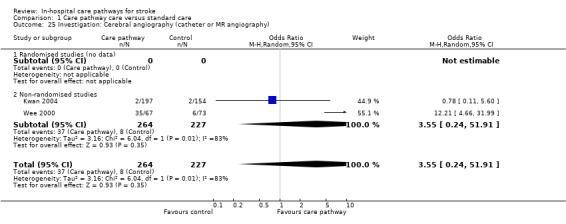
Comparison 1 Care pathway care versus standard care, Outcome 25 Investigation: Cerebral angiography (catheter or MR angiography).
1.26. Analysis.
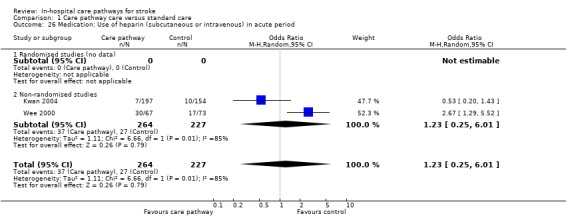
Comparison 1 Care pathway care versus standard care, Outcome 26 Medication: Use of heparin (subcutaneous or intravenous) in acute period.
1.27. Analysis.
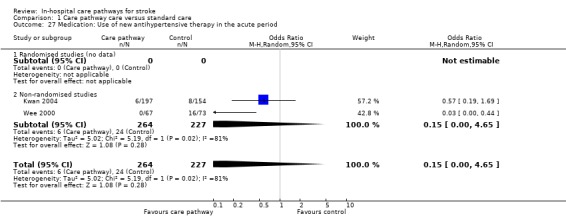
Comparison 1 Care pathway care versus standard care, Outcome 27 Medication: Use of new antihypertensive therapy in the acute period.
1.28. Analysis.
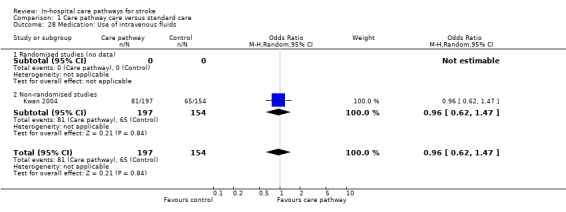
Comparison 1 Care pathway care versus standard care, Outcome 28 Medication: Use of intravenous fluids.
1.29. Analysis.
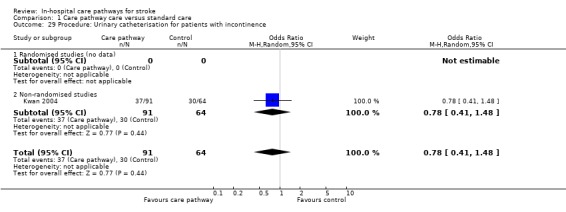
Comparison 1 Care pathway care versus standard care, Outcome 29 Procedure: Urinary catheterisation for patients with incontinence.
1.30. Analysis.
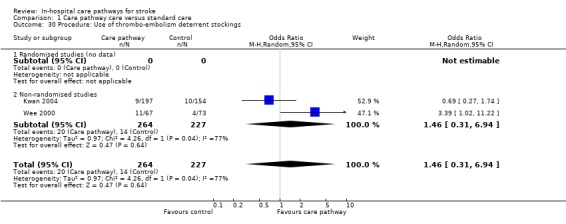
Comparison 1 Care pathway care versus standard care, Outcome 30 Procedure: Use of thrombo‐embolism deterrent stockings.
1.31. Analysis.
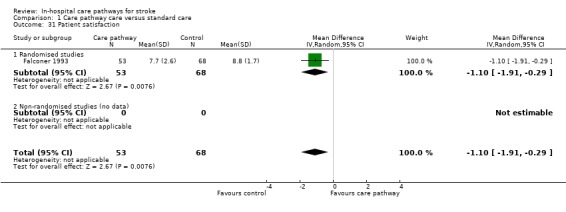
Comparison 1 Care pathway care versus standard care, Outcome 31 Patient satisfaction.
1.32. Analysis.
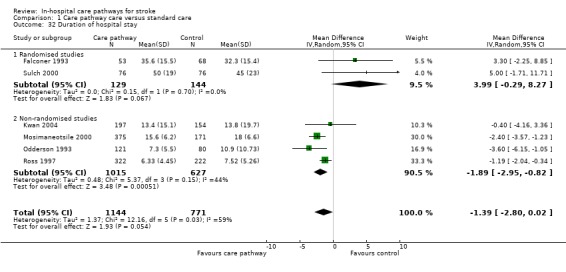
Comparison 1 Care pathway care versus standard care, Outcome 32 Duration of hospital stay.
1.33. Analysis.
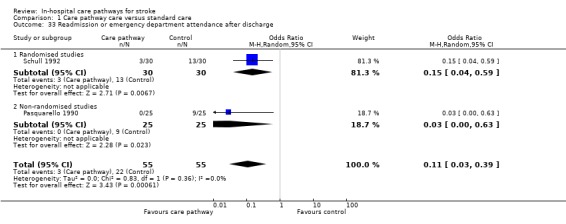
Comparison 1 Care pathway care versus standard care, Outcome 33 Readmission or emergency department attendance after discharge.
Characteristics of studies
Characteristics of included studies [ordered by study ID]
Baker 1998.
| Methods | Retrospective comparative study. From 273 records of admissions from June 1996 to 1997, 30 were randomly selected and 7 excluded because they were not acute. For the treatment group, stroke patients were screened for potential referral to case manager. | |
| Participants | 23 patients with ischaemic stroke ‐ CP group 15, control group 8. | |
| Interventions | TREATMENT GROUP: case managed care from 1995. A 5‐day written protocol with guidelines on 12 different elements of multidisciplinary care (e.g. emergency resuscitation, hydration, nutrition, elimination, skin care, psychological support, medications, patient education, and cognition). Case manager coordinated care, educated patient and family, directed resource use, and was responsible for effective implementation and documentation of care. CONTROL GROUP: undefined usual patient care. | |
| Outcomes | Mean LOS (days): CP=4.5 vs Before=2.8. Discharged home: CP=4/15 vs Before=5/8. Institutionalisation: CP=10/15 vs Before=3/8. PT: CP=11/15 vs Before=5/8. OT: CP=11/15 vs Before=5/8. Social worker: CP=3/15 vs Before=0/8. SALT: CP=5/15 vs Before=3/8. Education on stroke risk factors: CP=6/15 vs Before=0/8. Education on medications: CP=14/15 vs Before=0/8. Team communication documented: CP=15/15 vs Before=0/8. | |
| Notes | Acute stroke. Potential selection and documentation bias (i.e. poorer in control group). Both groups similar in age but CP group had more males; no data on other characteristics. | |
| Risk of bias | ||
| Bias | Authors' judgement | Support for judgement |
| Allocation concealment? | Unclear risk | D ‐ Not used |
Bowen 1994.
| Methods | Before‐and‐after study with one concurrent control group. Retrospective data collection. | |
| Participants | 346 patients with "cerebrovascular disease" (with DRG code 014) ‐ CP group 54, concurrent control group 71, 'before' group 221. 392 were considered but 6 were non‐strokes and 40 required intensive care (i.e. excluded). | |
| Interventions | TREATMENT GROUP: multidisciplinary stroke protocol with critical path for nursing care, emergency room management algorithm, and hospital unit physician's order sheet. Pre‐defined tests, treatments and time projections. CONTROL GROUP: undefined patient care for 'before' or concurrent control groups. | |
| Outcomes | Mean LOS (days): CP=5.5 vs Before=8.8 vs CC=6.7 (no CI). Carotid Doppler performed: CP=37/54 vs Before=104/221 vs CC=36/71. DVT prophylaxis: CP=14/54 vs 9/71 vs CC=30/221. UTI: CP=1/54 vs Before=32/221 vs CC=4/71. No difference in discharge destination, mortality, complications (DVT, pneumonia, infections), length or cost of rehabilitation, neuroimaging, EEG, LP, catheter angiography, 24‐hour ECG, echocardiography, therapy input, or heparin use. Median hospital cost ($): CP=4756 vs HC=7072 vs CC=7044. | |
| Notes | Acute stroke. All 3 groups were similar except concurrent control group had more haemorrhagic strokes (CC=14.7% vs CP=5.7% and Before=8.3%). | |
| Risk of bias | ||
| Bias | Authors' judgement | Support for judgement |
| Allocation concealment? | Unclear risk | D ‐ Not used |
Crawley 1996.
| Methods | Uncontrolled before‐and‐after study. Mixed prospective and retrospective data collection. | |
| Participants | 139 patients with ischaemic stroke ‐ CP group 24, 'before' group 115. | |
| Interventions | TREATMENT GROUP: case managed care using critical path, from admission to discharge. Multidisciplinary care with case manager and physician accountable for clinical and financial outcome. Weekly multidisciplinary team meetings. Stroke risk factors assessment after admission and Barthel index assessment at discharge. CONTROL GROUP: undefined usual patient care for 1 year before CP implementation. | |
| Outcomes | Mean LOS (days): CP=7.87 vs Before=12.17. UTI: CP=3/24 vs Before=16/115. Pneumonia: CP=0/24 vs Before=1/115. DVT: CP=0/24 vs Before=2/115. MI: CP=0/24 vs Before=1/115. Mean hospital cost ($): CP=5759 vs Before=8894. | |
| Notes | Acute stroke and rehabilitation. Small number of patients in CP group (n=24) in 1 year ‐ unclear reasons (e.g. selection bias by case manager). Both groups similar in characteristics. | |
| Risk of bias | ||
| Bias | Authors' judgement | Support for judgement |
| Allocation concealment? | Unclear risk | D ‐ Not used |
Falconer 1993.
| Methods | Randomised controlled trial ‐ but unclear whether study was blinded or how treatment was randomised. | |
| Participants | 128 patients with all types of stroke ‐ CP group 56, control group 72. However, 7 dropped out (CP 3, Control 4) so data analyses included only 53 patients in the CP group and 68 controls. | |
| Interventions | TREATMENT GROUP: critical path method from July 1987 to June 1988. Multidisciplinary care with pre‐defined therapeutic activities, short‐term goals and time projections. Critical path updated during each bi‐monthly multidisciplinary team meeting. CONTROL GROUP: multidisciplinary care with bi‐monthly multidisciplinary team meetings. Setting of discharge date but not patient‐oriented goals. | |
| Outcomes | Mean LOS (days): CP=35.6+/‐15.5 vs Control=32.3+/‐15.4. FIM at discharge: CP=80+/‐27.6 vs Control=84.9+/‐26.1. Mean patient satisfaction score: CP=7.7+/‐2.6 vs Control=8.8+/‐1.7. No difference in costs, institutionalisation on discharge, 12‐month survival, 12‐month hospitalisation or institutionalisation. | |
| Notes | Stroke rehabilitation. Both groups similar except CP group had slightly longer delay from onset to admission (CP=23.5 days vs Control=21.7 days). | |
| Risk of bias | ||
| Bias | Authors' judgement | Support for judgement |
| Allocation concealment? | Unclear risk | B ‐ Unclear |
Hamrin 1990.
| Methods | Uncontrolled before‐and‐after study. Prospective data collection. | |
| Participants | 280 patients with stroke and TIA ‐ CP group 173, 'before' group 107. Excluded patients with SAH or unclear diagnosis, "moribund" (undefined) patients, and those without consent. | |
| Interventions | TREATMENT GROUP: systematic care planning with written care plans from Jan to Dec 1985. Conventional multidisciplinary care plus stroke national guideline booklet, systematic care plan documentation, multidisciplinary team meetings, and educational meetings with relatives. CONTROL GROUP: poorly defined patient care from Jan to June 1984 before CP implemented. Multidisciplinary care in similar wards as CP group (regarding diagnostic procedure and medications). Assessments of disability, motor function and neurological status using local instruments (performed after admission, at 1 and 3 weeks, on discharge, and at 3 and 12 months). | |
| Outcomes | Median LOS (days): CP=11 (range 2‐251) vs Before=13 (range 3‐177). Mortality at 1 week: CP=11/173 vs Before=5/107. Mortality at discharge: CP=35/173 vs Before=24/107. Mortality at 3 months: CP=42/173 vs Before=29/107. Mortality at 1 year: CP=48/173 vs Before=41/107. Discharge home: CP=97/173 vs Before=51/107. Institutionalisation: CP=40/173 vs Before=32/107. CT scan: CP=126/173 vs Before=58/107. | |
| Notes | Acute stroke and rehabilitation. Both groups similar except CP group had more males. | |
| Risk of bias | ||
| Bias | Authors' judgement | Support for judgement |
| Allocation concealment? | Unclear risk | D ‐ Not used |
Kwan 2004.
| Methods | Before‐and‐after study with one concurrent control group (patients admitted to general medical wards). Mixed prospective and retrospective data collection. | |
| Participants | 439 patients with stroke and TIA ‐ CP group 197, 'before' group 154, and GMW group 88. | |
| Interventions | TREATMENT GROUP: integrated care pathway for use in an acute stroke unit from July 2000 to April 2001. CP document was a multidisciplinary patient record developed by stroke team to guide patient care during first five days of admission. CP consisted of check‐lists and comprised three sections ‐ doctors', nurses', and therapists' sections. On admission, initial assessments were guided by doctor's clerking proforma, nursing and therapy assessment forms, and various assessment tools. Staff followed treatment algorithms to guide acute stroke care including management of common medical problems (e.g. fever, hypoxia). Patients' goals and progress discussed at weekly MDT meeting. CONTROL GROUP: usual care within the same acute stroke unit was identical to CP group except the use of the CP. One extra physiotherapist was employed between the two study periods. GMW GROUP: stroke care provided by medical consultants and nursing staff in general medical wards. Same therapists worked in acute stroke unit. No CP, stroke protocol, or multidisciplinary record. Access to rehabilitation and neuroimaging same as CP group. | |
| Outcomes | Mean LOS (days): CP=13.4+/‐15.1 vs Before=13.8+/‐19.7 vs GMW=13.6+/‐23.4. Death by day 5: CP=11/197 vs Before=9/154 vs GMW=7/88. Death in hospital: CP=25/197 vs Before=20/154 vs GMW=9/88. Discharge to institution: CP=69/197 vs Before=56/154 vs GMW=25/88. Discharge to home: CP=103/197 vs Before=78/154 vs GMW=54/88. Dependency (mRS>2) on day 5: CP=108/123 vs GMW=35/42. COMPLICATIONS IN FIRST 5 DAYS: Pneumonia: CP=21/197 vs Before=16/154 vs GMW=8/88. UTI: CP=10/197 vs Before=15/154 vs GMW=5/88. Pressure sore: CP=5/197 vs Before=4/154 vs GMW=2/88. DVT: CP=2/197 vs Before=0/154 vs GMW=0/88. Falls: CP=19/197 vs Before=12/154 vs GMW=5/88. Fever: CP=46/197 vs Before=42/154 vs GMW=26/88. Constipation: CP=24/197 vs Before=25/154 vs GMW=9/88. Seizures: CP=7/197 vs Before=5/154 vs GMW=4/88. Any complication: CP=102/197 vs Before=92/154 vs GMW=44/88. TESTS: Total CT scan: CP=189/197 vs Before=143/154 vs GMW=82/88. CT <24hr: CP=163/197 vs Before=111/154 vs GMW=66/88. Carotid duplex: CP=96/197 vs Before=80/154 vs GMW=45/88. ECG: CP=192/197 vs Before=152/154 vs GMW=78/88. Echo: CP=55/197 vs Before=32/154 vs GMW=34/88. Cerebral angiogram/MRA: CP=2/197 vs Before=2/154 vs GMW1/88. CXR: CP=95/197 vs Before=104/154 vs GMW=42/88. DRUGS: Aspirin <48hr: CP=133/175 vs Before=101/133 vs GMW=55/78. Subcutaneous heparin: CP=6/197 vs Before=5/154 vs GMW=5/88. IV heparin: CP=1/197 vs Before=5/154 vs GMW=0/88. Oral antibiotics: CP=17/197 vs Before=16/154 vs GMW=10/88. IV antibiotics: CP=24/197 vs Before=9/154 vs GMW=13/88. IV fluids: CP=81/197 vs Before=65/154 vs GMW=26/88. Acute antihypertensive therapy: CP=6/197 vs Before=8/154 vs GMW=8/88. OTHERS: Urine catheters (for incontinent patients): CP=37/91 vs Before=30/64 vs GMW=21/29. TEDS: CP=9/197 vs Before=10/154 vs GMW=11/88. Compared to the 'before' and GMW groups, documentation was better in CP group for: 1) certain aspects of neurological assessment; and 2) anatomical site of the brain lesion and its pathologial type. | |
| Notes | Acute stroke. Both groups similar except . CP group had more total anterior circulation strokes (29% vs 18%, p=0.005). No data on costs. Compliance generally good in terms of use of CP document and level of completeness. | |
| Risk of bias | ||
| Bias | Authors' judgement | Support for judgement |
| Allocation concealment? | Unclear risk | D ‐ Not used |
Mosimaneotsile 2000.
| Methods | Uncontrolled before‐and‐after study. Retrospective data collection. | |
| Participants | 1236 patients from 1994‐1997 (but CP was phased‐in gradually from 1995‐1996 so only data for 1997 were used here). Total number of patients included 546 (375 in CP group in 1997, 171 in 'before' group in 1994). Excluded patients who had stroke >30 days ago and whose LOS was >30 days (i.e. those waiting for placement). | |
| Interventions | TREATMENT GROUP: Integrated Delivery Model of Care (IDMC) includes use of collaborative care maps, MDTs in patient assessment, care and discharge; integrated documentation of patient goals and progress; "cross‐functional training" of rehab technicians; integrated patient and carer education. CONTROL GROUP: Undefined patient care in 1994; ICP phased in from 1995 to improve rehab care and reduce LOS. | |
| Outcomes | Mean LOS (days): CP=15.6+/‐6.2 vs Before=18+/‐6.6. Discharge home: CP=320/375 vs Before=147/171. Discharge nursing home: CP=42/375 vs Before=15/171. FIM on discharge: CP=87.4+/‐18.7 vs Before=91+/‐22. FIM change from admission to discharge (SD): CP=22.7+/‐11.9 vs Before=30.9+/‐15.8. | |
| Notes | Stroke rehabilitation. Unclear difference between care map and standard care. Groups similar except ICP group had a higher level of independence on admission: FIM on admission (SD): CP=64.6+/‐16.7 vs Before=60.1+/‐16.8. Unreliable data for co‐morbidities due to coding inaccuracies. | |
| Risk of bias | ||
| Bias | Authors' judgement | Support for judgement |
| Allocation concealment? | Unclear risk | D ‐ Not used |
Odderson 1993.
| Methods | Uncontrolled before‐and‐after study. CP started if diagnosis of stroke or TIA and not for terminal patients. CP discontinued if signs resolved <24 hours or if a diagnosis of haemorrhagic stroke or non‐stroke was made. 46/121 patients in CP group were excluded or discontinued but remained in analysis. Data collected at 3 time points ‐ 1989 and 1990 (pre‐CP) and 1991‐2 (post‐CP). Retrospective data collection. | |
| Participants | 291 patients with ischaemic stroke ‐ CP group 121, 1989 group 80, 1990 group 90. | |
| Interventions | TREATMENT GROUP: clinical pathway care from June 1991 to May 1992; a 7‐day protocol with specified timed and sequential outcome and intervention for each day after admission; standard admission orders, patient and family education material; specific days for assessments by therapists (e.g. swallowing and nutritional screen on day 1; PT, OT, SALT and social worker on day 2); protocols for use of urinary catheter, DVT prophylaxis, parenteral feeding, and bowel program. CONTROL GROUP: undefined patient care (in 1989 and 1990) before CP implemented. | |
| Outcomes | Mean LOS (days): CP=7.3+/‐5.5 vs 1989=10.9+/‐10.7 vs 1990=9.8+/‐8.5. Mortality on discharge: CP=11/121 vs 1989=4/80 vs 1990=6/90. Discharged home: CP=56/121 vs 1989=34/80 vs 1990=36/90. Institutionalisation: CP=50/121 vs 1989=32/80 vs 1990=47/90. UTI: CP=8/121 vs 1990=16/90. Mean hospital costs ($): CP vs 1990= reduced by 14.6%. PEG insertion: CP=10/121 vs 1990=8/90. | |
| Notes | Acute stroke. No data on patient characteristics. Some results (e.g. mortality, institutionalisation) have to be estimated from bar charts. Some outcomes (e.g. UTI) were compared only between CP and 1990 groups. Intention‐to‐treat analysis. | |
| Risk of bias | ||
| Bias | Authors' judgement | Support for judgement |
| Allocation concealment? | Unclear risk | D ‐ Not used |
Pasquarello 1990.
| Methods | Uncontrolled before‐and‐after study. Retrospective data collection. | |
| Participants | 50 patients with stroke ‐ CP group 25, 'before' group 25. Excluded patients with haemorrhagic stroke and those who died in hospital. 186 patients were considered but only 25/100 in CP group and 25/86 in 'before' group were included (50 being a convenient number). | |
| Interventions | TREATMENT GROUP: stroke program from Jan to June 1988; multidisciplinary in‐ and outpatient care and research component; stroke program consists of discharge planning; patient education, family care, post‐discharge care (e.g. telephone contacts and assessment for multidisciplinary intervention). CONTROL GROUP: undefined patient care (from Jan to June 1987) before stroke program implemented. | |
| Outcomes | Mean LOS (days): CP=17 vs Before=8. Patients with complications: CP=5/25 vs Before=16/25. Discharged home: CP=21/25 vs Before=13/25. Institutionalisation: CP=4/25 vs Before=12/25. Readmission: CP=0/25 vs Before=9/25. Therapy ordered: CP=18/25 vs Before=20/25. Time to therapy (days): CP=0.75 vs Before=1.5. Non‐compliance with follow‐up appointment: CP=6/25 vs Before=15/25. | |
| Notes | Acute stroke. Both groups similar except CP group had lower mean age (CP=77 vs Before=66) and more patients from African origin (CP=72% vs Before=60%). | |
| Risk of bias | ||
| Bias | Authors' judgement | Support for judgement |
| Allocation concealment? | Unclear risk | D ‐ Not used |
Ross 1997.
| Methods | Uncontrolled before‐and after study, with one concurrent control group. Retrospective data collection. | |
| Participants | 544 patients with ischaemic stroke ‐ CP group 322 and 'before' group 222. Also another comparison of 346 patients ‐ CP group 285 and concurrent control group 61. | |
| Interventions | TREATMENT GROUP: critical pathway care from August 1994 to July 1995; acute multidisciplinary care in first 3 days including diagnosis, investigations, emergency room management, secondary prevention and rehabilitation planning; standard physician's orders and algorithms. CONTROL GROUP: undefined patient care for 'before' group (from July 1993 to June 1994) and concurrent control group (from August 1994 to July 1995). | |
| Outcomes | Mean LOS (days): CP=6.33+/‐4.45 vs Before=7.52 +/‐5.26. Median LOS (days): CP=5.0 vs Before=6.17. Mean LOS (Aug to Dec 1994): CP=5.83+/‐4.2 vs CC=5.85+/‐5.36. Mean LOS (Jan to July 1995): CP=5.42+/‐3.56 vs CC=8.22+/‐5.05. Documentation of focal neurological deficit: CP=287/322 vs Before=169/222. ECG: CP=312/322 vs Before=215/222. Coagulation screen: CP=280/322 vs Before=167/222. Second CT scan: CP=290/322 vs Before=135/222. | |
| Notes | Acute stroke. All groups similar in characteristics. Compliance to CP was generally good. | |
| Risk of bias | ||
| Bias | Authors' judgement | Support for judgement |
| Allocation concealment? | Unclear risk | D ‐ Not used |
Schull 1992.
| Methods | Randomised controlled trial ‐ but unclear whether study was blinded or how treatment was randomised. | |
| Participants | 60 patients with ischaemic stroke ‐ CP group 30, control group 30. | |
| Interventions | TREATMENT GROUP: case managed care with anticipatory comprehensive planning for each phase of admission; multidisciplinary care with pre‐defined goals, emotional support, patient education, discharge planning, and post‐discharge telephone follow‐up. CONTROL GROUP: undefined standard patient care. | |
| Outcomes | Mean LOS (days): CP=11.4 vs Control=14.3. Readmission <30 days: CP=1/30 vs Control=1/30. Emergency room visits <90 days: CP=1/30 vs Control=12/30. Mean follow‐up compliance (%): ICP=79 vs Control=56. Mean hospital cost ($): ICP=195143 vs Control=248605. | |
| Notes | Acute stroke and rehabilitation. Both groups similar in characteristics. Compliance to CP generally good. | |
| Risk of bias | ||
| Bias | Authors' judgement | Support for judgement |
| Allocation concealment? | Unclear risk | B ‐ Unclear |
Sulch 2000.
| Methods | Randomised controlled trial ‐ but unclear whether study was blinded. Computer randomisation (in blocks of 10). | |
| Participants | 152 patients with all types of stroke resulting in limitation of activities of daily living and required rehabilitation ‐ CP group 76, control 76. Excluded patients with severe premorbid physical or cognitive disability. No patient dropped out or crossed over. | |
| Interventions | TREATMENT GROUP: case managed care using an integrated care pathway; multidisciplinary care with rehabilitation and discharge planning, pre‐defined therapeutic activities, short‐term goals and time projections. There were weekly multidisciplinary team meetings. CONTROL GROUP: multidisciplinary care with weekly multidisciplinary team meetings. | |
| Outcomes | Mean LOS (days): CP=50+/‐19 vs Control=45+/‐23. Mortality at 6 months: CP=10/76 vs Control=6/76. Discharged home: CP=56/76 vs 54/76. Institutionalisation: CP=10/76 vs Control=16/76. Dead or dependent (mRS>2): CP=55/76 vs Control=50/76. Median Euroqol at 6 months: CP=63 vs Control=72. Controls performed better in the EuroQol domain for social functioning (p=0.014), but CP patients performed better in the EuroQol domain for self‐care (p=0.041). No difference in Barthel index, Rankin score, anxiety score, or depression score at 6 months, or duration of physio and OT input. No difference in patient or caregiver satisfaction. No improvement in process of care except documentation of: 1) certain aspects of neurological and nutritional assessments; and 2) notification to GP regarding patient's discharge. | |
| Notes | Stroke rehabilitation. Both groups similar in characteristics. Compliance with ICP good (>80% prescribed interventions completed by all disciplines) but many medical and nursing interventions were delayed; incomplete documentation in 14% of records. | |
| Risk of bias | ||
| Bias | Authors' judgement | Support for judgement |
| Allocation concealment? | Low risk | A ‐ Adequate |
Wee 2000.
| Methods | Uncontrolled before‐and‐after study. Retrospective data collection. | |
| Participants | 140 patients with ischaemic strokes ‐ CP group 67, 'before' group 73. | |
| Interventions | TREATMENT GROUP: Stroke clinical pathway care from Jan 1996 to May 1997 (16 months): daily written patient care plan to aid and improve documentation of acute stroke care, rehab, and discharge planning; used by doctors, nurses and therapists; a lay version of pathway provided for patient and carer. CONTROL GROUP: Undefined patient care from Jan‐Dec 1994 (12 months); CP introduced as a method to improve patient care. | |
| Outcomes | Mean LOS (days): CP (1993‐4)=8.9 vs Before (1995‐8)=6.3. Total CT: CP=63/67 vs Before=70/73 (NS). CT<24 hr: CP=60/67 vs Before=53/73 (p=0.002). ECG: CP=63/67 vs Before=68/73 (NS). CXR: CP=65/67 vs Before=70/73 (NS). Echo: CP=57/67 vs Before=46/63 (p=0.003). Carotid Duplex: CP=60/67 vs Before=53/73 (p=0.01). Cerebral angiogram/MRA: CP=35/67 vs Before=6/73 (p<0.0001). TEDS: CP=11/67 vs Before=4/73 (p=0.04). Subcutaneous heparin: CP=8/67 vs Before=2/73 (p=0.03). IV heparin: CP=22/67 vs Before=15/73 (NS). Acute treatment of hypertension after stroke: CP=0/67 vs Before=16/73 (p<0.0001). Use of drugs on discharge (excluding deaths): 1) warfarin: CP=14/65 vs Before=12/71 (NS); 2) aspirin: CP=32/65 vs Before=42/71 (NS); 3) ticlodipine: CP=15/65 vs Before=59/71 (NS). No significant change in cost over time. | |
| Notes | Acute stroke and rehabilitation. No data on patient characteristics. Unclear difference between CP and standard care. | |
| Risk of bias | ||
| Bias | Authors' judgement | Support for judgement |
| Allocation concealment? | Unclear risk | D ‐ Not used |
Widjaja 2002.
| Methods | Uncontrolled before‐and‐after study. Prospective data collection. | |
| Participants | 257 patients with all types of stroke ‐ CP group 125, 'before' group 132. | |
| Interventions | TREATMENT GROUP: Stroke pathway care from April to June 2001: undefined stroke pathway care; variances collected prospectively and daily from multiple sources; other outcome data collected on discharge; Head of Neurology Division discussed variance findings with MDT and followed up with corrective actions during weekly ward rounds. CONTROL GROUP: undefined patient care from April to June 2000; CP introduced as a method for cost‐containment. | |
| Outcomes | Mean LOS (days): CP=9.7 vs Before=16.4 (p<0.001). In‐hospital mortality: CP=7/125 vs Before=16/132 (p=0.07). UTI: CP=16/125 vs Before=22/132 (p=0.38). Pneumonia: CP=10/125 vs Before=13/132 (p=0.6). Weak evidence of reduced delay to CT scan and discharge to "step‐down" facilities. | |
| Notes | Acute stroke and rehabilitation. Data collection incomplete in the control group. Groups similar in characteristics. Unclear difference between CP and standard care. | |
| Risk of bias | ||
| Bias | Authors' judgement | Support for judgement |
| Allocation concealment? | Unclear risk | D ‐ Not used |
Wilkinson 2000.
| Methods | Uncontrolled before‐and‐after study. Retrospective data collection. | |
| Participants | 275 stroke episodes ‐ CP group 142, 'before' group 133. | |
| Interventions | TREATMENT GROUP: Stroke pathway introduced in 1997 but pathway care poorly defined. CONTROL GROUP: Undefined patient care before July 1997; patient admitted via Emergency Department to acute medical ward for 2‐3 days, then transferred to post‐acute medical ward, then referred to rehabilitation if necessary; poor documentation; variable LOS; CP introduced as a method for cost‐containment and improvement of outcome. | |
| Outcomes | Mean LOS (days): CP=5.8 vs Before=10.6. | |
| Notes | Acute stroke. Lack of clear data made summarisation difficult. No data on baseline characteristics. | |
| Risk of bias | ||
| Bias | Authors' judgement | Support for judgement |
| Allocation concealment? | Unclear risk | D ‐ Not used |
CC: concurrent control CP: care pathway CT: computed tomography CXR: chest x‐ray DRG: diagnostic related groups DVT: deep vein thrombosis ECG: electrocardiogram EEG: electroencephalogram FIM: functional independence measure GMW: general medical ward IQR: interquatile range IV: intravenous LOS: length of stay (in hospital) LP: lumbar puncture MDT: multidisciplinary team MI: myocardial infarction MRA: magnetic resonance angiography n: number of patients NS: non‐significant (statistical) OT: occupational therapy PEG: percutaneous endoscopic gastrostomy PT: physiotherapy SAH: subarachnoid haemorrhage SALT: speech and language therapy TEDS: thrombo‐embolism deterrent stockings TIA: transient ischaemic attack UTI: urinary tract infection vs: versus $: US dollar (cost per patient) +/‐: plus or minus one standard deviation
Characteristics of excluded studies [ordered by study ID]
| Study | Reason for exclusion |
|---|---|
| Abissi 1995 | This abstract described some beneficial effects of a new care pathway but there was inadequate information on the intervention, the methodology of the study, and the results |
| Alberts 1996 | The intervention that had been tested in this study did not fulfil the definition criteria for a care pathway |
| Allen 2002 | This was a randomised trial of interdisciplinary post‐discharge care management, i.e. a community‐based programme |
| Bokemark 1995 | The intervention that had been tested in this study did not fulfil the definition criteria for a care pathway |
| Chui 1997 | The intervention that had been tested in this study did not fulfil the definition criteria for a care pathway |
| Dignan 1986 | The intervention studied was a mixed hospital‐ and community‐based "stroke prgramme". Data were collected from 3 separate groups of hospitals (19 hospitals in total), which had introduced different programmes at different times |
| Duryee 1996 | The treatment group included a period before the intervention had been introduced |
| Edwards 1996 | The participants who had been recruited by this study did not suffer a condition that fulfilled the definition for a stroke |
| Englander 1998 | The intervention that had been tested in this study did not fulfil the definition criteria for a care pathway |
| Evans 1995 | The intervention that had been tested in this study did not fulfil the definition criteria for a care pathway |
| Friedman 1990 | The intervention that had been tested in this study did not fulfil the definition criteria for a care pathway |
| Goldberg 1997 | This was a randomised controlled trial but the intervention was community‐based case management of stroke patients after discharge from hospital |
| Goldstein 1998 | The intervention that had been tested in this study did not fulfil the definition criteria for a care pathway |
| Hainsworth 1997 | Data were collected from 3 separate hospitals that had introduced different care pathways at different times. It was unclear which data belonged to the intervention groups and which belonged to the control groups |
| Hashimoto 2000 | The data for stroke and non‐stroke patients were combined and could not be separated |
| Horgan 1996 | The intervention that had been tested in this study did not fulfil the definition criteria for a care pathway |
| Ivey 1995 | This article described some beneficial effects of a new care pathway but there was inadequate information on the intervention and the methodology of the study |
| Jahnke 2003 | This article described some beneficial effects of a new care pathway but there was inadequate information on the intervention and the methodology of the study |
| Jungkind 1999 | This article described some beneficial effects of a new care pathway but there was inadequate information on the intervention and the methodology of the study |
| Karanjia 1997 | The intervention that had been tested in this study did not fulfil the definition criteria for a care pathway |
| Lagoe 1997 | The control group was inappropriate because it consisted of different hospitals in other states. All data were collected after the introduction of the intervention |
| Lagoe 1998 | This article described some beneficial effects of a new care pathway but there was inadequate information on the intervention and the methodology of the study. All data were collected after the introduction of the intervention |
| Langhorne 2001 | The intervention that had been tested in this study did not fulfil the definition criteria for a care pathway |
| MacKenzie 1998 | The intervention that had been tested in this study did not fulfil the definition criteria for a care pathway |
| Moloney 1999 | This abstract described some beneficial effects of a new care pathway but there was inadequate information on the intervention, the methodology of the study, and the results |
| Monane 1996 | The intervention that had been tested in this study did not fulfil the definition criteria for a care pathway |
| Odderson 1995 | The intervention that had been tested in this study did not fulfil the definition criteria for a care pathway: the care pathway only managed swallowing difficulties after stroke (i.e. not truely mulidisciplinary) |
| Patel 2001 | There is inadequate information on the intervention, methodology of the study, and results |
| Pearson 1988 | This was a randomised controlled trial but the intervention was stroke care within a nursing unit and the intervention did not fulfil the definition criteria for a care pathway |
| Quigley 1998 | This was an open study of care pathways for both stroke and traumatic brain injury. There was no pre‐care pathway group for comparison. All data were collected after the introduction of the intervention |
| Ramachandran 1996 | All data were collected after the introduction of the intervention |
| Retchin 1997 | The intervention that had been tested in this study did not fulfil the definition criteria for a care pathway |
| Reuben 1995 | The intervention that had been tested in this study did not fulfil the definition criteria for a care pathway |
| Romito 1990 | This article described some beneficial effects of a new care pathway but there was inadequate information on the intervention and the methodology of the study |
| Rosenberger 1999 | This article described some beneficial effects of a new care pathway but there was inadequate information on the intervention and the methodology of the study |
| Rossiter 1995 | The participants who had been recruited by this study did not suffer a condition that fulfilled the definition for a stroke |
| Schmidt 1999 | This was an open study of community‐based nursing case management for stroke, which was delivered through a care pathway |
| Sulch 2000 (SR) | This was a systematic review containing one randomised controlled trial ‐ Falconer 1993 |
| Summers 1998 | All data were collected after the introduction of the intervention |
| Underwood 1999 | There was inadequate definition of the intervention and the methodology of the study |
| van Straten 1997 | All data were collected after the introduction of the intervention |
| von Reutern 1998 | The intervention that had been tested in this study did not fulfil the definition criteria for a care pathway |
| Wentworth 1996 | All data were collected after the introduction of the intervention |
| Wood‐Dauphinee 1984 | The intervention that had been tested in this study did not fulfil the definition criteria for a care pathway |
| Zander 1988 | This article described some beneficial effects of a new care pathway but there was inadequate information on the intervention and the methodology of the study |
Contributions of authors
For the original review and all the subsequent updates, Dr Joseph Kwan performed the bibliographic searches, identified the studies, assessed their methodological quality, extracted the data, and produced the first draft of the review. Professor Peter Sandercock assessed the methodological quality of the studies, checked the extracted data, and commented on all the draft manuscripts.
Sources of support
Internal sources
University of Edinburgh, UK.
University of Southampton, UK.
External sources
The Stroke Association, UK.
NHS R&D Health Technology Assessment Programme, UK.
Declarations of interest
The contact reviewer (JK) is also the author of one of the included non‐randomised studies (Kwan 2004).
Edited (no change to conclusions)
References
References to studies included in this review
Baker 1998 {published data only}
- Baker CM, Miller I, Sitterding M, Hajewski CJ. Acute stroke patients. Comparing outcomes with and without case management. Nursing Case Management 1998;3(5):196‐203. [PubMed] [Google Scholar]
Bowen 1994 {published data only}
- Bowen J, Yaste C. Effect of a stroke protocol on hospital costs of stroke patients. Neurology 1994;44:1961‐4. [DOI] [PubMed] [Google Scholar]
Crawley 1996 {published data only}
- Crawley WD. Case management: improving outcomes of care for ischaemic stroke patients. MEDSURG Nursing 1996;5(4):239‐44. [PubMed] [Google Scholar]
Falconer 1993 {published data only}
- Falconer JA, Roth EJ, Sutin JA, Strasser DC, Chang RW. The critical path method in stroke rehabilitation: Lessons from an experiment in cost containment and outcome improvement. Quality Review Bulletin 1993;19:8‐16. [DOI] [PubMed] [Google Scholar]
Hamrin 1990 {published data only}
- Hamrin EKF, Lindmark B. The effect of systematic care planning after acute stroke in general hospital medical wards. Journal of Advanced Nursing 1990;15:1146‐53. [DOI] [PubMed] [Google Scholar]
Kwan 2004 {published and unpublished data}
- Kwan J. Integrated care pathways for acute stroke: an evaluation of their effects using multiple approaches (MD Thesis). University of Edinburgh, November 2002. [Google Scholar]
- Kwan J, Hand P, Dennis M, Sandercock P. Effects of introducing an integrated care pathway in an acute stroke unit. Age and Ageing 2004;33:362‐7. [DOI] [PubMed] [Google Scholar]
- Kwan J, Hand P, Dennis M, Sandercock P. What are the effects of introducing a care pathway in an acute stroke unit? Results of a before‐and‐after study of 351 patients. Cerebrovascular Diseases 2002;13 (Suppl 3):7. [Google Scholar]
Mosimaneotsile 2000 {published data only}
- Mosimaneotsile B, Braun K, Tokishi C. Stroke patient outcomes: does an integrated delivery model of care make a difference?. Physical and Occupational Therapy in Geriatrics 2000;17(2):67‐82. [Google Scholar]
Odderson 1993 {published data only}
- Odderson IR, McKenna BS. A model for management of patients with stroke during the acute phase. Outcome and economic implications. Stroke 1993;24:1823‐7. [DOI] [PubMed] [Google Scholar]
Pasquarello 1990 {published data only}
- Pasquarello MA. Measuring the impact of an acute stroke program on patient outcomes. Journal of Neuroscience Nursing 1990;22(2):76‐82. [DOI] [PubMed] [Google Scholar]
Ross 1997 {published data only}
- Ross G, Johnson D, Kobernick M. Evaluation of a critical pathway for stroke. Journal of the American Osteopathic Association 1997;97(5):269‐76. [DOI] [PubMed] [Google Scholar]
Schull 1992 {published data only}
- Schull DE, Tosch P, Wood M. Clinical nurse specialists as collaborative care managers. Nursing Management 1992;23:30‐3. [DOI] [PubMed] [Google Scholar]
Sulch 2000 {published data only}
- Sulch D, Evans A, Melbourn A, Kalra L. Does an integrated care pathway improve process of care in stroke rehabilitation? A randomized controlled trial. Age and Ageing 2002;31:175‐9. [DOI] [PubMed] [Google Scholar]
- Sulch D, Melbourn A, Perez I, Kalra L. Integrated care pathways and quality of life on a stroke rehabilitation unit. Stroke 2002;33:1600‐4. [DOI] [PubMed] [Google Scholar]
- Sulch D, Perez I, Melbourn A, Kalra L. Evaluation of an integrated care pathway for stroke unit rehabilitation. Age and Ageing 1999;29 (Suppl 1):57. [DOI] [PubMed] [Google Scholar]
- Sulch D, Perez I, Melbourn A, Kalra L. Randomised controlled trial of integrated (managed) care pathway for stroke rehabilitation. Stroke 2000;31:1929‐34. [DOI] [PubMed] [Google Scholar]
Wee 2000 {published data only}
- Wee AS, Cooper WB, Chatham RK, Cobb AB, Murphy T. The development of a stroke clinical pathway: an experience in a medium‐sized community hospital. Journal of the Mississippi State Medical Association 2000;41(7):648‐53. [PubMed] [Google Scholar]
Widjaja 2002 {published data only}
- Widjaja LS, Chan BP, Chen H, Ong BKC, Pang YT. Variance analysis applied to a stroke pathway: how this can improve efficiency of healthcare delivery. Annals of Academy of Medicine Singapore 2002;31(4):425‐30. [PubMed] [Google Scholar]
Wilkinson 2000 {published data only}
- Wilkinson G, Parcell M, MacDonald A. Finalist: ACHS Quality Improvement Award. Cerebrovascular accident clinical pathway. Journal of Quality in Clinical Practice 2000;20:109‐12. [DOI] [PubMed] [Google Scholar]
References to studies excluded from this review
Abissi 1995 {published data only}
- Abissi CJ, Sepe E, Patlak C, Davis JN. Cerebral infarction: comparison of a care plan with case management to traditional care. Neurology 1995;45 (Suppl 4):A240 (Abstract 280P). [Google Scholar]
Alberts 1996 {published data only}
- Alberts MJ, Bennett CA, Rutledge VR. Hospital charges for stroke patients. Stroke 1996;27:1825‐8. [DOI] [PubMed] [Google Scholar]
Allen 2002 {published data only}
- Allen KR, Hazelett S, Jarjoura D, Wickstrom GC, Hua K, Weinhardt J, et al. Effectiveness of a postdischarge care management model for stroke and transient ischaemic attack: a randomized trial. Journal of Stroke and Cerebrovascular Diseases 2002;11(2):88‐98. [DOI] [PubMed] [Google Scholar]
Bokemark 1995 {published data only}
- Bokemark L, Blomstrand C, Fagerberg B. How are guidelines for the management of acute stroke optimally implemented in clinical practice. Pan‐European Consensus Meeting On Stroke Management. Helsingborg, Sweden, 8‐10 November 1995:No 19.
Chui 1997 {published data only}
- Chui L, Goh MH, Hung CT, Shyu WC, Chang TP. The effectiveness of systematic stroke care. Kaohsiung Journal of Medical Sciences 1997;13:496‐502. [PubMed] [Google Scholar]
Dignan 1986 {published data only}
- Dignan MB, Howard G, Toole JF, Becker C, McLeroy KR. Evaluation of the North Carolina stroke care program. Stroke 1986;17(3):382‐6. [DOI] [PubMed] [Google Scholar]
Duryee 1996 {published data only}
- Duryee R, Calanchini P, Miller R. The impact of a stroke clinical pathway: measuring effectiveness. Neurology 1996;46 (Suppl):A428 (Abstract S63.007). [Google Scholar]
Edwards 1996 {published data only}
- Edwards WH, Sr, Edwards WH, Jr, Martin RS, Mulherin JL, Bullock D. Resource utilization and pathways: meeting the challenge of cost containment. American Surgeon 1996;62(10):830‐4. [PubMed] [Google Scholar]
Englander 1998 {published data only}
- Englander RN, Morich DH, Minniti MM. Accelerating the evaluation of acute stroke patients in a community hospital. Neurology 1998;50:A114 (Abstract P02.091). [Google Scholar]
Evans 1995 {published data only}
- Evans R, Connis R, Hendricks R, Haselkorn J. Meta‐analysis of stroke outcome: survival, function, and residence. Stroke 1995;26(1):156. [Google Scholar]
Friedman 1990 {published data only}
- Friedman PJ. Stroke rehabilitation in the elderly: a new patient management system. New Zealand Medical Journal 1990;103:234‐6. [PubMed] [Google Scholar]
Goldberg 1997 {published data only}
- Goldberg G, Segal ME, Berk SN, Schall RR, Gershkoff AM. Stroke transition after inpatient rehabilitation. Topics in Stroke Rehabilitation 1997;4(1):64‐79. [DOI] [PubMed] [Google Scholar]
Goldstein 1998 {published data only}
- Goldstein LB, Hey LA, Laney R. North Carolina stroke prevention and treatment facilities survey. rtPA therapy for acute stroke. Stroke 1998;29:2069‐72. [DOI] [PubMed] [Google Scholar]
Hainsworth 1997 {published data only}
- Hainsworth DS, Lockwood‐Cook E, Pond M, Lagoe RJ. Development and implementation of clinical pathways for stroke on a multihospital basis. Journal of Neuroscience Nursing 1992;29:156‐62. [DOI] [PubMed] [Google Scholar]
Hashimoto 2000 {published data only}
- Hashimoto Y, Terasaki T, Yonehara T, Tokunaga M, Hirano T, Uchino M. Critical pathway and hospital‐hospital cooperation in acute stroke. Interventional Neuroradiology 2000;6 (Suppl 1):251‐5. [DOI] [PMC free article] [PubMed] [Google Scholar]
Horgan 1996 {published data only}
- Horgan F, Crowe M, Keating D, McNamara A, Leahy P. The development of a comprehensive stroke programme in the acute hospital. Irish Medical Journal 1996;89(6):222. [PubMed] [Google Scholar]
Ivey 1995 {published data only}
- Ivey MF, Armitstead JA, Sangha KS. Critical pathways at University of Cincinnati hospital. American Journal of Health‐System Pharmacy 1995;52:1053‐8. [DOI] [PubMed] [Google Scholar]
Jahnke 2003 {published data only}
- Jahnke HK, Zadrozny D, Garrity T, Hopkins S, Frey L, Christopher M. Stroke teams and acute stroke pathways: one emergency department's two‐year experience. Journal of Emergency Nursing 2003;29(2):133‐9. [DOI] [PubMed] [Google Scholar]
Jungkind 1999 {published data only}
- Jungkind K, Corish C. Pilot acute ischemic stroke program saves $9,756 per case. Hospital Case Management 1999;7:87‐90. [PubMed] [Google Scholar]
Karanjia 1997 {published data only}
- Karanjia PN, Nelson JJ, Lefkowitz DS, Dick AR, Toole JF, Chambless LE, Hayes R, Howard VJ. Validation of the ACAS TIA/stroke algorithm. Neurology 1997;48:346‐51. [DOI] [PubMed] [Google Scholar]
Lagoe 1997 {published data only}
- Lagoe RJ, Aspling DL. Benchmarking and clinical pathway implementation on a multihospital basis. Nursing Economics 1997;15(3):131‐7. [PubMed] [Google Scholar]
Lagoe 1998 {published data only}
- Lagoe RJ. Basic statistics for clinical pathway evaluation. Nursing Economics 1998;16(3):125‐31. [PubMed] [Google Scholar]
Langhorne 2001 {published data only}
- Langhorne P, Fraser P, Wright F, Shields M, MacIntosh G, Stott D. Evaluation of an acute care protocol for stroke patients; a controlled clinical trial. Cerebrovascular Diseases 2001;11 (Suppl 4):35 [Abstract No. 22]. [Google Scholar]
MacKenzie 1998 {published data only}
- MacKenzie AE, Chang AM. The effectiveness of nursing care: use of a protocol to promote stroke rehabilitation. Improving Health Services through Research in Hong Kong: A Compendium of Abstracts for Projects Funded by the Health Services Research Committee 1994‐1998. Hong Kong: Health Services Research Committee, 1998:12. [Google Scholar]
Moloney 1999 {published data only}
- Moloney A, Critchlow B, Jones K. A multidisciplinary care pathway in stroke ‐ does it improve care?. Age and Ageing 1999;28 (Suppl 1):42 (Abstract 87). [Google Scholar]
Monane 1996 {published data only}
- Monane M, Kanter DS, Glynn RJ, Avorn J. Variability in length of hospitization for stroke. The role of managed care in an elderly population. Archives of Neurology 1996;53:875‐80. [DOI] [PubMed] [Google Scholar]
Odderson 1995 {published data only}
- Odderson IR, Keaton JC, McKenna BS. Swallow management in patients on an acute stroke pathway: quality is cost effective. Archives of Physical Medicine and Rehabilitation 1995;76:1130‐3. [DOI] [PubMed] [Google Scholar]
Patel 2001 {unpublished data only}
- Patel N. Organised care for acute stroke. Unpublished.
Pearson 1988 {published data only}
- Pearson A, Durand I, Punton S. Effects of admission to a nursing unit. Australian Journal of Advanced Nursing 1988;6(1):38‐42. [PubMed] [Google Scholar]
Quigley 1998 {published data only}
- Quigley PA, Wallace Smith S, Strugar J. Successful experiences with clinical pathways in rehabilitation. Journal of Rehabilitation 1998;64(2):29‐32. [Google Scholar]
Ramachandran 1996 {published data only}
- Ramachandran TS, Culebras A, Hainsworth D. Development and implementation of a clinical pathway for stroke in acute care. Neurology 1996;46 (Suppl ):A319 (Abstract P04.119). [Google Scholar]
Retchin 1997 {published data only}
- Retchin SM, Brown RS, Yeh SCJ, Chu D, Moreno L. Outcomes of stroke patients in medicare fee for service and managed care. JAMA 1997;278(2):119‐24. [PubMed] [Google Scholar]
Reuben 1995 {published data only}
- Reuben DB, Borok GM, Wolde‐Tsadik G, Ershokk DH, FIshman LK, Ambrosini VL, et al. A randomized trial of comprehensive geriatric assessment in the care of hospitalized patients. New England Journal of Medicine 1995;332:1345‐50. [DOI] [PubMed] [Google Scholar]
Romito 1990 {published data only}
- Romito D. A critical path for CVA patients. Rehabilitation Nursing 1990;15(3):153‐6. [DOI] [PubMed] [Google Scholar]
Rosenberger 1999 {published data only}
- Rosenberger JM, Wiemers NE. CareMaps in medical rehabilitation. Journal of Care Management 1999;5(2):23‐37. [Google Scholar]
Rossiter 1995 {published data only}
- Rossiter D, Thompson AJ. Introduction of integrated care pathways for patients with multiple sclerosis in an inpatient neurorehabilitation setting. Disability and Rehabilitation 1995;17(8):443‐8. [DOI] [PubMed] [Google Scholar]
Schmidt 1999 {published data only}
- Schmidt SM, Guo L, Scheer S, Boydston J, Pelino C, Berger SK. Epidemiological determination of community‐based nursing case management for stroke. Journal of Nursing Administration 1999;29(6):40‐7. [DOI] [PubMed] [Google Scholar]
Sulch 2000 (SR) {published data only}
- Sulch D, Kalra L. Integrated care pathways in stroke management. Age and Ageing 2000;29:349‐52. [DOI] [PubMed] [Google Scholar]
Summers 1998 {published data only}
- Rymer MM, Summers D, Soper P. Development of clinical pathways for stroke management. An example from Saint Luke's Hospital, Kansas City. Clinics in Geriatric Medicine 1999;15(4):741‐64. [PubMed] [Google Scholar]
- Summers D, Soper PA. Implementation and evaluation of stroke clinical pathways and the impact on cost of stroke care. Journal of Cardiovascular Nursing 1998;13(1):69‐87. [DOI] [PubMed] [Google Scholar]
Underwood 1999 {published data only}
- Underwood F, Parker J. Developing and evaluating an acute stroke care pathway through action research. Nurse Reseacher 1999;6(2):27‐38. [Google Scholar]
van Straten 1997 {published data only}
- Straten A, Meulen JHP, Crevel H, Habbema JDF, Limburg M. Quality of hospital care for stroke patients in The Netherlands. Cerebrovascular Disease 1997;7:251‐7. [Google Scholar]
von Reutern 1998 {published data only}
- Reutern GM, Allendorfer J. Stroke treatment with stroke unit and rehabilitation by a team. A model for a staged management [Schlaganfallbehandlung mit Stroke Unit and Rehabilitation durch ein Team]. Nervenarzt 1999;70:149‐54. [DOI] [PubMed] [Google Scholar]
Wentworth 1996 {published data only}
- Wentworth DA, Atkinson RP. Implementation of an acute stroke program decreases hospitalization costs and length of stay. Stroke 1996;27:1040‐3. [DOI] [PubMed] [Google Scholar]
Wood‐Dauphinee 1984 {published data only}
- Wood‐Dauphinee S, Shapiro S, Bass E, Fletcher C, Georges P, Hensby V, et al. A randomized trial of team care following stroke. Stroke 1984;15(5):864‐72. [DOI] [PubMed] [Google Scholar]
Zander 1988 {published data only}
- Zander K. Nursing case management: strategic management of cost and quality outcomes. Journal of Nursing Administration 1988;18:23‐30. [PubMed] [Google Scholar]
Additional references
Bamford 1991
- Bamford J, Sandercock PAG, Dennis MS, Burn J, Warlow CP. Classification and natural history of clinically identifiable subtypes of cerebral infarction. Lancet 1991;337:1521‐6. [DOI] [PubMed] [Google Scholar]
Campbell 2000
- Campbell M, Fitzpatrick R, Haines A, Kinmouth AL, Sandercock P, Spiegelhalter D, et al. Framework for design and evaluation of complex interventions to improve health. BMJ 2000;321:694‐6. [DOI] [PMC free article] [PubMed] [Google Scholar]
Chalmers 1983
- Chalmers TC, Celano P, Sacks HS, Smith H. Bias in treatment assignment in controlled clinical trials. New England Journal of Medicine 1983;309:1358‐61. [DOI] [PubMed] [Google Scholar]
Deeks 2003
- Deeks JJ, Dinnes J, D'Amico R, Sowden AJ, Sakaovitch C, Song F, et al. Evaluating non‐randomised intervention studies. Health Techology Assessment 2003;7:27. [DOI] [PubMed] [Google Scholar]
Ebrahim 1999
- Ebrahim S, Redfern J. Stroke care ‐ a matter of chance: a national survey of stroke services. The Stroke Association, 1999. [Google Scholar]
Egger 1998
- Egger M, Schneider M, Davey Smith G. Spurious precision? Meta‐analysis of observational studies. British Medical Journal 1998;316:140‐4. [DOI] [PMC free article] [PubMed] [Google Scholar]
Hydo 1995
- Hydo B. Designing an effective clinical pathway for stroke. American Journal of Nursing 1995;95(3):44‐51. [PubMed] [Google Scholar]
Kaste 1998
- Kaste M, Fogelholm R, Rissanen A. Economic burden of stroke and the evaluation of new therapies. Public Health 1998;112(2):103‐12. [DOI] [PubMed] [Google Scholar]
Lanska 1998
- Lanska DJ. The role of clinical pathways in reducing the economic burden of stroke. Pharmacoeconomics 1998;14(2):151‐8. [DOI] [PubMed] [Google Scholar]
McNaughton 2003
- McNaughton H, McPherson K, Taylor W, Weatherall M. Relationship between process and outcome in stroke care. Stroke 2003;34:713‐7. [DOI] [PubMed] [Google Scholar]
Mulrow 1999
- Mulrow CD, Oxman AD. Cochrane Collaboration Handbook. The Cochrane Library 2001, issue 3.
Murray 1997
- Murray CJL, Lopez AD. Mortality by cause for eight regions of the world: Global Burden of Disease Study. Lancet 1997;349:1269‐76. [DOI] [PubMed] [Google Scholar]
Overill 1998
- Overill S. A practical guide to care pathways. Journal of Integrated Care 1998;2:93‐8. [Google Scholar]
Pearson 1995
- Pearson SD, Goulart‐Fisher D, Lee TH. Critical pathways as a strategy for improving care: Problems and potential. Annals of Internal Medicine 1995;123:941‐8. [DOI] [PubMed] [Google Scholar]
RCP 2001
- Royal College of Physicians. National Clinical Guidelines For Stroke. RCP, 2001. [Google Scholar]
Rothwell 2001
- Rothwell PM. The high cost of not funding stroke research: a comparison with heart disease and cancer. Lancet 2001;357:1612. [DOI] [PubMed] [Google Scholar]
Rudd 1999
- Rudd AG, Irwin P, Rutledge Z, Lowe D, Morris R, Pearson MG. The national sentinel audit of stroke: a tool for raising standards of care. Journal of the Royal College of Physicians of London 1999;30:460‐4. [PMC free article] [PubMed] [Google Scholar]
Sacks 1982
- Sacks H, Chalmers TC, Smith, Jr H. Randomized versus historical controls for clinical trials. American Journal of Medicine 1982;72:233‐40. [DOI] [PubMed] [Google Scholar]
SUTC 2000
- Stroke Unit Trialists Collaboration. Organised inpatient (stroke unit) care for stroke. Cochrane Database of Systematic Reviews 2000, Issue 1. [Art. No.: CD000197. DOI: 10.1002/14651858.CD000197] [DOI] [PubMed] [Google Scholar]
Sutton 2000
- Sutton AJ. Empirical assessment of effect of publication bias on meta‐analyses. BMJ 2000;320(7249):1574‐7. [DOI] [PMC free article] [PubMed] [Google Scholar]
Wade 1992
- Wade D. Measurement in neurological rehabilitation. Oxford: Oxford University Press, 1992. [Google Scholar]
WHO 1989
- World Health Organization. Stroke 1989. Recommendations on stroke prevention, diagnosis, and therapy: Report of the WHO Task Force on stroke and other cerebrovascular disorders. Stroke 1989;20:1407‐31. [DOI] [PubMed] [Google Scholar]
References to other published versions of this review
Kwan ACPJC 2002
- Kwan J, Sandercock P. Review: In‐hospital care pathways for acute stroke do not improve clinical outcomes and lower quality of life. ACP Journal Club 2002;137(2):77. [PubMed] [Google Scholar]
Kwan Stroke 2003
- Kwan J, Sandercock P. In‐hospital care pathways for stroke: a Cochrane systematic review. Stroke 2003;34(2):587‐8. [DOI] [PubMed] [Google Scholar]


