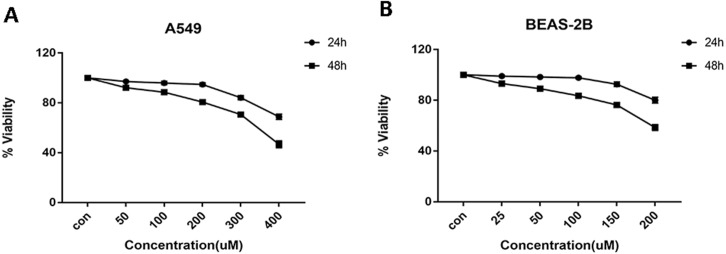
Figure 2. Cell viability of A549 and BEAS-2B cells treated with different concentrations of glycyrrhizin.
(A) A549 cells were treated with glycyrrhizin at the concentrations of 50 µM, 100 µM, 200 µM respectively for 24 h and 48 h. (B) BEAS-2B cells were treated with glycyrrhizin at the concentrations of 25 µM, 50 µM, 100 µM respectively for 24 h and 48 h. Cell viability assays were performed to determine the viability of cells with various concentrations glycyrrhizin treatment.

