Abstract
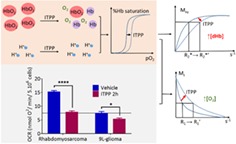
Hypoxia is a crucial factor in cancer therapy, determining prognosis and the effectiveness of treatment. Although efforts are being made to develop methods for assessing tumor hypoxia, no markers of hypoxia are currently used in routine clinical practice. Recently, we showed that the combined endogenous MR biomarkers, R1 and R2*, which are sensitive to [dissolved O2] and [dHb], respectively, were able to detect changes in tumor oxygenation induced by a hyperoxic breathing challenge. In this study, we further validated the ability of the combined MR biomarkers to assess the change in tumor oxygenation induced by an allosteric effector of hemoglobin, myo‐inositol trispyrophosphate (ITPP), on rat tumor models. ITPP induced an increase in tumor pO2, as observed using L‐band electron paramagnetic resonance oximetry, as well as an increase in both R1 and R2* MR parameters. The increase in R1 indicated an increase in [O2], whereas the increase in R2* resulted from an increase in O2 release from blood, inducing an increase in [dHb]. The impact of ITPP was then evaluated on factors that can influence tumor oxygenation, including tumor perfusion, saturation rate of hemoglobin, blood pH and oxygen consumption rate (OCR). ITPP decreased blood [HbO2] and significantly increased blood acidity, which is also a factor that right‐shifts the oxygen dissociation curve. No change in tumor perfusion was observed after ITPP treatment. Interestingly, ITPP decreased OCR in both tumor cell lines. In conclusion, ITPP increased tumor pO2 via a combined mechanism involving a decrease in OCR and an allosteric effect on hemoglobin that was further enhanced by a decrease in blood pH. MR biomarkers could assess the change in tumor oxygenation induced by ITPP. At the intra‐tumoral level, a majority of tumor voxels were responsive to ITPP treatment in both of the models studied.
Keywords: magnetic resonance imaging; myo‐inositol trispyrophosphate; ∆R1, ∆R2*, tumor hypoxia
The combined endogenous MR biomarkers, R1 and R2*, arepromising tools for assessing tumor hypoxia. In this study, R1 and R2* successfully tracked the increase in tumor oxygenation induced by an allostericeffector of hemoglobin, ITPP. ITPP causes a combined decrease in the bindingaffinity of Hb‐O2, in blood pH and in the oxygen consumption rate oftumor cells, which translates into a significant increase in R1 and R2*.
Abbreviations used
- DCE‐MRI
dynamic contrast‐enhanced MRI
- dHb
deoxy‐hemoglobin
- EPR
electron paramagnetic resonance
- ITPP
myo‐inositol trispyrophosphate
- MRI
magnetic resonance imaging
- OCR
oxygen consumption rate
- ODC
oxygen dissociation curve
- ROI
region of interest
1. INTRODUCTION
Hypoxia is a common situation occurring in solid tumors. A reduction in tumor oxygenation is the result of an insufficient oxygen supply and the increasing oxygen demand of tumor cells. Hypoxia is known to be a factor that can contribute to the failure of cancer treatment as well as to tumor recurrence.1 One attractive strategy to improve the effectiveness of radiation therapy is to decrease hypoxia at the time of irradiation. A meta‐analysis of over 10 000 patients from 86 randomized trials showed that modifying tumor hypoxia improved the outcome of patients treated with radiation therapy with an odds ratio of 0.77.2 However, such an intervention only produced a modest benefit, as screening for the presence of hypoxia had not been an entry criterion prior to hypoxia modification in these trials. A better treatment response was observed in trials in which hypoxia was identified in tumors prior to irradiation. Thus, there is a growing need to detect hypoxic tumors and patients who could benefit from hypoxia modification. Various techniques have been developed to quantify tumor oxygenation, including 19F‐MRI of perfluorocarbon,3 electron paramagnetic resonance (EPR) oximetry,4 1H‐MRI of hexamethyldisiloxane PISTOL,5 PET imaging of nitroimidazoles,6 19F MRI/MRS of fluorinated nitroimidazoles,7 polarographic needle electrodes8 and fiber optic probes.9 However, so far no standard method has become available for routine clinical practice, as none of these techniques are currently able to address all of the practical challenges, such as noninvasiveness, tumor accessibility, or spatial and temporal resolutions.
Among the various oximetric techniques, imaging is regarded as an appropriate method for hypoxia detection because it is adapted to two observable features of hypoxia: spatial and temporal variations in oxygenation.10 In order for an imaging technique to be adopted in routine oncology practice, a number of requirements need to be met, such as noninvasiveness, the possibility of repeated measurements, high spatial and temporal resolution, cost‐effectiveness, robustness and easy translation to human trials.10 One potential method to evaluate tumor hypoxia consists of the assessment of the oxygen‐sensitive endogenous MR contrast parameters, R1 and R2*, which fulfills most of these criteria. Both MR biomarkers are sensitive to the change in pO2, but reflect distinct features. The dissolved paramagnetic molecular oxygen in tissue fluid and in blood plasma increases the spin lattice relaxation rate R1 via dipolar interaction. Meanwhile, the effective spin–spin relaxation rate R2* is accelerated by an increase in paramagnetic deoxyhemoglobin. Because dissolved O2 is mainly present in tissue while dHb exists only in blood vessels, R1 primarily reflects tissue oxygenation while R2* is more sensitive to changes in blood oxygenation.10, 11, 12, 13, 14
One drawback of R1 is its low sensitivity. Starting from the fact that the solubility of oxygen is better in lipids than in water, our group previously assessed the signal of R1 of lipid protons (R1L) instead of the global R1 (R1G) (which mostly reflects the signal of water protons [R1W]), expecting that it should be more sensitive to the changes in pO2. 15, 16
It should be noted that a change in tumor pO2 is the additive result of multifactorial processes within the tumor. Each technique can only provide information about one or more facets of the overall change in the tumor microenvironment. Thus, there is an interest in combining multiple parameters to expand the understanding and assessment of tumor hemodynamics, which are essential for personalized treatment. In a previous study, we combined R1 and R2* to evaluate the changes in tumor pO2 induced by a hyperoxic gas breathing challenge.14
The aim of the current study was to further validate the combined endogenous MRI contrast parameters R1 (including R1G, R1W and R1L) and R2* to assess the change in tumor oxygenation. For this purpose, we used another oxygen modifier, with a different mechanism of action from the hyperoxic gas breathing challenge. Tumor pO2 can be improved by manipulating the oxygen unloading capacity of blood. The allosteric effector of hemoglobin promotes the dissociation of oxygen from hemoglobin by right‐shifting the oxygen dissociation curve, thus increasing tumor oxygenation. Compounds under clinical investigation such as OXY111A (myo‐inositol trispyrophosphate [ITPP]) (http://normoxys.com/clinical-trial-results/) and Efaproxiral17 were well tolerated and induced an increase in partial pressure of oxygen in preclinical models. Efaproxiral has reached phase III in patients with brain metastases from breast cancer. However, no significant improvement in overall survival has been observed using the combination of Efaproxiral and whole brain radiation therapy.18 In this context, we chose ITPP to induce change in tumor pO2 .19, 20, 21 The compound has been found to decrease hypoxia and improve tumor outcome in various animal models when used as a monotherapy or combined with chemotherapy.22, 23, 24 The phase I clinical investigation showed a good tolerance of patients to ITPP.19
2. MATERIALS AND METHODS
The study was approved by the local ethics committee. Studies were undertaken in accordance with the national and local regulations of the ethics committee (agreement number UCL/2014/MD/026).
2.1. Tumor models
Two tumor models were included in the study: rhabdomyosarcoma and 9 L‐glioma. Rhabdomyosarcoma cells were grown in Roswell Park Memorial Institute (RPMI) medium supplemented with 10% fetal calf serum (heat inactivated), and a 1% mixture of antibiotics (penicillin 100 UI/mL, streptomycin 0.1 mg/mL) for in vitro experimentation. For in vivo study, fragments from a syngeneic rhabdomyosarcoma (1 mm3) were grafted subcutaneously into one thigh of male adult WAG/Rij rats. The model was developed by the Laboratory of Experimental Radiobiology, Katholieke Universiteit Leuven, Belgium. 9 L‐glioma cells were grown in RPMI medium supplemented with 10% fetal calf serum (heat inactivated), a 1% mixture of antibiotics (penicillin 100 UI/mL, streptomycin 0.1 mg/mL), 1% nonessential amino acids and 1% sodium pyruvate. To establish 9 L‐glioma tumors in vivo, male adult Fisher F344 rats were inoculated subcutaneously in their thighs with 5 x 10⁶ cells. Tumor implantations were performed on the rats under general anesthesia with intraperitoneal (IP) injection of ketamine and xylazine (80 and 10 mg/kg, respectively) on rats weighing between 200 and 250 g. The animals were introduced into the study when the tumors reached the size of 15 to 20 mm.
2.2. ITPP treatment
ITPP was generously provided by NormOxys Inc. (Boston, MA). For in vivo study, ITPP was prepared at a concentration of 200 mg/mL in saline for IP injection at a dose of 2 g/kg. For in vitro study, adherent cells were treated with medium containing 10mM ITPP. The effect of ITPP was studied after 2 hours of treatment.
2.3. In vivo experimental design
Four cohorts were involved:
Tumor pO2 was measured on nine rhabdomyosarcomas and 10 9 L‐gliomas.
The MRI measurements were performed on eight rhabdomyosarcomas and nine 9 L‐gliomas.
The blood gas test for the measurement of the saturation of hemoglobin and of blood pH was performed on five healthy Fischer rats.
20 rhabdomyosarcomas and 14 9 L‐gliomas were used for the measurement of the perfused area by the Patent Blue staining method.
For tumor pO2 and perfusion measurement studies, animals were allocated to two groups: vehicle (NaCl 0.9%) and ITPP. For MRI and blood gas test studies, animals were measured at two time points: before and 2 hours after ITPP treatment.
2.4. L‐band EPR oximetry
L‐band EPR spectroscopy allowed the direct measurement of tumor oxygenation through the conversion of EPR linewidth to pO2 using a calibration curve.25 Briefly, charcoal wood powder (CX0670–1, EM Science, Gibbstown, NJ) was used as an oxygen‐sensitive sensor. About 200 μL of charcoal suspension (100 mg/mL) was introduced within the tumor at a depth of 3–6 mm using a 23‐gauge needle. EPR experiments were performed 24 hours after probe implantation using an L‐band EPR spectrometer (Magnettech, Berlin, Germany) equipped with a low‐frequency microwave bridge operating at 1.2 GHz and a loop‐gap resonator. The animals were anesthetized (1.5% isoflurane, 2 L/min) for EPR measurement and the tumors were placed at the center of the loop‐gap resonator, whose sensitivity extended to 1 cm around the loop. The modulation frequency was 100 kHz and the amplitude modulation was less than one third of the peak‐to‐peak linewidth to avoid peak distortion. The linewidth of the first‐derivative EPR spectrum that was the average of five scan accumulations was then converted to pO2 using a calibration curve. After the baseline pO2 value had been recorded, the animals were treated with ITPP (six 9 L‐gliomas, three rhabdomyosarcomas) or NaCl 0.9% (four 9 L‐gliomas, six rhabdomyosarcomas) and image acquisition was then repeated after 2 hours of administration.
2.5. Blood gas test
Venous blood samples were taken from the animals at two time points: before and 2 hours after ITPP administration. The rats were anesthetized with 1.5% isoflurane during blood sampling. Gas delivery (medical air containing 21% O2 mixed with isoflurane) was continuous at 2 L/min through a nosepiece. About 1 mL of blood was drawn from the lateral tail vein to a special blood test syringe (safePICO Aspirator, Radiometer Medical, Denmark). The gas bubble was removed and the blood was kept from exposure to the external air thanks to a special cap. The sample was mixed with heparin present in the syringe to reduce the risk of clots. Blood samples were analyzed by an ABL901 analyzer (Radiometer, Denmark) within 1 hour after sampling.
2.6. MRI study
The rats were anesthetized with 1.5% isoflurane (2 L/min) during the MRI experiments. MRI measurements were made before and 2 hours after ITPP administration.
In order to compare the effect of ITPP treatment on the voxel scale, the animals were monitored longitudinally over time to acquire individual data in the pretreatment and posttreatment conditions. For this purpose, temperature and breathing rate were monitored using MR‐compatible probes throughout the image acquisition process. Temperature was kept constant using a water‐circulating blanket connected to a heated water bath.
MRI was performed on an 11.7 T, 16 cm inner diameter bore system (Bruker, Biospec) with a 7 cm diameter birdcage coil for signal transmission and a surface array coil (2 x 2 elements, 18 x 18 mm2 each) for signal reception. A warm water blanket was used to maintain the animals' temperature at 37°C, and the temperature was monitored with an MR‐compatible rectal probe.
A multislice Rapid Acquisition with Relaxation Enhancement (RARE) sequence was first used to determine the most representative tumor slice for further measurement, with the following parameters: TE/TR/RARE‐factor/FOV/matrix size/slice thickness = 10.66 ms/2500 ms/6/35 x 35 mm/256 x 256/1 mm. The representative slice was selected manually for each tumor. It was typically the largest slice of each tumor. The segmented IR‐FISP sequence (SSFP‐FID mode) was used for R1 acquisition with the following parameters: TR/TE/FA/BW/FOV/matrix size/slice thickness = 4 ms/1.35 ms/10°/100 kHz/55 x 30 mm/100 x 85/1 mm, four segments, 100 TI from 13 ms to 8329 ms every 84 ms, and a total acquisition time of 20 minutes. The resonant frequency for excitation of R1 sequence was set at the resonance of water. Multi‐Gradient Echo R2* images were acquired at TR/FA/slice thickness = 3000 ms/15°/1 mm with a FOV of 35 x 35 mm on a 256 x 256 matrix, with 12 echoes from 3.5 to 58.5 ms every 5 ms. The total acquisition time was 9 minutes 36 seconds.
Data analysis was performed with an in‐house program developed in ImageJ and MATLAB (MATLAB R2013b, The Math Works). R1 and R2* maps were calculated with an MRI analysis calculator plug‐in in ImageJ software. This MRI analysis method is adapted from the original plug‐in created by Karl Schmidt (http://rsb.info.nih.gov/ij/) using a curve‐fitting method based on the Simplex method. R1L and R1W were extracted from the R1G map by a bi‐exponential deconvolution method. Hence, the term R1G refers to the R1 acquired by MRI and is the sum of the contributors of R1W and R1L. Meanwhile, R1L and R1W indicate the generated data obtained by the deconvolution of R1G. Regions of interest (ROIs) were drawn manually around the tumor on the selected anatomic slice and were transferred to R1L, R1W, R1G and R2* maps of the same slice. The subtraction of the two maps acquired before and after ITPP treatment was performed voxel by voxel, resulting in maps of ∆R1L, ∆R1W, ∆R1G and ∆R2*. Coregistration was performed using a homemade script on Matlab. During acquisition, similar orientation was used for the R2* map and the R1 map, so that only translation transformations were needed for coregistration.
2.7. Perfusion study – Patent Blue staining
We used the Patent Blue staining method in order to obtain a rough estimate of the tumor perfusion fraction. This method has been validated by comparison with DCE‐MRI.26, 27 Animals were treated with vehicle, 1 mL NaCl 0.9% (10 rhabdomyosarcomas and six 9 L‐gliomas), or ITPP (10 rhabdomyosarcomas and eight 9 L‐gliomas). Two hours after treatment, Patent Blue was injected through the tail vein (Sigma‐Aldrich, 1 mL of Patent Blue solution 1.25%). The animals were sacrificed by an overdose of pentobarbital exactly 1 minute after the administration of Patent Blue. The tumors were rapidly excised and cut into two size‐matched halves. Pictures of each tumor cross section were taken with a digital camera. The tumor perfusion fraction was estimated as the percentage of stained area of the whole tumor cross section analyzed by ImageJ.
2.8. Oxygen consumption rate
The oxygen consumption rate (OCR) was measured in vitro using a Bruker EMXplus EPR spectrometer operating at 9.5 GHz. Briefly, adherent cells were trypsinized and resuspended in fresh medium (107 cells/mL). A mix of 100 μL of cell suspension and 100 μL of 20% dextran was sealed in a glass capillary tube in the presence of 0.2mM of a nitroxide probe acting as an oxygen sensor (15N 4‐oxo‐2,2,6,6‐tetramethylpiperidine‐d16‐15N‐1‐oxyl, CDN isotopes, Pointe‐Claire, Quebec, Canada). The sample was placed in a quartz ESR tube and maintained at 37°C by heated nitrogen during the acquisition of the spectra. EPR linewidth was measured every minute and reported on a calibration curve to obtain the oxygen concentration.28 OCR was determined by the absolute value of the slope of the decrease in oxygen concentration in the closed capillary tube over time.
2.9. Statistical analysis
Statistical analyses were performed with the GraphPad (Prism) program. Results were expressed as mean ± SEM (standard error of the mean). To evaluate the differences between groups of data, we used the two‐tailed t‐test. For all tests, P < 0.05 was regarded as significant (*P < 0.05; **P < 0.01; ***P < 0.001; ****P < 0.0001).
3. RESULTS
In a preliminary study, tumor pO2 in rhabdomyosarcomas and in 9 L‐gliomas was monitored longitudinally by EPR oximetry.29 We found that a single dose of ITPP induced an increase in tumor pO2 that was maximal at 2 hours postadministration.29 In this study, we selected this time point to evaluate the impact of ITPP treatment on tumor pO2 and oxygen‐dependent MR parameters in two rat tumor models.
The change in in vivo tumor pO2 was confirmed by L‐band EPR oximetry (Figure 1, Table 1). In both models under study, we did not notice any change in tumor pO2 in the control group before and 2 hours after saline administration. However, we observed that ITPP treatment significantly increased tumor pO2 in both models (P < 0.01) at the same time point. The change (0‐ vs. 2‐h ITPP) was significantly greater in 9 L‐gliomas than in rhabdomyosarcomas (P < 0.01, Table 1B).
Figure 1.
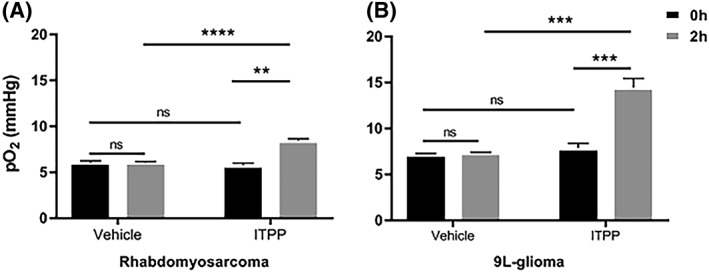
Tumor oxygenation of (A) rhabdomyosarcomas (vehicle N = 6, myo‐inositol trispyrophosphate [ITPP] N = 3) and (B) 9 L‐gliomas (vehicle N = 4, ITPP N = 6) obtained by L‐band electron paramagnetic resonance (EPR) oximetry before and 2 hours after ITPP or saline administration (mean ± SEM). Both tumor models were responsive to ITPP, with a significant increase in tumor pO2. Saline injection did not change tumor pO2 **p<0.01, ***p<0.001, ****p<0.0001, ns= not significant
Table 1.
Summary of (A) tumor pO2 (mmHg) assessed by electron paramagnetic resonance (EPR) band L in vehicle‐ and myo‐inositol trispyrophosphate (ITPP)‐treated tumors and (B) the change in tumor pO2 induced by ITPP compared with the vehicle group (2‐hour vehicle) and pretreatment group (0‐hour ITPP). (Mean ± SEM)
| Vehicle (mmHg) | ITPP (mmHg) | |||
|---|---|---|---|---|
| 0 h | 2 h | 0 h | 2 h | |
| (A) | ||||
| Rhabdomyosarcoma | 6 ± 0.2 | 6 ± 0.1 | 5.7 ± 0.3 | 8.4 ± 0.1 |
| 9 L‐glioma | 7.2 ± 0.1 | 7.3 ± 0.1 | 7.8 ± 0.5 | 14.4 ± 1 |
| 0‐h ITPP vs. 2‐h ITPP (mmHg) | 2‐h vehicle vs. 2‐h ITPP (mmHg) | T‐test | |
|---|---|---|---|
| (B) | |||
| Rhabdomyosarcoma | 2.7 ± 0.3 | 2.4 ± 0.2 | P > 0.05 |
| 9 L‐glioma | 6.6 ± 1.1 | 7.1 ± 1.3 | P > 0.05 |
| T‐test | P < 0.01 | ‐ | |
Figures 2 and 3 present pre‐ and post‐ITPP treatment MRI data for rhabdomyosarcomas and 9 L‐gliomas, respectively. The data were normalized to the baseline values. The reproducibility of R1 and R2* measurements in the two tumor models is reported in Table 2.
Figure 2.
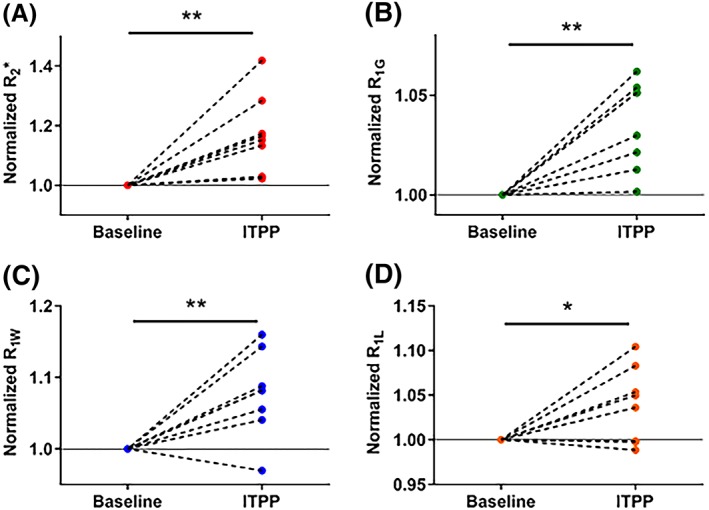
Individual normalized changes in magnetic resonance imaging (MRI) parameters in rhabdomyosarcomas (N = 8) before and 2 hours after myo‐inositol trispyrophosphate (ITPP) administration. All MRI parameters increased under the effect of ITPP *p<0.05, **p<0.01
Figure 3.
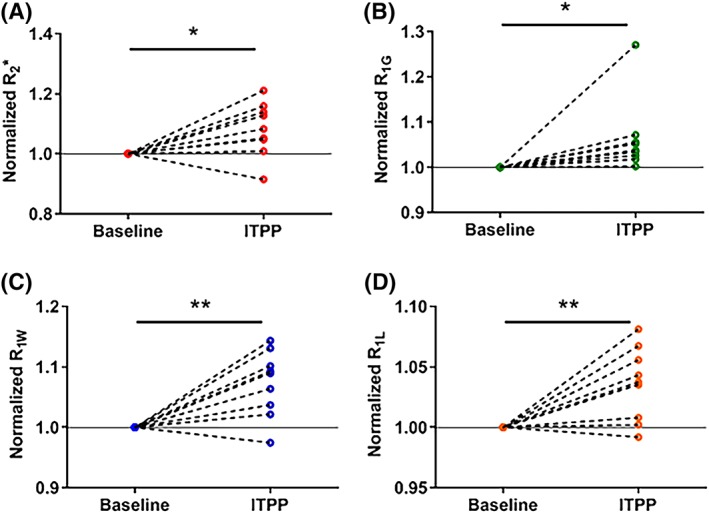
Individual normalized changes in magnetic resonance imaging (MRI) parameters in 9 L‐gliomas (N = 9) before and 2 hours after myo‐inositol trispyrophosphate (ITPP) administration. All MRI parameters increased under the effect of ITPP *p<0.05, **p<0.01
Table 2.
Coefficient of variation (COV) of R1 and R2* measurements in 9 L‐gliomas and in rhabdomyosarcomas. Each COV value was calculated for the corresponding data set. The previous presentation may induce confusion. Thus, we have added the % after each COV value
| Rhabdomyosarcoma | 9 L‐glioma | |||
|---|---|---|---|---|
| Baseline | ITPP | Baseline | ITPP | |
| R2* | 21.7% | 25% | 15.7% | 14.8% |
| R1G | 4.2% | 4.8% | 7.7% | 6% |
| R1W | 2.4% | 3.9% | 3.3% | 5.6% |
| R1L | 6.8% | 7.8% | 5.2% | 5.9% |
A change in R2* may be due to a change in [dHb] per volume of tissue, which possibly relates to the change in O2 released from the blood. ITPP significantly increased R2* from 83.8 ± 6.4 to 98.6 ± 8.7 s−1 in rhabdomyosarcomas (P < 0.01, Figure 2A) and from 83.1 ± 4.3 to 89.6 ± 4.4 s−1 in 9 L‐gliomas (P = 0.02, Figure 3A). R2* of all tumors in both models studied (n = 8‐9/model) increased after ITPP administration, except for one 9L‐glioma tumor, which showed a decrease in R2* (Figure 3A).
A change in R1 could be the result of a change in dissolved O2. A significantly faster relaxation rate was generally observed for all R1 parameters (R1G, R1W and R1L) in both models after ITPP administration (P < 0.05) (Figures 2 and 3B‐D). R1G increased from 2.11 ± 0.03 to 2.19 ± 0.04 s−1 in rhabdomyosarcomas (P < 0.01, Figure 2B) and from 2.12 ± 0.05 to 2.25 ± 0.05 s−1 in 9 L‐gliomas (P = 0.05, Figure 3B). R1W was 1.01 ± 0.01 s−1 (vehicle) and 1.08 ± 0.02 s−1 (ITPP) (P < 0.01) in rhabdomyosarcomas (Figure 2C) and 1.05 ± 0.01 s−1 (vehicle) and 1.13 ± 0.02 s−1 (ITPP) (P < 0.01) in 9 L‐gliomas (Figure 3C). R1G increased after ITPP treatment in both tumor models (Figures 2B and 3B). However, for the R1W parameter, there was one tumor in each model presenting an opposite trend in response to ITPP treatment. In response to ITPP, R1L increased from 3.24 ± 0.08 to 3.36 ± 0.09 s−1 (P = 0.04) (Figure 2D) and from 3.45 ± 0.06 to 3.57 ± 0.07 s−1 (P < 0.01) (Figure 3D) in rhabdomyosarcomas and 9 L‐gliomas, respectively. Two rhabdomyosarcomas and one 9 L‐glioma showed a decrease in R1L after ITPP treatment. R1L was not shown to be more sensitive to changes in tumor oxygenation than R1G or R1W in these models.
Figure 4 shows representative anatomic images as well as the ∆R1 and ∆R2* maps of one 9 L‐glioma and one rhabdomyosarcoma. Figure 5 shows the heterogeneity in R1 and R2* response to ITPP challenge in rhabdomyosarcomas and in 9 L‐gliomas at the inter‐tumoral level. In both models, ITPP induced increases in R1 and R2* in most (>50%) of the voxels in each tumor.
Figure 4.
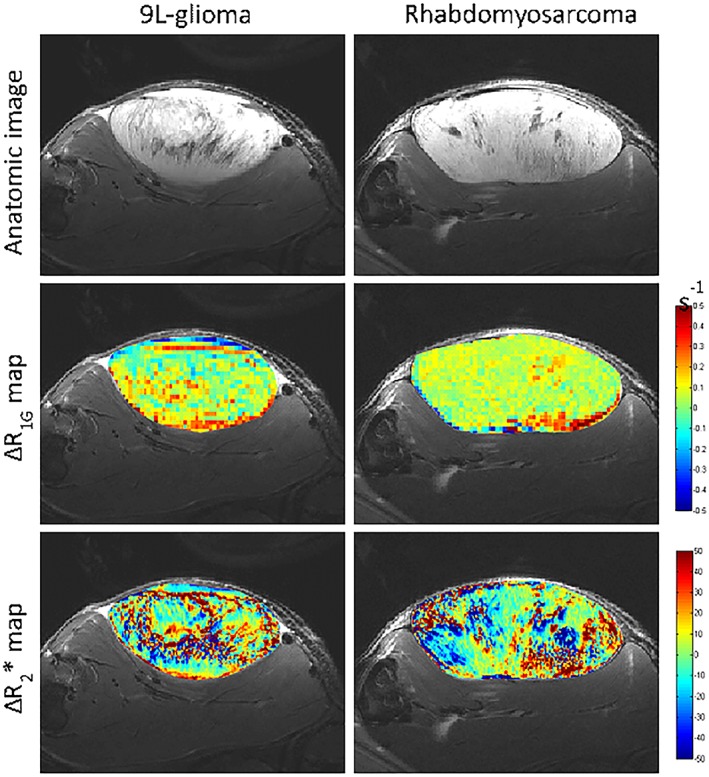
Representative anatomic images, ∆R1 maps and ∆R2* maps of a 9 L‐glioma and a rhabdomyosarcoma. The delta maps were obtained by subtracting the baseline maps from post‐myo‐inositol trispyrophosphate (ITPP) treatment maps
Figure 5.
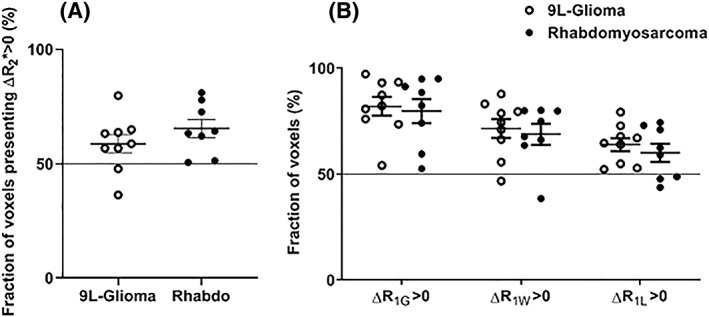
Mean fractional myo‐inositol trispyrophosphate (ITPP)‐induced (A) ∆R2* > 0 and (B) ∆R1 > 0 of rhabdomyosarcomas (filled circles) and 9 L‐gliomas (open circles) (mean ± SEM). Each symbol presents the data of a tumor. At the intra‐tumor level, a majority of voxels in most of the tumors presented ΔR1 > 0 and ΔR2* > 0
Since R2* is sensitive to the change in [dHb], we assessed the impact of ITPP on HbO2 saturation in the blood (Figure 6). ITPP significantly decreased the saturation of hemoglobin from 91.6 ± 1.1% to 67.9 ± 4.4% (P < 0.01) (Figure 6A). Interestingly, we also found a slight but significant decrease in blood pH: the pH values were 7.46 ± 0.01 and 7.40 ± 0.01 for the vehicle‐ and ITPP‐treated samples, respectively (P < 0.01, paired t‐test) (Figure 6B). Both factors can contribute to a right‐shift of the oxygen dissociation curve (ODC).
Figure 6.
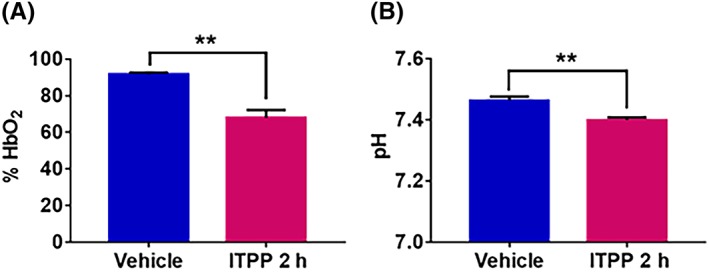
(A) Change in hemoglobin saturation before and 2 hours after myo‐inositol trispyrophosphate (ITPP) administration in healthy venous rat blood sample (N = 5). ITPP significantly decreases the rate of hemoglobin saturation (mean ± SEM). (B) Change in venous blood pH before and 2 hours after ITPP administration in healthy venous rat blood sample (N = 5). ITPP slightly but significantly decreases the blood pH (mean ± SEM) **p<0.01
We further tested the impact of ITPP on the perfusion of tumors to verify whether the change in R2* might be due to a change in tumor perfusion. The Patent Blue staining method provides a rough estimation of the tumor‐perfused fraction.26, 27 The experiment showed no difference in the percentage of colored area between tumors in the vehicle group and tumors treated with ITPP in either model (Figure 7). The colored area percentages were 82.5 ± 2.7% (vehicle, n = 10) and 77.2 ± 2.1% (ITPP, n = 10) (P = 0.14) for rhabdomyosarcomas and 56.7 ± 2.5% (vehicle, n = 6) and 44.0 ± 4.9% (ITPP, n = 8) (P = 0.06) for 9 L‐gliomas. We excluded the potential role of an increase in R2* related to a change in perfusion. It should be noted that rhabdomyosarcomas were better perfused than 9 L‐gliomas (P < 0.01, unpaired t‐test).
Figure 7.
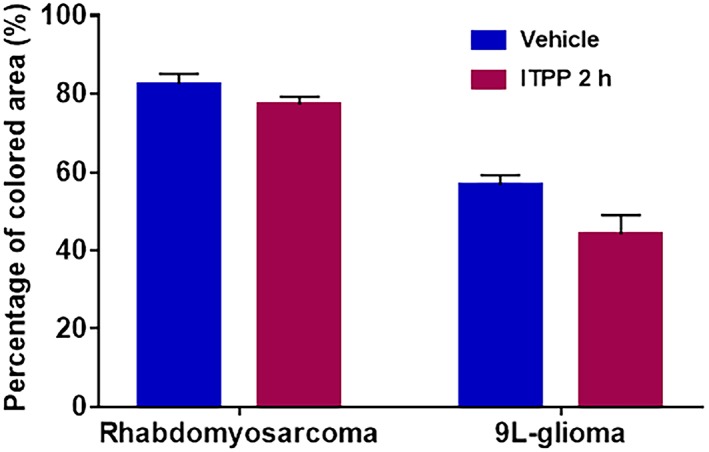
Mean value ± SEM of Patent Blue‐perfused area in rhabdomyosarcomas (vehicle N = 10; myo‐inositol trispyrophosphate [ITPP] N = 10) and in 9 L‐gliomas (vehicle N = 6; ITPP N = 8). No significant difference was observed between the vehicle group and the group treated with ITPP in either model
Two factors determine tumor pO2: O2 supply and O2 consumption of tumor cells. An increase in tumor pO2 can be induced by increasing the O2 supply and/or decreasing the O2 consumption. The in vitro OCR of both cell lines was assessed by X‐band EPR oximetry and the results are presented in Figure 8. ITPP treatment significantly decreased OCR in both cell lines. OCR decreased from 15.21 ± 0.5 to 7.85 ± 0.51 nmol O2/min/5 x 106 cells (P < 0.01) and from 7.47 ± 0.61 to 5.3 ± 0.43 nmol O2/min/5 x 106 cells (P = 0.02) for rhabdomyosarcoma and 9L‐glioma cells, respectively.
Figure 8.
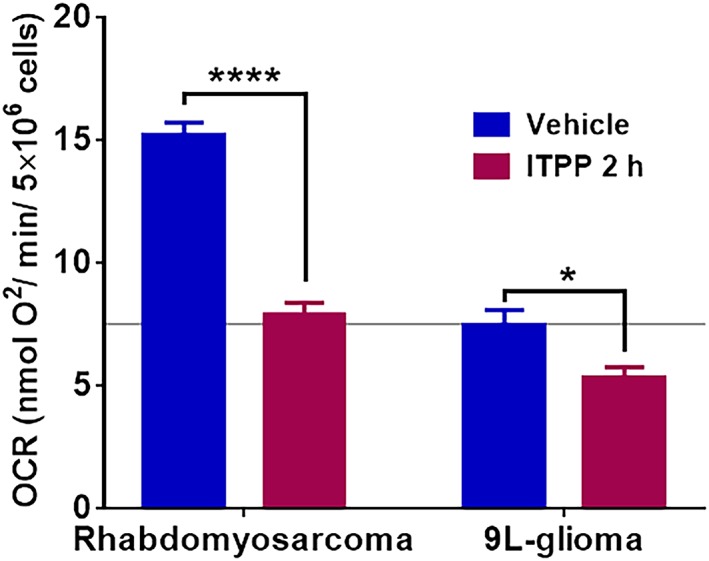
Impact of myo‐inositol trispyrophosphate (ITPP) on in vitro oxygen consumption rate (OCR) in rhabdomyosarcoma cell line (vehicle N = 6; ITPP N = 6) and in 9 L‐glioma cell line (vehicle N = 8; ITPP N = 6) obtained by X‐band electron paramagnetic resonance (EPR) oximetry. ITPP significantly decreased the OCR in both tumor cell lines (mean ± SEM) *p<0.05, ****p>0.0001
4. DISCUSSION
In a previous study, we highlighted the added value of combining R1 and R2* MRI biomarkers to map changes in tumor oxygenation induced by a hyperoxic breathing challenge.14 R1 and R2* were successfully integrated in a single map to visualize four different types of voxels corresponding to different hypoxic tumor regions.14 In the current study, we further validated the value of the combined R1 and R2* MR oxygen‐dependent parameters for assessing changes in tumor oxygenation induced by a pharmacological oxygen modifier agent, ITPP, which is described as right‐shifting the dissociation curve of Hb‐O2 towards higher pO2 values.30
All oxygen‐sensitive MR parameters (R1G, R1W, R1L and R2*) increased after ITPP administration (Figures 2 and 3). The result at the inter‐tumoral level was confirmed at the intra‐tumoral level (Figure 5), as the majority of tumors in both models presented a higher proportion of voxels with ITPP‐induced ΔR1 > 0 or ΔR2* > 0. We also found that R1L and R1W did not show any superiority to R1G in terms of sensitivity to the change in tumor oxygenation induced by ITPP. We even observed a higher fractional increase in R1W (~ 8%) than in R1L (~ 3.5%) after ITPP administration in both tumor models. A possible explanation for this may lie in the method used to extract the R1L and R1W values from R1G. The bi‐exponential method is a model that attributes the fast and slow components to lipid and water proton relaxation rates, respectively. However, this approximation cannot exclude the potential contribution to the fast component of the relaxation of water linked to macromolecules. Thus, the fast component does not exclusively reflect lipid relaxation. However, the observation is consistent with that obtained in previous studies using a hyperoxic breathing challenge (carbogen).14, 15 It should also be noted that, despite the higher fractional increase observed in R1W than in R1L, the absolute change in R1 was higher in R1L than in R1W (approximately 0.07 and 0.12 for R1W and R1L, respectively).
Recently, R1 has attracted more and more attention as a tool for estimating tumor oxygenation, as it is directly sensitive to dissolved O2 concentration. An increase in R1 is generally observed in tumors under hyperoxic challenge.11, 13, 15, 31 O'Connor et al have validated the mapping of spatial variation of hypoxia based on the different response of R1 to oxygen breathing.12 Because R1 is sensitive to the oxygen molecules dissolved in plasma and tissue fluid, the increase in R1 corresponds to an increase in dissolved oxygen in tumor tissue. With respect to changes in oxygenation, two mechanisms may be involved in the modification of tumor oxygenation: an increase in the O2 supply and a decrease in the OCR of tumor cells. While an increase in O2 supply by right‐shifting the ODC of ITPP was previously shown,19, 20, 21 we have demonstrated here that ITPP was also able to induce a significant reduction of OCR in vitro, in both tumor cell lines studied. Previously, evidence showed that ITPP was able to inhibit the PI3K pathway.22 This mechanism could explain the decrease in OCR induced by ITPP.32, 33 The effect of ITPP in reducing cell OCR was compared with an inhibitor of PI3K, LY294002.29 Both ITPP and LY294002 reduced OCR of 9 L‐glioma and rhabdomyosarcoma cell lines with the same timing.29 Interestingly, the fraction of tumor with ∆R1 > 0 is highly variable, ranging from less than 50% to almost 100%. Two factors may contribute to this intra‐tumor heterogeneity of R1 response. First, the distribution of ITPP relies on the tumor vascular system. The chaotic, disorganized structure of tumor vessels may hinder the accessibility of the compound to regions where the blood supply is reduced. Consequently, a tumor's heterogeneous vessel architecture determines drug uptake in its different regions. Second, the magnitude of response to ITPP depends on the tissue's oxygenation at baseline.
An increase in R2* is the result of an increase in the paramagnetic Hb concentration per tissue volume. The ability of ITPP to change the Hb saturation was assessed in vivo on venous blood in healthy rats. In addition, ITPP also slightly but significantly increased blood acidity. Both factors therefore contributed to a right‐shift of ODC towards a higher O2 release from the blood and an increase in the total dHb content according to the Bohr effect. We also compared the perfusion in treated and untreated tumors to evaluate whether ITPP could induce an acute effect on tumor perfusion, which in turn could modify the tumor blood volume and dHb content. Our study did not show any significant change in tumor perfusion after ITPP administration. It should be noted that Kieda et al22 found that long‐term ITPP treatment in melanoma and in breast cancer syngeneic models was able to normalize tumor vessels through the acquisition of a matured phenotype in endothelial cells and the reorganization of the tumor vessels. However, this effect did not occur soon (2 hours) after ITPP administration in our study (Figure 7).
In this study, the field strength of the MRI was 11.7 T, which is much stronger than the 1.5 and 3 T MR clinical systems used in clinical practice. In the study of Blockley et al,33 the authors measured R2* versus Hb concentration at 1.5, 3 and 7 T. They demonstrated that the transverse relaxivity (R2*) of whole blood as a function of dHb concentration (in s−1mM−1) increased as the magnetic field strength increased. We can speculate that the R2* measured in this study at a high field strength is more sensitive to the change in dHb content than the measurements reported at a lower field strength.
Finally, with respect to R2* measurement, we used a low flip angle (10°) to minimize any potential “in‐flow” effect,34 as the signal created by the water blood flowing into the imaging slice is much stronger than the static water at high flip angles (30°‐90°) because the spin of the static water is partially saturated by previous pulses.
While R2* is generally assumed to decrease in response to a hyperoxic challenge, because the breathing of high oxygen content gas (carbogen or 100% oxygen) increases the hemoglobin saturation of blood and therefore decreases the R2* signal, we have shown here that the direction of change in R2* depends on the mechanism of action of the oxygen modifier under study. When a pharmacological agent is used that is able to modify Hb saturation and oxygen consumption, an increase in R2* is observed. This is similar to observations made using inhibitors of oxygen consumption.35 Moreover, in a previous study, we showed that the change in R2* is influenced not only by tumor pO2 but also by the degree of Hb saturation at baseline.14 This has also been proved at the intra‐tumoral level in a study by Little et al.36
Interestingly, we observed that the better‐oxygenated tumor model 9 L‐glioma showed a higher increase in pO2 after ITPP administration compared with the rhabdomyosarcoma model (Figure 1), as the right‐shift of the ODC will only be beneficial to tissues within a certain range of pO2 (“middle range”, ie, 40–80 mmHg) and ITPP will barely affect SO2 values in tissues presenting extreme pO2 values (very high or very low). Accordingly, at the intra‐tumoral level, we observed a general higher fraction of voxels with ∆R1 > 0 in 9 L‐gliomas than in rhabdomyosarcomas (Figure 4). Yet we also noticed that ITPP induced a higher fraction of voxels presenting a ∆R2* > 0 in rhabdomyosarcomas (Figure 4).
This raises the question as to whether R2* could be used to monitor the change in tumor pO2 induced by an allosteric effector of Hb. In two studies using a different allosteric effector of Hb, RSR13, similar changes in R2* were not observed. In the study of Kelly et al,32 RSR13 induced an increase in BOLD signal intensity (meaning a decrease in R2*) in NCI‐H460 human lung carcinoma xenograft. By contrast, in the work of Hou et al,39 RSR13 had scarcely any effect on the R2* signal in RIF‐1 tumors. It should be noted that both ITPP and RSR13 significantly enhanced tumor pO2 in the models under study.27, 32 Figure 9 presents a model that may explain the complexity in R2* signal changes. R2* is sensitive to the change in [dHb]. In the three situations illustrated, (A), (B) and (C), the allosteric effector significantly increases tumor pO2. Yet the changes in [dHb] do not follow the change in pO2, as Hb saturation can increase, decrease or remain stable. Thus R2* is not suitable for monitoring the change in pO2 in response to allosteric modifiers of Hb: if the allosteric effector does not induce any change in tumor blood flow or blood volume, but only induces change in the ODC, the saturation of hemoglobin should be determined by the new corresponding pO2 value (Figure 9) on the new ODC. Note that the equilibrium of pO2 after treatment depends on many factors, including tumor type and the impact of the drug on the metabolic rate or on the oxygen consumption rate of tumor cells. The mechanism of OCR modulators can be complex and usually includes the change in tumor perfusion or in tumor metabolic activity.35, 37 These factors are unrelated to the real change in tumor pO2 and can modify the R2* signal, hindering interpretation of the results. In brief, caution should be exercised when interpreting R2* as the marker reflects the concentration of dHb per volume, but not oxygenation per se.
Figure 9.
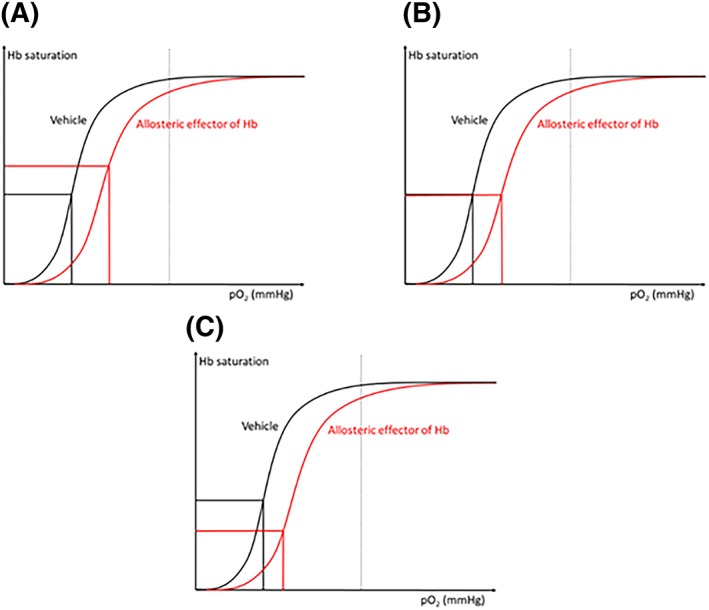
The complexity of R2* under the effect of an allosteric effector of hemoglobin. Note that if there is no change in the blood flow or blood volume, an increase in the degree of hemoglobin saturation (which means a decrease in the proportion of dHb) leads to a decrease in R2* and vice versa. (A), (B) and (C) illustrate three possibilities of R2* if the allosteric effector induces a shift in the oxygen dissociation curve (ODC) and an enhancement in tumor pO2. The change in R2* depends on the degree of Hb saturation but not on the real tumor pO2
In the study of Fylaktakidou et al,20 ITPP was found to be a powerful allosteric effector of Hb. The incubation of ITPP with the human whole blood sample showed that the compound was able to increase the P50 of the blood by up to 40% (P50 = partial pressure of oxygen under which 50% of Hb is saturated with O2). The ability of ITPP to induce the P50‐shift in a sample of human blood was dose‐dependent and reached a maximum at a concentration of 60mM. At a dose of 30mM, ITPP induced a 36% P50‐shift and the Hill coefficient went from 2.4 to 1.6. Interestingly, ITPP appears to induce a stronger effect on P50‐shift in murine blood samples than in human blood samples: at 4mM, ITPP induced a 30% P50‐shift in a murine blood sample versus a less than 3% P50‐shift in a human blood sample. These in vitro findings could explain the large decrease in hemoglobin saturation that we observed in this study (Figure 6).
It should be noted that, despite the significant improvement in tumor pO2 in both tumor models, 9 L‐glioma and rhabdomyosarcoma, ITPP in monotherapy or combined with radiation therapy did not improve the treatment outcome in the tumor models under study.29 Besides tumor oxygenation, other factors can contribute to the radiosensitivity of cancer cells, such as the ability to repair DNA damage and cancer cell repopulation following irradiation. In particular, the findings showed that ITPP may be involved in the PI3K pathway, which is a key regulator of various cellular functions, from cell proliferation to cell survival, and is implicated in all major mechanisms of radioresistance.
In conclusion, ITPP was able to increase tumor pO2 in a rhabdomyosarcoma and a 9 L‐glioma model. The value of the MRI biomarkers R1 and R2* was increased by ITPP treatment. The interpretation of the results needs to take into account that R1 and R2* can be biased by multiple factors, unrelated to changes in pO2. In this study, we identified that the acute effect of ITPP on tumor pO2 was the result of a combination of right‐shifting of the ODC, a decrease in pH and a decrease in OCR. In addition, we concluded that R2* is not suitable to monitor change in tumor pO2 induced by an allosteric effector of Hb.
ACKNOWLEDGEMENTS
This study was supported by grants from the Belgian National Fund for Scientific Research (FNRS) and the Fournier‐Majoie Foundation. BFJ is Senior Research Associate of the FNRS.
Cao‐Pham T‐T, Tran‐Ly‐Binh A, Heyerick A, et al. Combined endogenous MR biomarkers to assess changes in tumor oxygenation induced by an allosteric effector of hemoglobin. NMR in Biomedicine. 2020;33:e4181 10.1002/nbm.4181
REFERENCES
- 1. Vaupel P, Mayer A. Tumor Hypoxia: Causative Mechanisms, Microregional Heterogeneities, and the Role of Tissue‐Based Hypoxia Markers In: Luo Q, Li LZ, Harrison DK, Shi H, Bruley DF, eds. Oxygen Transport to Tissue XXXVIII. Vol. 923 Cham: Springer International Publishing; 2016:77‐86. [DOI] [PubMed] [Google Scholar]
- 2. Overgaard J. Hypoxic radiosensitization: adored and ignored. J Clin Oncol. 2007;25:4066‐4074. [DOI] [PubMed] [Google Scholar]
- 3. Jordan BF, Cron GO, Gallez B. Rapid monitoring of oxygenation by 19F magnetic resonance imaging: Simultaneous comparison with fluorescence quenching. Magn Reson Med. 2009;61:634‐638. [DOI] [PubMed] [Google Scholar]
- 4. Gallez B, Baudelet C, Jordan BF. Assessment of tumor oxygenation by electron paramagnetic resonance: principles and applications. NMR Biomed. 2004;17:240‐262. [DOI] [PubMed] [Google Scholar]
- 5. Kodibagkar VD, Wang X, Pacheco‐Torres J, Gulaka P, Mason RP. Proton imaging of siloxanes to map tissue oxygenation levels (PISTOL): a tool for quantitative tissue oximetry. NMR Biomed. 2008;21:899‐907. [DOI] [PMC free article] [PubMed] [Google Scholar]
- 6. Tran L‐B‐A, Bol A, Labar D, et al. Hypoxia imaging with the nitroimidazole 18F‐FAZA PET tracer: A comparison with OxyLite, EPR oximetry and 19F‐MRI relaxometry. Radiother Oncol. 2012;105:29‐35. [DOI] [PubMed] [Google Scholar]
- 7. Wolf G, Abolmaali N. Preclinical molecular imaging using PET and MRI. Recent Results Cancer Res. 2013;187:257‐310. [DOI] [PubMed] [Google Scholar]
- 8. Dewhirst MW, Klitzman B, Braun RD, Brizel DM, Haroon ZA, Secomb TW. Review of methods used to study oxygen transport at the microcirculatory level. Int J Cancer. 2000;90:237‐255. [PubMed] [Google Scholar]
- 9. Gu Y, Bourke VA, Kim JG, Constantinescu A, Mason RP, Liu H. Dynamic response of breast tumor oxygenation to hyperoxic respiratory challenge monitored with three oxygen‐sensitive parameters. Appl Optics. 2003;42:2960‐2967. [DOI] [PubMed] [Google Scholar]
- 10. O'Connor JPB, Robinson SP, Waterton JC, Imaging tumour hypoxia with oxygen‐enhanced MRI and BOLD MRI. Br J Radiol. 2019. Mar;92(1095):20180642. 10.1259/bjr.20180642 Epub 2019 Jan 24. [DOI] [PMC free article] [PubMed] [Google Scholar]
- 11. O'Connor JPB, Naish JH, Jackson A, et al. Comparison of normal tissue R1 and R2* modulation by oxygen and carbogen. Magn Reson Med. 2009;61:75‐83. [DOI] [PubMed] [Google Scholar]
- 12. Burrell JS, Walker‐Samuel S, Baker LCJ, et al. Exploring ΔR2* and ΔR1 as imaging biomarkers of tumor oxygenation. J Magn Reson Imaging. 2013;38:429‐434. [DOI] [PubMed] [Google Scholar]
- 13. O'Connor JPB, Boult JKR, Jamin Y, et al. Oxygen‐enhanced MRI accurately identifies, quantifies, and maps tumor hypoxia in preclinical cancer models. Cancer Res. 2016;76:787‐795. [DOI] [PMC free article] [PubMed] [Google Scholar]
- 14. Hallac RR, Zhou H, Pidikiti R, et al. Correlations of noninvasive BOLD and TOLD MRI with pO2 and relevance to tumor radiation response. Magn Reson Med. 2014;71:1863‐1873. [DOI] [PMC free article] [PubMed] [Google Scholar]
- 15. Cao‐Pham T‐T, Joudiou N, Van Hul M, et al. Combined endogenous MR biomarkers to predict basal tumor oxygenation and response to hyperoxic challenge. NMR Biomed. 2017;30(12). 10.1002/nbm.3836 [DOI] [PubMed] [Google Scholar]
- 16. Cao‐Pham T‐T, Tran L‐B‐A, Colliez F, et al. Monitoring tumor response to carbogen breathing by oxygen‐sensitive magnetic resonance parameters to predict the outcome of radiation therapy: a preclinical study. Int J Radiat Oncol Biol Phys. 2016;96:149‐160. [DOI] [PubMed] [Google Scholar]
- 17. Jordan BF, Magat J, Colliez F, et al. Mapping of oxygen by imaging lipids relaxation enhancement: a potential sensitive endogenous MRI contrast to map variations in tissue oxygenation. Magn Reson Med. 2013;70:732‐744. [DOI] [PubMed] [Google Scholar]
- 18. Suh JH. Efaproxiral: a novel radiation sensitizer. Expert Opin Investig Drugs. 2004;13:543‐550. [DOI] [PubMed] [Google Scholar]
- 19. Suh JH, Stea B, Tankel K, et al. Results of the phase III ENRICH (RT‐016) study of Efaproxiral administered concurrent with whole brain radiation therapy (WBRT) in women with brain metastases from breast cancer. Int J Radiat Oncol Biol Phys. 2008;72:S50‐S51. [Google Scholar]
- 20. Limani P, Linecker M, Kron P. Development of OXY111A, a novel hypoxia‐modifier as a potential antitumor agent in patients with hepato‐pancreato‐biliary neoplasms ‐ protocol of a first Ib/IIa clinical trial. BMC Cancer. 2016;16:812–818. [DOI] [PMC free article] [PubMed] [Google Scholar]
- 21. Fylaktakidou KC, Lehn J‐M, Greferath R, Nicolau C. Inositol tripyrophosphate: a new membrane permeant allosteric effector of haemoglobin. Bioorg Med Chem Lett. 2005;15:1605‐1608. [DOI] [PubMed] [Google Scholar]
- 22. Duarte CD, Greferath R, Nicolau C, Lehn J‐M. Myo‐inositol trispyrophosphate: a novel allosteric effector of hemoglobin with high permeation selectivity across the red blood cell plasma membrane. Chembiochem. 2010;11:2543‐2548. [DOI] [PubMed] [Google Scholar]
- 23. Kieda C, Hafny‐Rahbi BE, Collet G, et al. Stable tumor vessel normalization with pO2 increase and endothelial PTEN activation by inositol trispyrophosphate brings novel tumor treatment. J Mol Med. 2013;91:883‐899. [DOI] [PMC free article] [PubMed] [Google Scholar]
- 24. Raykov Z, Grekova SP, Bour G, et al. Myo‐inositol trispyrophosphate‐mediated hypoxia reversion controls pancreatic cancer in rodents and enhances gemcitabine efficacy. Int J Cancer. 2014;134:2572‐2582. [DOI] [PubMed] [Google Scholar]
- 25. Aprahamian M, Bour G, Akladios CY, et al. Myo‐InositolTrisPyroPhosphate treatment leads to HIF‐1α suppression and eradication of early hepatoma tumors in rats. Chembiochem. 2011;12:777‐783. [DOI] [PubMed] [Google Scholar]
- 26. Jordan BF, Baudelet C, Gallez B. Carbon‐centered radicals as oxygen sensors for in vivo electron paramagnetic resonance: screening for an optimal probe among commercially available charcoals. MAGMA. 1998;7(2):121‐129. [DOI] [PubMed] [Google Scholar]
- 27. Crokart N, Jordan BF, Baudelet C, et al. Glucocorticoids modulate tumor radiation response through a decrease in tumor oxygen consumption. Clin Cancer Res. 2007;13:630‐635. [DOI] [PubMed] [Google Scholar]
- 28. Ansiaux R, Baudelet C, Jordan BF, et al. Mechanism of reoxygenation after antiangiogenic therapy using SU5416 and its importance for guiding combined antitumor therapy. Cancer Res. 2006;66:9698‐9704. [DOI] [PubMed] [Google Scholar]
- 29. Jordan BF, Grégoire V, Demeure RJ, et al. Insulin increases the sensitivity of tumors to irradiation: involvement of an increase in tumor oxygenation mediated by a nitric oxide‐dependent decrease of the tumor cells oxygen consumption. Cancer Res. 2002;62:3555‐3561. [PubMed] [Google Scholar]
- 30. Tran LBA, Cao‐Pham TT, Jordan BF, Deschoemaeker S, Heyerick A, Gallez B. Impact of myo‐inositol trispyrophosphate (ITPP) on tumour oxygenation and response to irradiation in rodent tumour models. J Cell Mol Med. 2019;23(3):1908–1916. [DOI] [PMC free article] [PubMed] [Google Scholar]
- 31. FöRnvik K, Zolfaghari S, Salford LG, Redebrandt HN. ITPP treatment of RG2 glioblastoma in a rat model. Anticancer Res. 2016;36:5751‐5756. [DOI] [PubMed] [Google Scholar]
- 32. Kelly CJ, Hussien K, Fokas E, et al. Regulation of O2 consumption by the PI3K and mTOR pathways contributes to tumor hypoxia. Radiother Oncol. 2014;111:72‐80. [DOI] [PMC free article] [PubMed] [Google Scholar]
- 33. Li C, Li Y, He L, et al. PI3K/AKT signaling regulates bioenergetics in immortalized hepatocytes. Free Radic Biol Med. 2013;60:29‐40. [DOI] [PMC free article] [PubMed] [Google Scholar]
- 34. Blockley NP, Jiang L, Gardener AG, Ludman CN, Francis ST, Gowland PA. Field strength dependence of R1 and R2* relaxivities of human whole blood to prohance, vasovist, and deoxyhemoglobin. Magn Reson Med. 2008;60:1313‐1320. [DOI] [PubMed] [Google Scholar]
- 35. Howe FA, Robinson SP, Rodrigues LM, Griffiths JR. Flow and oxygenation dependent (FLOOD) contrast MR imaging to monitor the response of rat tumors to carbogen breathing. Magn Reson Imaging. 1999;17:1307‐1318. [DOI] [PubMed] [Google Scholar]
- 36. Jordan BF, Crokart N, Baudelet C, Cron GO, Ansiaux R, Gallez B. Complex relationship between changes in oxygenation status and changes in R*2: the case of insulin and NS‐398, two inhibitors of oxygen consumption. Magn Reson Med. 2006;56:637‐643. [DOI] [PubMed] [Google Scholar]
- 37. Little RA, Jamin Y, Boult JKR, et al. Mapping hypoxia in renal carcinoma with oxygen‐enhanced MRI: comparison with intrinsic susceptibility MRI and pathology. Radiology. 2018;288:739‐747. [DOI] [PMC free article] [PubMed] [Google Scholar]
- 38. Jordan BF, Misson P, Demeure R, Baudelet C, Beghein N, Gallez B. Changes in tumor oxygenation/perfusion induced by the NO donor, isosorbide dinitrate, in comparison with carbogen: monitoring by EPR and MRI. Int J Radiat Oncol Biol Phys. 2000;48:565‐570. [DOI] [PubMed] [Google Scholar]
- 39. Hou H, Khan N, O'Hara JA, et al. Effect of RSR13, an allosteric hemoglobin modifier, on oxygenation in murine tumors: an in vivo electron paramagnetic resonance oximetry and BOLD MRI study. Int J Radiat Oncol Biol Phys. 2004;59:834‐843. [DOI] [PubMed] [Google Scholar]


