

Abstract
We evaluated the pharmacokinetics and pharmacodynamics of oral insulin tregopil in relation to premeal dosing time, between‐meal interval, and meal composition type in type 2 diabetes mellitus patients in a randomized, placebo‐controlled, crossover study consisting of 3 sequential cohorts. In Cohort 1, insulin tregopil administered 10 to 20 minutes before a meal resulted in optimal postmeal exposure and demonstrated better postprandial glucose‐lowering effect (glucose area under concentration‐time curve [AUC]) compared to the 30‐minute group. In Cohort 2, insulin tregopil pharmacokinetic exposure (plasma AUC) showed a progressive increase through 4, 5, and 6 hours of between‐meal interval. The 6‐hour between‐meal interval resulted in better absorption of insulin tregopil in comparison to 4‐ and 5‐hour intervals. However, no significant differences were observed in pharmacodynamic parameters except for higher glucose AUC0‐180min in the insulin tregopil 4‐hour group during the afternoon meal as compared to the morning meal. In Cohort 3, a high‐fiber meal had the least impact on insulin tregopil absorption and resulted in the highest reduction in plasma glucose levels in the afternoon. A high‐fat meal reduced insulin tregopil absorption in the afternoon meal; however, pharmacodynamic response was not diminished significantly. Insulin tregopil has a rapid onset of action of approximately 10 minutes and, when administered 10 to 20 minutes before a meal, demonstrated up to 13% to 18% reduction in blood glucose levels compared to baseline. A 5‐hour between‐meal interval minimizes the impact of a meal on absorption of subsequent (afternoon) insulin tregopil dose, and the pharmacodynamic response of insulin tregopil is not altered by meal composition. Insulin tregopil was well tolerated in patients with type 2 diabetes mellitus.
Keywords: food intake, insulin delivery, oral insulin, postprandial, rapid‐acting insulin, type 2 diabetes mellitus
Type 2 diabetes mellitus (T2DM) is a complex metabolic disorder characterized by progressive beta‐cell failure and increasing difficulty in maintaining glycemic control.1 Studies have shown that the acute phase of insulin secretion is lost, and the second phase gets blunted in early stages of T2DM.2, 3 In healthy individuals, immediate secretion of endogenous insulin in response to glucose surge in the first 2 hours of meal ingestion leads to inhibition of hepatic glucose production, which is important for postprandial glucose control.4 Therapeutic approaches that aim to restore the physiological pattern of insulin secretion can be effective in reducing postprandial glucose excursions in patients with T2DM.
Insulin administered subcutaneously is absorbed nonphysiologically into the systemic circulation with a consequent risk of peripheral hyperinsulinemia, hypoglycemia, and weight gain.5 Contrarily, oral insulin, similar to the endogenous insulin secretion, results in higher hepatic insulin levels as it traverses through the portal circulation.6 The portal delivery of oral insulins is expected to provide several clinical advantages compared to the parenteral route of administration, such as (1) lower incidence of hypoglycemia (including nocturnal hypoglycemia)7; (2) lower peripheral hyperinsulinemia7; (3) normalization of metabolic effects—for example, maintaining weight7, 8; and (4) improvement in patient‐related outcomes like quality of life (eg, less pain/discomfort, mobility, ease of self‐care)9 and likely improvement in the medication compliance.
Insulin tregopil (IN‐105), a PEGylated recombinant human insulin with 100% sequence identity to human insulin, is currently in development for oral delivery in the treatment of diabetes mellitus.8 It contains a single methoxy‐triethylene‐glycol‐propionyl unit attached to the Lys‐β29‐amino group of human insulin via an amide linkage.8 Insulin tregopil is found to be safe and pharmacodynamically active in healthy volunteers10 as well as in patients with T2DM.8 Insulin tregopil, with its rapid onset of action (within 30 minutes after dosing),8 may restore the first phase of insulin release deficiency in patients with T2DM, with a possible resultant beta‐cell–sparing effect. Additionally, the short duration of action of insulin tregopil may reduce the risk of postprandial hypoglycemia.
This 3‐cohort study evaluated the pharmacokinetic (PK) and pharmacodynamic (PD) parameters of orally administered insulin tregopil in patients with T2DM. In practice, the prandial insulin effect for tight targeted glycemic control is variable and depends on multiple factors like premeal dosing time, meal composition, and gastric emptying time.11 The purpose of Cohort 1 was to establish the optimal premeal dosing time of insulin tregopil. Normal between‐meal interval in a day ranges from 4 to 6 hours or more, and patients with long term T2DM are known to have a delayed gastric emptying time (due to gastroparesis).12 The intensity of meal‐drug interactions may be influenced by the time interval between meal and drug administration. The purpose of Cohort 2 was to study the effect of mealtime interval on PK/PD of insulin tregopil. It is observed that different types of diets can have varied impact on PK/PD of administered oral insulins. A high‐fat meal was observed to slow the gastric emptying when administered directly into the small intestine, resulting in attenuated blood glucose and insulin responses.13, 14 On the other hand, a high‐fiber diet has an insulin‐sensitizing effect in insulin‐resistant subjects.15, 16 Improved insulin sensitivity in nonobese individuals with diabetes15 was observed with increased dietary fiber over a period of several weeks, while this had no effect in obese individuals with diabetes.16 The purpose of Cohort 3 was to determine the impact of high‐fat and high‐fiber diets with fixed caloric and glycemic index (meal composition) on the PK/PD of insulin tregopil.
Methods
This phase I, randomized, open‐label, placebo‐controlled, crossover trial was conducted in patients with T2DM at a single center (Elite Research Institute, Miami, Florida) in the United States.
Eligible patients included men or women aged 18 to 65 years (inclusive) with hemoglobin A1c ≤9.5%, fasting plasma glucose <140 mg/dL at screening, a stable weight (≤5 kg gain/loss in the past 3 months), and body mass index between 18.5 and 40.0 kg/m2 (inclusive); with established T2DM for at least 1 year and on metformin treatment for at least a month.
Key exclusion criteria were presence of pregnancy, history of hypersensitivity to insulin or its analogue, impaired hepatic function, diabetic complications, diabetic foot ulcers within a year, ≥1 episodes of hyperglycemic hyperosmolar state or emergency room visits for uncontrolled diabetes leading to hospitalization in the 6 months before screening, and ≥2 episodes of severe hypoglycemia within 6 months before screening, as well as use of oral antidiabetic drugs other than metformin for the past 3 months; use of specified prescription drugs known to impact hepatic glucose metabolism within the 4 weeks before screening; and any surgical or medical condition that could significantly alter the absorption, distribution, metabolism, or excretion of drugs.
The study was designed, implemented, and reported in accordance with the Good Clinical Practice Guideline of the International Conference on Harmonization (document E6), with applicable local regulations and ethical principles laid down in the Declaration of Helsinki. An independent ethics committee (IntegReview Ethical Review Board, Austin, Texas) reviewed and approved the protocol and applicable amendments, patient recruitment procedures, and other required documents before study initiation. All subjects provided documented written informed consent and Health Insurance Portability and Accountability Act authorization before enrollment in the study.
Study Objectives
Primary objectives of the study were (1) to establish the optimal premeal dosing time for insulin tregopil administration based on PK and PD (Cohort 1); (2) to establish the optimal between‐meal interval based on PK and PD (Cohort 2); and (3) to establish the effect of meal composition on insulin tregopil PK and PD (Cohort 3). The secondary objective was to assess the safety and tolerability of insulin tregopil administered under different dosing conditions.
Study Design and Treatments
All patients received insulin tregopil 30 mg (2 × 15 mg tablets; 240 mL water) or its matching placebo. All formulations of metformin that patients were taking before study participation were replaced with metformin XR (dose was determined by the investigator based on prior metformin dose) at least 1 day before study drug dosing. Patients were on a once‐daily metformin XR formulation every night to avoid any potential drug interaction until study completion. Total duration of the study was approximately 10 weeks for Cohort 1 and 11 weeks for both Cohort 2 and Cohort 3. Patients from one cohort were eligible to participate in the subsequent cohort if they satisfied the selection criteria. Following the first cohort, planning of the successive cohort was modified on the basis of the preceding cohort data.
Cohort 1 had a partial replicate crossover design (5 periods/4 treatments [2 weeks: single‐dosing days separated by 1‐2 days of washout period]/5 sequences; Figure S1). Insulin tregopil was administered 30, 20, and 10 minutes before an American Diabetes Association (ADA) recommended diet meal, and placebo was administered 20 minutes before an ADA meal. Placebo was administered twice to each patient to estimate interday PD variability more accurately.
Cohort 2 had a crossover design (6 periods/6 treatments [3 weeks: single‐dosing days separated by 1‐2 days of washout period]/6 sequences; Figure S1). Patients were provided 2 ADA meals with either insulin tregopil or placebo administered at the premeal dosing time selected from Cohort 1. Timing between the meals was maintained at 4, 5, or 6 hours depending on the treatment schedule of each patient.
Cohort 3 had a crossover design (6 periods/6 treatments [3 weeks: single‐dosing days separated by 1‐2 days of washout period]/6 sequences; Figure S1). At the selected premeal dosing time (determined from Cohort 1), the patients were administered either insulin tregopil or placebo and were provided 2 sets of meals with an optimal between‐meal‐interval time (determined from Cohort 2). Morning meal was an ADA/high‐fat/high‐fiber composition meal while the second (afternoon) was an ADA meal.
All meals provided in Cohorts 1, 2, and 3 were consumed within 30 minutes.
Assessments
The following PK parameters were evaluated: observed maximum plasma insulin tregopil concentration following drug administration (Cmax), area under the plasma insulin tregopil concentration time curve up to 180 minutes (AUC0‐180min) and time required to achieve maximum plasma insulin tregopil concentration (tmax). PD parameters included glucose AUC0‐180min, minimum glucose concentration (glucose Cmin) and time to minimum glucose concentration (tmin). Safety assessments included physical examinations, electrocardiogram, vital signs, clinical laboratory evaluations, and treatment‐emergent adverse event (TEAE) and serious adverse event monitoring.
Bioanalytical Methods and Sampling Details
Cohort 1: Blood samples (2.5 mL whole blood for PK analysis and 1.5 mL whole blood for PD analysis) were obtained at 30, 20, and 10 minutes before the start of the meal, and then at 0 hour (start of meal) and at the following time points after insulin tregopil or placebo administration: 10, 20, 30, 40, 50, 60, 90, 120, and 180 minutes after the meal.
Cohorts 2 and 3: Blood samples (2.5 mL whole blood for PK analysis and 1.5 mL whole blood for PD analysis) were obtained at 0 hour (before dosing at dosing time), and then at the following time points after insulin tregopil or placebo administration: 10, 20, 30, 40, 50, 60, 90, 120, and 180 minutes after dosing.
PK samples were analyzed using a validated liquid chromatography–tandem mass spectrometry (LC‐MS/MS) method with appropriate controls. The LC‐MS/MS quantitation was performed in Xevo TQ‐S triple quadrupole mass spectrometer (Waters Corporation, Milford, Massachusetts). The mass spectrometer source was set up in positive polarity mode with the following parameters: capillary voltage, 3 Kv; cone gas, 300 (L/hr); desolvation gas, 1000 (L/hr); collision gas, 0.2 (mL/min); desolvation temperature, 500°C; source temperature, 150°C. The compound parameters were kept similar for both insulin tregopil and its internal standard, with cone voltage 70 V and collision energy 35 V. The (M+H)4+ ions were monitored for parent masses of both analyte insulin tregopil and the labeled internal standard. The mass transitions monitored for the analyte and the internal standard were 1506.9/1822 m/z and 1520/1838.5 m/z, respectively. The chromatography was performed using Xbridge C4 column (Waters Corporation). The high‐performance liquid chromatography was operated in gradient mode with a mobile phase of 0.02% TFA in MeCN‐H2O (10:90) as solvent A and 0.02% trifluoroacetic acid in MeCN‐H2O (90:10) as solvent B. The plasma samples from the PK study were subjected to offline solid phase extraction (SPE) followed by online SPE using 96‐well Oasis MCX SPE plates (Waters Corporation), before injecting into LC‐MS/MS for quantitation of insulin tregopil. The stable labeled [15N] insulin tregopil was used as the internal standard. The method was precise and accurate, with a sensitivity of 0.2 ng. The mean intrarun and interrun precision was 11.1% and 8.9%, respectively. The mean intrarun accuracy showed a percent bias ranging between 0.4% and 3.0%, whereas the interrun bias was between 0.3% and 2.0%. The commonly used method for plasma glucose analyses by Elite Research Institute is YSI 2300 STAT Plus Analyzer (YSI Life Sciences, Yellow Springs, Ohio).17
Statistical Analysis
All statistical analyses of the PK and PD parameter estimates were conducted using SAS Version 9.2 (SAS Institute, Cary, North Carolina). No statistical hypothesis was defined for the estimation of the sample size, as this was an exploratory study. A minimum of 15 patients in Cohort 1 and 18 patients each in Cohort 2 and Cohort 3 were deemed adequate for evaluation of the objectives.
The PK/PD population was defined as all randomized patients who received insulin tregopil/placebo and had evaluable data for PK/PD end points after confirming suitability. PK/PD parameters were analyzed using Phoenix WinNonlin 6.3 (Certara, Princeton, New Jersey). For all 3 cohorts, plasma concentration data for each patient and treatment were analyzed by a noncompartmental method. The AUC0‐180min was calculated by linear trapezoidal rule; concentration values below the limit of quantification were set to “zero.” The PK/PD parameters (Cmax, AUC0‐180min, glucose Cmax, and glucose AUC0‐180min) were represented using summary and descriptive statistics. Geometric mean ratios and 90% confidence intervals were calculated for PK/PD parameters from a mixed‐effects model with sequence, period, and treatment as covariates; and patient‐within‐sequence as a random effect for log‐transformed Cmax and AUC. AUC assessment comparison starting point was food administration time for PD and drug administration time for PK. For Cohort 1 PD evaluations, insulin tregopil groups were compared with the placebo group, and for PK evaluations, the 30‐minute group was compared to the 10 minute and 20 minute groups. In Cohort 2, PK and PD comparison were done between the first and second dose of insulin tregopil. In addition, placebo‐adjusted PD of insulin tregopil was compared between the insulin tregopil and placebo groups having the same meal intervals. In Cohort 3, PK comparisons were done between meals 1 and 2 in the insulin tregopil groups, and PD comparisons were done between different meals across the groups. For Cohorts 2 and 3, the necessary placebo correction was also applied for PD assessment to eliminate any diurnal effect.
Safety was evaluated in all randomized patients who received at least 1 dose of the study drug and were analyzed using descriptive statistics. Adverse events were coded using The Medical Dictionary for Regulatory Activities, version 17.0. All available safety data were collected until the end of the study.
Results
A total of 51 patients with T2DM (24 men and 27 women) between 39 and 64 years of age were enrolled. Of these, 45 (88.2%) patients were white and 6 (11.8%) patients were black.
Cohort 1 (15 patients): The mean insulin tregopil plasma concentrations as a function of the premeal time of dosing is given in Figure 1. The mean (standard deviation) ratios of AUCpostmeal to AUCpremeal were 1.13 (0.62), 2.11 (1.1.6), and 10.55 (5.57) for the 30‐, 20‐, and 10‐minute groups, respectively. Evaluation of the summary statistics of baseline‐corrected PD parameters (arithmetic mean) showed that the mean AUC0‐180min of glucose was numerically lower for the premeal dosing time of 10 minutes, followed by 20 minutes (no statistically significant difference observed; Table S1). Geometric mean ratios of baseline‐corrected plasma glucose values observed for the premeal dosing times of 10, 20, and 30 minutes compared to placebo were 86.6%, 80.0%, 106.4%, respectively, for AUC0‐180min and 87.8%, 83.0%, and 82.7%, respectively, for Cmin (Table S2). Maximal reduction in plasma glucose (difference between baseline [meal administration start time] and minimum postmeal plasma glucose concentration) was 15.7 mg/dL, 17.8 mg/dL, and 10.4 mg/dL for the 30, 20, and 10 minute groups, respectively. This peak PD effect was observed 10 to 20 minutes after the meal (approximately 36‐40 minutes after dosing) in all the groups (Figure 1, Table S1). The 2‐hour postprandial glucose (PPG) was 36%, 55%, and 77% higher than the premeal levels in the 10, 20, and 30 minute insulin tregopil groups and 55% higher in the placebo group. In the 10‐minute group, the peak PD effect was observed at 35 to 40 minutes after the meal.
Figure 1.
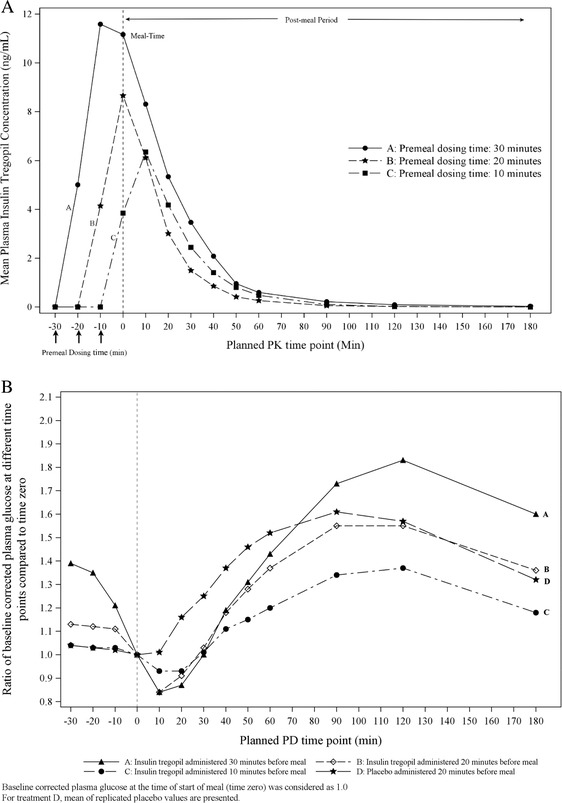
Cohort 1: (A) Peripheral plasma insulin tregopil levels when administered 10, 20, and 30 minutes before meal. (B) Baseline corrected plasma glucose concentration as ratio of postmeal glucose and baseline glucose.
Cohort 2 (18 patients): The PK parameters AUC0‐180min and Cmax in the 4‐ and 5‐hour group were significantly lower in the afternoon compared to morning meal (4 hours: 224.525 ± 302.23 min*mg/mL vs 454.61 ± 550.74 min*mg/mL and 6.76 ± 7.68 mg/mL vs 11.33 ± 9.87 mg/mL; 5 hours: 209.27 ± 186.61 min*mg/mL vs 320.60 ± 196.340 min*mg/mL and 7.139 ± 5.691 mg/mL vs 10.14 ± 5.31 mg/mL). Significant differences were not observed between the morning and afternoon meal PK parameters in the 6‐hour group (AUC0‐180min: 463.13 ± 488.44 min*mg/mL vs 344.29 ± 264.16 min*mg/mL; Cmax: 11.32 ± 8.73 mg/mL vs 11.364 ± 9.129 mg/mL). Maximum absorption was noted in the 6‐hour group (Figure 2). For plasma insulin tregopil Cmax, the intersubject variability was 124.7% and intrasubject variability was 64.7% while for plasma insulin tregopil AUC0‐180mins, the intersubject variability was 144.0% and intrasubject variability was 81.5%. In the insulin tregopil PD parameters, no significantly meaningful reduction in PD effect was observed in the afternoon vs morning meal except for higher glucose AUC0‐180min in the afternoon vs morning in the 4‐hour group (Tables S3 and S4). The intrasubject variability for the baseline‐adjusted PD response AUC0‐180mins was 9.17% and 8.41%; and Cmin was 9.16% and 11.61% for the placebo and insulin tregopil groups, respectively. Based on the practical difficulty of a long intermeal interval (6 hours) and almost similar and nonsignificantly different PD response between 5‐ and 6‐hour groups, 5 hours was selected as the intermeal interval for Cohort 3.
Figure 2.
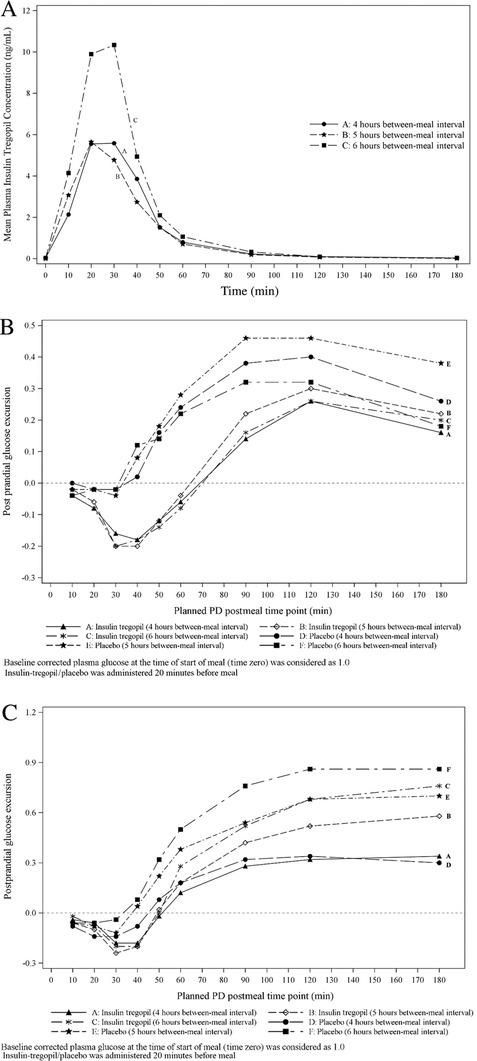
Cohort 2: (A) Mean plasma insulin tregopil concentration following the afternoon insulin tregopil administration at 4, 5, and 6 hours after the morning insulin tregopil and meal. (B) Baseline corrected postprandial glucose excursion, morning meal. (C) Baseline corrected postprandial glucose excursion, afternoon meal.
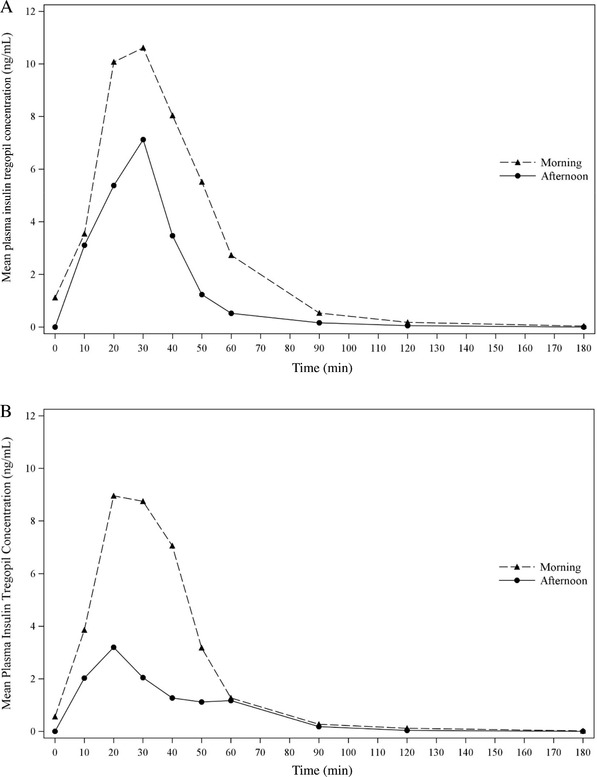
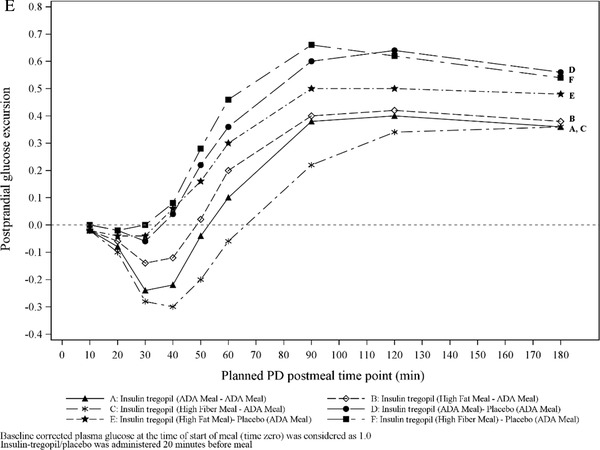
Cohort 3 (18 patients): It was observed that the morning high‐fiber meal improved insulin tregopil absorption in the afternoon (morning vs afternoon, AUC0‐180min: 86.7% vs 189.7%; Cmax: 87.9 vs 169.8%), while the morning high‐fat meal, though it lowered the peak levels, did not affect absorption of insulin tregopil in the afternoon (morning vs afternoon, AUC0‐180min: 64.7% vs 60.8%; Cmax: 64.7% vs 63.4%). The tmax of insulin tregopil was similar in all meal composition groups. A 20% to 30% drop in plasma glucose from the baseline level was observed 50 to 60 minutes after dosing (morning meal) in all the groups and 50 to 60 minutes after dosing (afternoon) in the insulin tregopil groups (Figure 3). Insulin tregopil (administered before the afternoon meal) showed a better glucose‐lowering response than placebo. The greatest reduction in plasma glucose levels (approximately 60 minutes after dosing; afternoon meal) was seen in the high‐fiber meal–ADA meal group (Figure 3). The different types of diet did not show any significant impact on the PD parameters AUC0‐180mins and Cmin (Tables S5 and S6) compared to the ADA meal in the morning or afternoon.
Figure 3.
Cohort 3: (A) Mean insulin tregopil plasma concentrations over time for ADA meal–ADA meal. (B) Mean insulin tregopil plasma concentrations over time for high‐fat meal–ADA meal. (C) Mean insulin tregopil plasma concentrations over time for high‐fiber meal–ADA meal. (D) Baseline corrected postprandial glucose excursion, morning meal. Cohort 3: (E) Baseline corrected postprandial glucose excursion, afternoon meal.
Safety Results
Of the total 51 patients exposed to insulin tregopil, 25 patients (Cohort 1: 6, Cohort 2: 6, and Cohort 3: 13) reported 66 TEAEs (Cohort 1: 10, Cohort 2: 13, and Cohort 3: 43). The majority (84.8%) of TEAEs were mild in severity. There were no patient discontinuations from the study due to AEs. No other clinically significant abnormal findings were observed for the other laboratory parameters, physical examination, vital signs, or electrocardiogram. Lowering of hematocrit and hemoglobin values at the end of the study was observed, which was not considered clinically significant.
Hypoglycemia
There were 43 events of hypoglycemia in 15 patients (Cohort 1: 3, Cohort 2: 3, and Cohort 3: 9); 41 hypoglycemia events were related to metformin, insulin tregopil, or both. All mild hypoglycemic events were asymptomatic and detected by glucose measurements. The majority of hypoglycemic events were mild in severity (did not interfere with patient's usual daily activities, 83.7%). Of the 43 events, 41 hypoglycemic events occurred within 2 hours of insulin tregopil administration and 2 events occurred closer to 6 and 46 hours after insulin tregopil administration. There were no discontinuations due to hypoglycemia.
In Cohort 1, there were 4 events of hypoglycemia (3 events in the 30 minute premeal dosing time group and 1 in the 20 minute group). In Cohort 2, there were 5 events of hypoglycemia (4‐hour: 1; 5‐hour: 2; and 6‐hour: 2); all were observed in the afternoon—4 occurring after and 1 before the administration of the second dose of insulin tregopil. In Cohort 3, 34 hypoglycemic events were reported.
Generally, the duration of hypoglycemic symptoms was approximately 30 minutes. All the hypoglycemic episodes were transient and resolved without treatment except 1 (Cohort 1 [51 mg/dL]; 20 minute premeal dosing group) that required treatment with glucose tablets.
Discussion
In the current study, insulin tregopil administered 10 to 20 minutes before a meal resulted in an appropriate postmeal exposure and a better control of PPG excursion and hence was chosen as the premeal dosing time for administration. Although maximum absorption of insulin tregopil occurred with a premeal dosing time of 30 minutes, most of the absorption was completed before the initiation of the meal resulting in a lower glucose‐lowering potential in the postmeal period due to rapid onset and shorter duration of action.
For the between‐meal‐interval groups, the PK parameters observed for the 6‐hour group vs 4‐ and 5‐hour groups were similar after the morning meal. However, the difference in the PK levels was evident after administering the afternoon meal. This may be explained by the ongoing and persisting effect of the previous meal on the gut hormones18 and the intersubject variability in oral drug absorption. However, it is also important to note here that these PK parameters reflect the concentrations observed in the peripheral circulation and not the portal circulation. For orally administered insulin, portal PK seems to be a more prominent determinant of PD.19 This is also true in the current study where the observed PK differences have very less resultant impact on the PD parameters across the groups. Although insulin tregopil exposure (plasma AUC) was higher in the 6‐hour group compared to 4‐ and 5‐hour between‐meal‐interval groups in the afternoon, the glucose‐lowering response was similar in all groups. In the insulin tregopil groups, the “extent of reduction in glucose concentration” and “time to minimum glucose concentration” were similar after the morning and afternoon meals irrespective of the between‐meal‐interval time. However, the “extent of reduction in glucose concentration” was lesser in the afternoon for the 3 between‐meal intervals in the placebo group. A diurnal pattern of insulin sensitivity and glucose tolerance is commonly observed in patients with T2DM,20, 21 characterized by reduced beta‐cell responsiveness to glucose and insulin action, with increasing hepatic insulin extraction in the afternoon as compared to morning.21 The residual glucose from the morning meal might have contributed to higher glucose levels immediately after the afternoon meal in the 4‐ and 5‐hour between‐meal‐interval groups compared to the 6‐hour group. In the 6‐hour between‐meal‐interval group, this may have been minimized, as glucose Cmin may have appeared before the afternoon meal absorption was initiated and due to least impact of the previous meal on insulin tregopil PK.
The overall glucose levels were closer to the placebo values in the 4‐ and 5‐hour group after the afternoon meal in comparison to the 6‐hour group. However, the extent of increase in glucose AUC for the afternoon meal was lower with all insulin tregopil groups than with placebo due to its control on glucose excursion. The ease of availability of higher oral insulin levels in the liver can aid in better hepatic insulin extraction in the afternoon and may further result in reduction in blood glucose level to a similar extent as the morning levels. Additionally, though high intrasubject variability was observed for PK parameters, intrasubject variability for the baseline‐adjusted PD parameters (glucose AUC0‐180min and glucose Cmin) was not different from placebo and thus not considered to be of major concern. The intrasubject variability observed in this study is also not significantly higher than that observed with other rapid‐acting subcutaneous insulins. In a study in patients with T1DM,22 the intrasubject variability for AUCGIR0‐t was 22.1% and maximum glucose infusion rate was 29.9% for faster insulin aspart group (ultra‐fast‐acting subcutaneous insulin); and 18.9% and 18.0% for insulin aspart group. Thus, the between‐meal dosing intervals may affect insulin tregopil PK but may not translate into a significant impact on the PD when compared to placebo. Hence, considering similar PD responses for both 5‐ and 6‐hour between‐meal‐interval groups and the practical difficulties of a 6‐hour interval between meals, a 5‐hour gap between meals was selected for subsequent cohort evaluation.
Different types of meal compositions may have varying impact on the PK and PD responses. A high‐fiber meal tends to increase gastrointestinal motility,23 while a high‐fat meal tends to decrease it.24 In Cohort 3 of this study, the extent of reduction in glucose levels after the morning meal was similar across groups. However, a higher reduction was seen in the high‐fat meal group. A high‐fiber meal had the least impact on insulin tregopil absorption and resulted in the highest reduction in plasma glucose levels after the afternoon meal. A high‐fat meal reduced insulin tregopil absorption after the afternoon meal. However, the PD response was maintained. Overall, the differences observed in insulin tregopil PK with different types of meals did not translate into a significant impact on PD. One probable explanation for this can be that the insulin tregopil levels in the portal circulation are much more determinative of the metabolic effects than the peripheral levels.19 Suppression of hepatic glucose production probably indicates an insulinized liver resulting from hepato‐preferential availability of insulin tregopil. When an oral insulin is administered, at least 50% of the insulin is extracted on its first pass through the liver,25 resulting in a 2.5‐ to 3‐fold higher insulin concentration in the portal vein compared to the systemic circulation.26 This also indicates that the peripheral levels of insulin tregopil (PK) may not necessarily correlate with its functional effect (PD) and hence may be a less defining parameter for oral insulin assessments. Hence, assessment of hepatic PK levels is considered optimal for oral insulins. However, these were not carried out in the current study due to limitation of feasibility of direct sampling from portal circulation and given the early stage of development of insulin tregopil.
The physiological insulin levels in the blood peak within 30 to 40 minutes following meal ingestion in normal individuals,27 when hyperglycemia typically begins to set in. It has a half‐time of action of ∼20 minutes despite a plasma clearance of 4 to 5 minutes.28 This first phase of insulin secretion is observed to be deficient in patients with T2DM.29 In this study, the peak plasma glucose‐lowering effect of insulin tregopil was observed 36 to 40 minutes after dosing (10–20 minutes after a meal) in patients with T2DM, which is closer to the physiological onset of insulin action. This rapid‐onset profile of insulin tregopil results in effective lowering of glucose exposure early on in the postmeal period. The duration of glucose‐lowering action of insulin tregopil is approximately 2 hours. This is found to be shorter in comparison to other fast‐acting insulins (3‐5 hours)30 and may result in minimizing the number of hypoglycemic incidences in the postmeal period. The reduced risk of hypoglycemia coupled with the ease of oral delivery can encourage early adoption of this treatment. This can result in early insulinization in T2DM patients with a potential benefit of beta‐cell–sparing effects and reduction in disease progression rate.31
Several preclinical studies have assessed the metabolic differences between administration of insulin into the portal vein versus systemic vein or artery.24, 26, 32, 33 Portal vein infusion of human insulin at the rate of 1.8 pmol/kg/min (a rate ∼25% above basal) has been observed to (1) result in a rapid (50%‐60%) decline in endogenous glucose production, (2) not increase the arterial plasma insulin levels, (3) have no effect on nonhepatic glucose uptake, and (4) delay adipose tissue lipolysis inhibition. At the same time, peripheral administration at the same infusion rate results in (1) increase in plasma insulin levels in the peripheral artery by 2‐fold without any effect on portal vein insulin concentrations, (2) 2‐ to 3‐fold increase in nonhepatic glucose uptake, (3) suppression of endogenous glucose production after several hours, and (4) significant inhibition of adipose tissue lipolysis.24 Additionally, peripheral administration diverts glucose disposal from liver to the muscle and results in a rapid and more severe hypoglycemia.33
In the present study, most (88.3%) of the hypoglycemia cases reported were mild to moderate in intensity and were resolved without requiring a treatment. Parenteral insulin delivery systems are observed to contribute substantially toward a higher risk of hypoglycemia in patients with T2DM.34 Under normal conditions, insulin and glucagon operate in a concerted manner to maintain the glucose levels within a tight physiological range.35 Subcutaneously delivered insulin cannot rapidly adjust to blood glucose lowering due to lack of endogenous glucose‐sensing mechanisms in patients with T2DM. Persistent suppression of glucagon secretion by subcutaneously delivered insulin impairs the insulin‐glucagon ratio, affecting the glucose homeostasis such that it exposes patients to a higher risk of hypoglycemia.36 Insulin tregopil, delivered through the portal vein, may potentially improve glucose sensing and hence help balance the glucagon secretion, resulting in reduced hypoglycemic risk.37, 38 The reduced postprandial hypoglycemia risk is important not only with respect to reducing subsequent cardiovascular event risk39 but also in reducing the need for snacking between meals,40 which may result in reducing weight in the long run.
The design of the current study had some limitations. First, no active comparators could be used in the study, as no other approved oral insulins were available. The subcutaneously administered insulins, which have different mechanics, were not included in the study. Second, hepatic levels of insulin tregopil were not estimated in this study following the oral administration of insulin tregopil. Third, because the objective of this study was experimental optimization of administration conditions using a single dose, a dose‐range study of insulin tregopil was not carried out. Fourth, the optimal dosing time and between‐meal interval were determined under the ideal conditions of administering an ADA meal, a recommended meal for patients with T2DM. As the onset of action and time‐to‐peak action was similar for all 3 meals, results from the ADA meal were applied to other meal compositions as well.
Conclusion
Insulin tregopil given orally 10 to 20 minutes before meals with a 5‐hour interval between 2 meals, was rapidly absorbed, attained adequate postmeal exposure, and effectively lowered the PPG excursions under specific conditions explored in this study. Furthermore, the meal composition was observed not to alter the efficacy of insulin tregopil. Overall, insulin tregopil, with its rapid onset and short‐acting profile, is safe and well tolerated under different dosing conditions explored in this study.
Supporting information
Figures
Table S1. Pharmacodynamic Parameters for Insulin Tregopil in Cohort 1
Table S2. Baseline Corrected Plasma Glucose Pharmacodynamic Parameters for Cohort 1
Table S3. Pharmacodynamic Parameters for Insulin Tregopil and Placebo in Cohort 2
Table S4. Baseline Corrected Plasma Glucose Pharmacodynamic Parameters for Cohort 2
Table S5. Pharmacodynamic Parameters for Insulin Tregopil and Placebo in Cohort 3
Table S6. Baseline Corrected Plasma Glucose Pharmacodynamic Parameters for Cohort 3
Acknowledgments
The authors thank Dr. Juan Carlos Rondon, MD, JD, Elite Research Institute, Miami, Florida, for conducting the clinical trial. The authors also acknowledge Ashwani Marwah and Gowreesh for statistical analyses, Rashika Suri for the conduct of the study, and Ubhayabharathi Gurunath for editorial assistance (all are/were employees of Biocon Research Ltd).
Sandeep N. Athalye, as the guarantor of this work, takes full responsibility for the work as a whole, including the study design, access to data, and the decision to submit and publish the manuscript.
Disclosures
A.K. and V.J. were employees of Biocon Research Ltd., at the time of study conduct and hold stocks of Biocon Limited. H.L. is a scientific advisor for Biocon, Intarcia Pharmaceuticals, Metacure Ltd., and Poxel Pharmaceuticals. He holds stocks in Abbott, AbbVie Inc., General Electric, Gilead Sciences Inc., IBM, Nestlé, and Novartis AG. A.D.C. is a scientific advisor for Biocon, Fractyl Laboratories Inc., Metavention, NuSirt Biopharma Inc., Sensulin Labs LLC, These Three Medical Inc (T3M), VTV Therapeutics, and Zafgen. He is a consultant at Abvance, Boston Scientific Corporation, California Institute for Biomedical Research (Calibr), Eli Lilly and Company, Galvani Bioelectronics Ltd, MedImmune, Novo Nordisk Inc., Silver Lake, Thermalin Diabetes LLC, Thetis Pharmaceuticals LLC., and VTV Therapeutics. He has received research support from Boston Scientific Corporation, Galvani Bioelectronics Ltd, Novo Nordisk Inc., Silver Lake, Zafgen; holds stocks in Fractyl Laboratories Inc., Metavention, Thetis Pharmaceuticals LLC., and Zafgen; and has professional relationship with Abvance, Sensulin Labs LLC. A.F. is a board member of Tolerion and Innoneo. He is a consultant at Acasti, Adocia, Biocon, Cardiora, Carthera, Casebia, Diamyd, Diasome, Dance, EnteraBio, Emperra, Fractyl, G‐Medical, Immune Pharma, InsuLine Medical, Intarcia Therapeutics, Intra‐Cellular Therapeutics, InClinica, Ipsen Biopharmaceuticals, Lexicon, Mars Symbioscience, Mediwound, Merck KGaA, Mediwound, Metronom, Mylan, Neovii, NuSirt Biopharma, Orgenesis, Oramed, Permeatus, ProSciento, RenovoRx, Rhythm Pharmaceuticals, Sanofi, Serpin, SkinJect, Suzhou Connect, Thermalin, ThermoFisher, Upkara, Veracyte, VeroScience, Xeris Pharmaceuticals, and Zucara. S.N.A. is an employee of Biocon Research Ltd and holds stocks in Biocon. A.V. is an employee of Biocon Research Ltd.
Funding
The study was funded by Biocon Research Limited. A part of this study was presented as a poster and oral presentation at 78th Annual Meeting of the American Diabetes Association, 2018.
Author Contributions
A.K., H.L., A.F., A.C., V.J., and S.N.A. were involved in the design of the clinical study and analyzed and interpreted the study data and results. A.V. analyzed and interpreted the study data and results. All authors participated in the preparation and review of the manuscript. All authors read and approved the final version of the manuscript.
Trial registry number: NCT03392961
References
- 1. Marathe PH, Gao HX, Close KL. American Diabetes Association standards of medical care in diabetes 2017. J Diabetes. 2017;9:320‐324. [DOI] [PubMed] [Google Scholar]
- 2. Leahy JL. Natural history of β‐cell dysfunction in NIDDM. Diabetes Care. 1990;13:992‐1010. [DOI] [PubMed] [Google Scholar]
- 3. Del Prato S. Loss of early insulin secretion leads to postprandial hyperglycaemia. Diabetologia. 2003;46:M2‐M8. [DOI] [PubMed] [Google Scholar]
- 4. Mitrakou A, Kelley D, Mokan M, et al. Role of reduced suppression of glucose production and diminished early insulin release in impaired glucose tolerance. New Engl J Med. 1992;326:22‐29. [DOI] [PubMed] [Google Scholar]
- 5. Russell‐Jones D, Khan R. Insulin‐associated weight gain in diabetes–causes, effects and coping strategies. Diabetes Obes Metab. 2007;9:799‐812. [DOI] [PubMed] [Google Scholar]
- 6. Fonte P, Araújo F, Reis S, Sarmento B. Oral insulin delivery: how far are we? J Diabetes Sci Technol. 2013;7:520‐531. [DOI] [PMC free article] [PubMed] [Google Scholar]
- 7. Arbit E, Kidron M. Oral insulin delivery in a physiologic context: review. J Diabetes Sci Technol. 2017;11:825‐832. [DOI] [PMC free article] [PubMed] [Google Scholar]
- 8. Khedkar A, Iyer H, Anand A, et al. A dose range finding study of novel oral insulin (IN‐105) under fed conditions in type 2 diabetes mellitus subjects. Diabetes Obes Metab. 2010;12:659‐664. [DOI] [PubMed] [Google Scholar]
- 9. Guimarães C, Marra CA, Gill S, Meneilly G, Simpson S, Godoy AL. Exploring patients’ perceptions for insulin therapy in type 2 diabetes: a Brazilian and Canadian qualitative study. Patient Prefer Adher. 2010;4:171‐179. [DOI] [PMC free article] [PubMed] [Google Scholar]
- 10. Suryanarayan S, Khedkar A, Vedala A, et al. Pharmacokinetics and pharmacodynamics of a single oral dose of the insulin analog IN‐105, in tablet form, in normal healthy volunteers, in the presence of food. Diabetologia. 2007;50:S95‐S96. [Google Scholar]
- 11. Marathe CS, Rayner CK, Jones KL, Horowitz M. Relationships between gastric emptying, postprandial glycemia, and incretin hormones. Diabetes Care. 2013;36:1396‐1405. [DOI] [PMC free article] [PubMed] [Google Scholar]
- 12. Chang J, Rayner CK, Jones KL, Horowitz M. Diabetic gastroparesis and its impact on glycemia. Endocrin Metab Clin. 2010;39:745‐762. [DOI] [PubMed] [Google Scholar]
- 13. Cunningham KM, Read NW. The effect of incorporating fat into different components of a meal on gastric emptying and postprandial blood glucose and insulin responses. Br J Nutr. 1989;61:285‐290. [DOI] [PubMed] [Google Scholar]
- 14. Welch IM, Bruce C, Hill SE, Read NW. Duodenal and ileal lipid suppresses postprandial blood glucose and insulin responses in man: possible implications for the dietary management of diabetes mellitus. Clin Sci. 1987;72:209‐216. [DOI] [PubMed] [Google Scholar]
- 15. Tagliaferro V, Cassader M, Bozzo C, et al. Moderate guar‐gum addition to usual diet improves peripheral sensitivity to insulin and lipaemic profile in NIDDM. Diabetes Metab. 1985;11:380‐385. [PubMed] [Google Scholar]
- 16. Cavallo‐Perin P, Bruno A, Nuccio P, Bozzo C, Pagano G. Dietary guar gum supplementation does not modify insulin resistance in gross obesity. Acta Diabetol Lat. 1985;22:139‐142. [DOI] [PubMed] [Google Scholar]
- 17. YSI 2300 STAT Plus Analyzer. YSI Life Sciences, Yellow Springs, OH, USA. https://www.ysi.com/File%20Library/Documents/Manuals%20for%20Discontinued%20Products/YSI-2300-Stat-Plus-manual-j.pdf. Accessed June 12, 2019.
- 18. Rizi EP, Loh TP, Baig S, Chhay V, Huang S, Quek JC, Tai ES, Toh SA, Khoo CM. A high carbohydrate, but not fat or protein meal attenuates postprandial ghrelin, PYY and GLP‐1 responses in Chinese men. PloS One. 2018;13(1):e0191609. [DOI] [PMC free article] [PubMed] [Google Scholar]
- 19. Edgerton DS, Moore MC, Winnick JJ, et al. Changes in glucose and fat metabolism in response to the administration of a hepato‐preferential insulin analog. Diabetes. 2014;63:3946‐3954. [DOI] [PMC free article] [PubMed] [Google Scholar]
- 20. Shih KC, Ho LT. Effects of growth hormone on diurnal insulin sensitivity in normal and type 2 diabetic patients and animal models. J Diabetes Metab. 2016;7(10). [Google Scholar]
- 21. Saad A, Dalla Man C, Nandy DK et al. Diurnal pattern to insulin secretion and insulin action in healthy individuals. Diabetes. 2012;61:2691‐2700. [DOI] [PMC free article] [PubMed] [Google Scholar]
- 22. Heise T, Stender‐Petersen K, Hövelmann U, et al. Pharmacokinetic and pharmacodynamic properties of faster‐acting insulin aspart versus insulin aspart across a clinically relevant dose range in subjects with type 1 diabetes mellitus. Clin Pharmacokinet. 2017;56(6):649‐660. [DOI] [PMC free article] [PubMed] [Google Scholar]
- 23. Hillemeier C. An overview of the effects of dietary fiber on gastrointestinal transit. Pediatrics. 1995;96:997‐999. [PubMed] [Google Scholar]
- 24. Gentilcore D, Chaikomin R, Jones KL, et al. Effects of fat on gastric emptying of and the glycemic, insulin, and incretin responses to a carbohydrate meal in type 2 diabetes. J Clin Endocr Metab. 2006;91:2062‐2067. [DOI] [PubMed] [Google Scholar]
- 25. Arbit E, Kidron M. Oral insulin: the rationale for this approach and current developments. J Diabetes Sci Technol. 2009;3(3):562‐567. [DOI] [PMC free article] [PubMed] [Google Scholar]
- 26. Edgerton DS, Cardin S, Pan C, et al. Effects of insulin deficiency or excess on hepatic gluconeogenic flux during glycogenolytic inhibition in the conscious dog. Diabetes. 2001;51:3151‐3162. [DOI] [PubMed] [Google Scholar]
- 27. Tsukuda K, Kikuchi M, Irie S, et al. Evaluation of the 24‐hour profiles of physiological insulin, glucose, and C‐peptide in healthy Japanese volunteers. Diabetes Technol Ther. 2009;11(8):499‐508. [DOI] [PubMed] [Google Scholar]
- 28. Home PD. Plasma insulin profiles after subcutaneous injection: how close can we get to physiology in people with diabetes? Diabetes Obes Metab. 2015;17(11):1011‐1020. [DOI] [PMC free article] [PubMed] [Google Scholar]
- 29. Guillausseau P‐J, Meas T, Virally M, Laloi‐Michelin M, Médeau V, Kevorkian J‐P. Abnormalities in insulin secretion in type 2 diabetes mellitus. Diabetes Metab. 2008;34:S43‐S48. [DOI] [PubMed] [Google Scholar]
- 30. Dave JA, Delport SV. Prescribing insulin in type 1 diabetes mellitus: an update for general practitioners. S Afr Fam Pract. 2006;48(10):30‐36. [Google Scholar]
- 31. Wajchenberg BL. β‐cell failure in diabetes and preservation by clinical treatment. Endocr Rev. 2007;28:187‐218. [DOI] [PubMed] [Google Scholar]
- 32. Eaton RP, Allen RC, Schade DS. Hepatic removal of insulin in normal man: dose response to endogenous insulin secretion. J Clin Endocr Metab. 1998;56:1294‐1300. [DOI] [PubMed] [Google Scholar]
- 33. Gregory JM, Kraft G, Scott MF, et al. Insulin delivery into the peripheral circulation: a key contributor to hypoglycemia in type 1 diabetes. Diabetes. 2015;64:3439‐3451. [DOI] [PMC free article] [PubMed] [Google Scholar]
- 34. Leese GP, Wang J, Broomhall J, et al. Frequency of severe hypoglycemia requiring emergency treatment in type 1 and type 2 diabetes: a population‐based study of health service resource use. Diabetes Care. 2003;26:1176‐1180. [DOI] [PubMed] [Google Scholar]
- 35. Maruyama H, Hisatomi A, Orci L, Grodsky GM, Unger RH. Insulin within islets is a physiologic glucagon release inhibitor. J Clin Invest. 1984;74:2296‐2299. [DOI] [PMC free article] [PubMed] [Google Scholar]
- 36. Davidson JA, Holland WL, Roth MG, et al. Glucagon therapeutics: dawn of a new era for diabetes care. Diabetes Metab Res Rev. 2016;32:660‐665. [DOI] [PubMed] [Google Scholar]
- 37. Liebl A, Hoogma R, Renard E, et al. A reduction in severe hypoglycaemia in type 1 diabetes in a randomized crossover study of continuous intraperitoneal compared with subcutaneous insulin infusion. Diabetes Obes Metab. 2009;11(11):1001‐1008. [DOI] [PubMed] [Google Scholar]
- 38. Oskarsson PR, Lins PE, Backman L, Adamson UC. Continuous intraperitoneal insulin infusion partly restores the glucagon response to hypoglycaemia in type 1 diabetic patients. Diabetes Metab. 2000;26(2):118‐124. [PubMed] [Google Scholar]
- 39. Frier BM, Schernthaner G, Heller SR. Hypoglycemia and cardiovascular risks. Diabetes care. 2011;34:S132‐S137. [DOI] [PMC free article] [PubMed] [Google Scholar]
- 40. Cryer PE, Childs BP. Negotiating the barrier of hypoglycemia in diabetes. Diabetes Spectr. 2002;15:20‐27. [Google Scholar]
Associated Data
This section collects any data citations, data availability statements, or supplementary materials included in this article.
Supplementary Materials
Figures
Table S1. Pharmacodynamic Parameters for Insulin Tregopil in Cohort 1
Table S2. Baseline Corrected Plasma Glucose Pharmacodynamic Parameters for Cohort 1
Table S3. Pharmacodynamic Parameters for Insulin Tregopil and Placebo in Cohort 2
Table S4. Baseline Corrected Plasma Glucose Pharmacodynamic Parameters for Cohort 2
Table S5. Pharmacodynamic Parameters for Insulin Tregopil and Placebo in Cohort 3
Table S6. Baseline Corrected Plasma Glucose Pharmacodynamic Parameters for Cohort 3