

Abstract
Purpose
Performing bioinformatics analyses using trabecular meshwork (TM) gene expression data in order to further elucidate the molecular pathogenesis of primary open‐angle glaucoma (POAG), and to identify candidate target genes.
Methods
A systematic search in Gene Expression Omnibus and ArrayExpress was conducted, and quality control and preprocessing of the data was performed with ArrayAnalysis.org. Molecular pathway overrepresentation analysis was performed with PathVisio using pathway content from three pathway databases: WikiPathways, KEGG and Reactome. In addition, Gene Ontology (GO) analysis was performed on the gene expression data. The significantly changed pathways were clustered into functional categories which were combined into a network of connected genes.
Results
Ninety‐two significantly changed pathways were clustered into five functional categories: extracellular matrix (ECM), inflammation, complement activation, senescence and Rho GTPase signalling. ECM included pathways involved in collagen, actin and cell–matrix interactions. Inflammation included pathways entailing NF‐κB and arachidonic acid. The network analysis showed that several genes overlap between the inflammation cluster on the one hand, and the ECM, complement activation and senescence clusters on the other hand. GO analysis, identified additional clusters, related to development and corticosteroids.
Conclusion
This study provides an overview of the processes involved in the molecular pathogenesis of POAG in the TM. The results show good face validity and confirm findings from histological, biochemical, genome‐wide association and transcriptomics studies. The identification of known points of action for drugs, such as Rho GTPase, arachidonic acid, NF‐κB, prostaglandins and corticosteroid clusters, supports the value of this approach to identify potential drug targets.
Keywords: bioinformatics, gene ontology, glaucoma, molecular pathogenesis, network analysis, pathway analysis, primary open‐angle glaucoma, trabecular meshwork
Introduction
Primary open‐angle glaucoma (POAG) is a potentially sight threatening and complex disease in which the trabecular meshwork (TM) has been proven to play a crucial role (Tektas & Lutjen‐Drecoll 2009). It is well known that an increase in intra‐ocular pressure is the greatest and most common risk factor for POAG (Sommer et al. 1991). Despite the numerous data that has been collected in research, the molecular pathogenesis of POAG remains largely obscure. Consequently, an effective treatment option addressing these molecular changes is also still missing. Re‐using, re‐evaluating and integrating the existing data using state‐of‐the‐art bioinformatics approaches may provide an effective and efficient way to improve our understanding of the molecular pathogenesis of primary open‐angle glaucoma.
During the past decades, biochemical and histological in vitro studies have been performed in order to identify the pathogenesis of POAG. However, the number of molecules that can be investigated within these studies is limited. Using omics technologies, we are currently able to measure the expression of several thousands of molecules from one sample of affected tissue, leading to an exponential increase in data.
One example of omics studies is transcriptomics studies which investigate the differences in gene expression by comparing the levels of RNA for each gene in the healthy and POAG‐diseased TM tissue (Diskin et al. 2006; Liton et al. 2006; Wang et al. 2008; Liu et al. 2013). Genes that are found to be differentially expressed are likely to be associated with POAG. However, a gene is only a small fraction of the molecular processes it is involved in. Pathways represent such molecular processes and show the genes that are involved within these processes and how they are related to other molecules. By identifying the pathways in which the differentially expressed genes are involved, we can identify disease processes that are likely to play a role in the pathogenesis of POAG.
The aim of this study was to expand the understanding of the molecular pathogenesis of POAG by applying integrative bioinformatics analysis on the available human gene expression data of the TM in patients with POAG and controls. The step‐by‐step approach applied in this study allows a systematic quality check, investigation and interpretation of the available gene expression data from TM tissue. The obtained results enable us to identify possible drug targets to modulate the disease outcome.
Methods
Systematic search
We conducted a systematic search in two commonly used public repositories, Gene Expression Omnibus (http://www.ncbi.nlm.nih.gov/geo/) (Edgar et al. 2002; Barrett et al. 2013) and ArrayExpress (http://www.ebi.ac.uk/arrayexpress) (Kolesnikov et al. 2015), to select and download publicly available data of microarray studies. In each of these studies, the gene expression profiles between human trabecular meshwork cells of participants with and without POAG were compared. The keywords used in this search were primary open‐angle glaucoma, POAG, glaucoma, gene expression profiling, microarray and trabecular meshwork (cells). The first search was performed on 2016‐09‐20 and last updated on 2018‐11‐19.
Quality control and preprocessing of the data
After the systematic search, the data of each identified study were subjected to a thorough quality control and preprocessed to use as input for further analysis. If necessary, the authors of the datasets were approached to obtain additional information. ArrayAnalysis.org (Eijssen et al. 2013), an online platform with standardized scripts for quality control and preprocessing of gene expression data was used to do this. Where possible, we used the raw data (non‐processed data) and evaluated data quality before and after normalization. The results of the quality control of the original data were visualized in multiple plots to allow assessment of the homogeneity of the dataset, the signal strength of the different samples in the dataset, the correlation of expression and the way in which the samples cluster or contain outliers. Studies of low quality were excluded for further analysis. Within the remaining studies, samples that appeared divergent throughout the quality control were also excluded for further analysis. The quality assessment of the studies and samples was performed by two researchers, independently from each other. Thereafter, the results were compared, and in case of disagreement, consensus was achieved by discussion.
After data preprocessing, statistical analysis to compare patient and control groups was performed using the limma package for R (linear regression models) as available from Bioconductor (R Core Team 2013; Ritchie et al. 2015).
Systematic application of the above‐mentioned steps led to high‐quality data on differential gene expression, which was used as input for pathway and Gene Ontology analysis.
Pathway analysis
After the quality control and preprocessing of the data, we aimed to identify in which molecular pathways the up‐ and downregulated (differentially expressed) genes are present. To do this, the differential gene expression data that resulted from the statistical analysis was mapped onto known (pre‐existing) pathways. As mentioned before, pathways represent molecular processes and the genes that are involved in these processes. Therefore, if all the genes within a pathway are differentially expressed (that means up‐ or downregulated) between patients and controls, we can assume that this pathway, and the process it represents, is relevant in the disease process. Similarly, if no genes within a pathway are changed, we can assume that this pathway is not relevant.
However, the reality is more complicated, since mostly not all genes within a pathway are changed and the degree of change may vary as well. Consequently, we performed a pathway overrepresentation analysis using a common cut‐off criterion for the degree of change in gene expression based on common practice and agreement. We chose relatively strict cut‐off points and considered genes with an absolute 2log fold change (logFC) in gene expression higher than 0.58 (representing a 50% change in expression) and a p‐value smaller than 0.05, as significantly changed.
By performing pathway analysis, we can determine which pathways have the highest overrepresentation of significantly changed genes and are therefore likely to be involved in the pathogenesis of POAG. The overrepresentation analysis was performed in PathVisio 3.2.4 (van Iersel et al. 2008; Kutmon et al. 2015), an open‐access analysis tool. In order to recognize all the elements within the pathways, an identifier mapping database was downloaded from http://www.pathvisio.org (last updated on the 14th of April 2016, version Hs_Derby_Ensembl_85.bridge). In the results of the overrepresentation analysis, pathways with a significance score (Z‐score) ≥ 1.96, a permuted p‐value < 0.05 and ≥3 changed genes in the pathway were considered significantly changed.
As mentioned before, the pathways we studied are available from free access pathway databases. However, as none of the current pathway databases contain all the existing pathways, we combined the three most commonly used pathway databases into one large collection in order to obtain a larger pathway coverage: WikiPathways (Kelder et al. 2012; Kutmon et al. 2016), KEGG (Kanehisa & Goto 2000; Kanehisa et al. 2016, 2017) and Reactome (Milacic et al. 2012; Fabregat et al. 2016). The pathways from each database were downloaded on 10th August 2017. The number of pathways and unique genes in each of these pathway databases are shown in Table 1. For WikiPathways only the curated collection was included. For KEGG, the disease pathways were excluded and only the general processes were added to the collection. Of the nearly 12 000 unique genes in the combined pathway collection, 42.2% are covered in one of the three databases only (Fig. 1). This confirms the importance of integrating the available collections. Using PathVisio, we calculated the overrepresentation score (Z‐score) in one run for all included pathways of all three databases.
Table 1.
The number of pathways and unique human genes per used pathway database
| Number of pathways | Number of unique genes | |
|---|---|---|
| WikiPathways | 393 | 5,492 |
| Reactome | 473 | 10,088 |
| KEGG | 234 | 6,595 |
Figure 1.
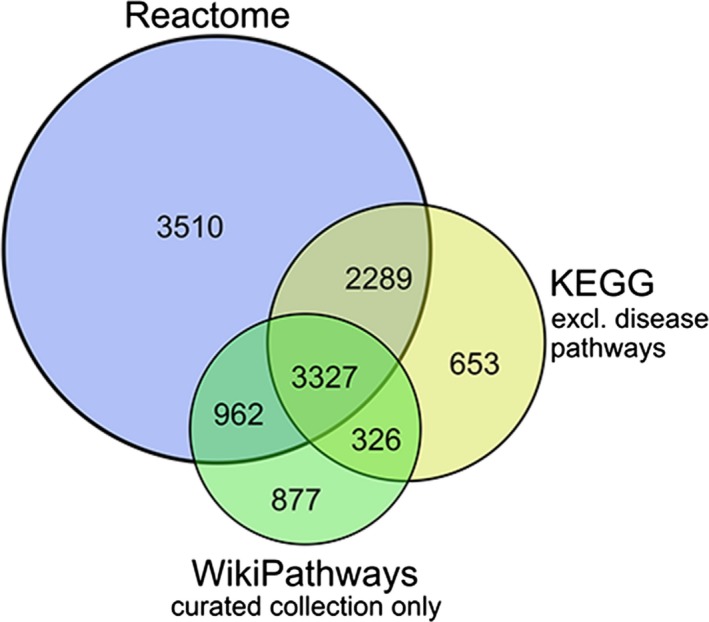
Venn diagram showing the overlap in unique genes between pathway databases.
Clustering of the pathway results
After the aforementioned pathway analysis, the significantly changed pathways were clustered into functional categories. These categories were based on the molecular mechanisms that were captured in the pathways. The clustering was performed by human curation after careful investigation of the results.
Network analysis
Cytoscape (http://www.cytoscape.org), an open‐access tool, was used to combine the genes involved in each of the identified functional categories into a network of connected genes (Shannon et al. 2003). It allows to vizualize how the functional categories are related to each other, to visualize how many and which mutual genes are shared between the multiple categories, to investigate these genes, and to retrieve the most relevant target genes for new drugs.
Gene ontology analysis
In addition to the pathway analysis, in which we looked at the process level, we also performed Gene Ontology (GO) analysis on the gene expression data. Gene Ontology (GO) analysis allows investigating the functions of the genes by using their structured individual annotations (Ashburner et al. 2000). We used Gorilla (http://cbl-gorilla.cs.technion.ac.il/), a freely available online tool (Eden et al. 2009). As for pathway analysis, genes with an absolute 2log fold change (logFC) in gene expression higher than 0.58 and a p‐value smaller than 0.05 were considered to be significantly changed in the GO analysis.
Clustering of the GO results
After performing GO analysis, the significant functional terms were clustered into functional categories. This was also performed by human curation after careful investigation of the results. The results obtained after performing the pathway, and GO analysis were compared with each other for agreement in functional categories.
Results
Systematic search
After the systematic search, the datasets of four different studies were selected for further analyses: GSE27057 and GSE27058 (Diskin et al. 2006), GSE4316 (Liton et al. 2006), and GSE27276 (Liu et al. 2013). For three out of four datasets, we contacted the authors to obtain additional information. The characteristics of the datasets are shown in Table 2. The most important features for each of the included studies are described below.
Table 2.
Characteristics of the identified gene expression datasets
| Diskin et al. GSE27057 and GSE27058 (2006) | Liton et al. GSE4316 (2006) | Liu et al. GSE27276 (2013) | |
|---|---|---|---|
| Study design | HTM specimens of post‐mortem donors with and without POAG |
HTM specimens of post‐mortem donors with and without POAG and cultured HTM cells of post‐ mortem donors without POAG |
HTM specimens of POAG cases obtained from trabeculectomy and from post‐mortem donor eyes using the same approach as a standard trabeculectomy |
| Passage cells | Not applicable | 3rd (cultured cells) | Not applicable |
| Number of included patients with POAG | 5 (GSE27057 and GSE27058) | 2 pairs of eyes | 15 (from one patient both eyes were included) |
| Number of included control donors |
5 (GSE27057) 4 (GSE27058) |
5 pairs of eyes | 13 (from six patients both eyes were included) |
| Age (years) | POAG and control: 66–87 |
POAG: 59 and 77 Control: 70, 85 and 87 |
POAG: 40–86 Control: 48–94 |
| Microarray | Custom Affymetrix Glyco v2 GeneChips | Affymetrix Human Genome U133 Plus 2.0 | Sentrix Human‐6 Expression BeadChip |
Datasets GSE27057 and GSE27058 of Diskin et al. investigate the differences in gene expression profiles between five glaucoma cases and five and four control cases, respectively. All samples were derived from post‐mortem human donor eyes. The diagnosis and medical information were supplied by the treating ophthalmologist of the donor, using a detailed questionnaire.
Dataset GSE4316 shows the differences between the gene expression profiles of three cultured TM cells and the TM tissues of three control and two POAG pairs of eyes. All samples were derived from post‐mortem human donor eyes. The POAG eyes were from donors with a documented history of POAG and use of glaucoma medication.
Dataset GSE27276 shows the differences between the gene expression profiling of fifteen POAG and thirteen control cases. One of the POAG cases had a MYOC mutation. The samples of the POAG cases were obtained from routine trabeculectomy surgery. The control TM samples were obtained from post‐mortem human donor eyes. To collect these control samples, the same method was used during the trabeculectomy. In one of the POAG cases and six of the control cases, samples of both eyes were used. A technical replicate was performed for one of the cases.
Quality control and preprocessing of the data
The detailed reports of the quality control of the datasets are added in File S1, containing Fig. S1A–D, and File S2, containing Fig. S2A–G. The most important observations concerning the quality control for each of the datasets are described below.
Excluded datasets
Diskin et al. (GSE27057 and GSE27058): The provided data were generated using custom Affymetrix Glyco v2 GeneChips. This chip contained both human and mouse probes for a specific chosen subset of genes. We were able to link the provided identifiers to the more generic Ensembl identifiers, resulting in the identification of 752 unique human genes. This is a relatively low number of genes to use as input for pathway analysis. In addition, the associated article stated that the provided samples comprised not only of POAG cases, but also normal tension glaucoma and glaucoma suspect donors. The provided metadata did not allow us to trace this back to the samples in the dataset, thereby not allowing us to identify the glaucoma samples that were diagnosed with POAG. This also could not be deduced from the results of the quality control (not shown). Based on above findings, both datasets were excluded from further analysis.
Liton et al. (GSE4316): For this study, only processed data was available. We first run quality control on the raw data, not observing any deviations. However, based on the results of the quality control, we concluded that the processed data, provided by the authors of this study, were not normalized yet. Therefore, we performed quantile normalization and made additional plots for the normalized data. The plots resulting from the quality control (File S1) demonstrated that the cultured cells behave differently from the other samples. Therefore, we removed them from the dataset, resulting in the remainder of two POAG and three control cases. When investigating these tissue samples, the quality control shows a mixed clustering of POAG and control cases (File S1). Due to the remaining small sample size and their divergent behaviour, the quality of the dataset was found to be too low, despite normalization techniques. Therefore, this dataset was also excluded for further analysis.
Included dataset
Liu et al. (GSE27276): we performed preprocessing and quality control on the provided raw and normalized data. Here, we only present the results of the quality control on the normalized data. The quality control (File S2) showed that one control sample (c9.2) behaved as an outlier. This sample was therefore removed from the data, and the quality control was repeated with the remaining samples. No other divergent samples were detected, and they were therefore included for further analyses. However, to ensure homogeneity of the dataset, we removed the samples of the MYOC mutation carrier (p15.1 and p15.1r). Therefore, fourteen POAG cases and thirteen control cases remained in the dataset.
Based on the results of the quality control, one dataset containing high‐quality gene expression data of fourteen POAG cases and thirteen control cases was used for pathway and GO analysis.
Pathway analysis
Pathway analysis, performed with the combined pathway collection from WikiPathways, KEGG and Reactome showed 92 significantly altered pathways (Z‐score ≥ 1.96, a permuted p‐value < 0.05, and ≥3 changed genes in the pathway). The complete results of the pathway analysis are shown in Table S1.
Clustering of the pathway results
The significant pathways could be clustered into the following functional categories: extracellular matrix (ECM), inflammation, complement activation, senescence and Rho GTPase. The inflammation category could be further subcategorized in interleukin signalling, NF‐κB, arachidonic acid, and general inflammation pathways, such as the TNF signalling pathway. Subcategories for the ECM category are collagen, actin and cell–matrix, cell–cell interactions and general ECM pathways, such as the ECM organization pathway. The results of the clustering are presented in Table 3.
Table 3.
Clusters resulted from the pathway analysis
| Pathway name | Pathway database | Z‐score | Permuted p‐value | Positive* | Measured* | |
|---|---|---|---|---|---|---|
| Extracellular matrix | ||||||
| ECM | Extracellular matrix organization | Reactome | 5.58 | <0.0001 | 14 | 41 |
| Degradation of the extracellular matrix | Reactome | 4.94 | <0.0001 | 12 | 37 | |
| ECM‐receptor interaction | KEGG | 4.29 | <0.0001 | 12 | 43 | |
| miRNA targets in ECM and membrane receptors | WikiPathways | 4.21 | 0.002 | 7 | 19 | |
| miR‐509‐3p alteration of YAP1/ECM axis | WikiPathways | 2.72 | 0.026 | 4 | 13 | |
| Activation of matrix metalloproteinases | Reactome | 2.53 | 0.014 | 4 | 14 | |
| Collagen | Collagen biosynthesis and modifying enzymes | Reactome | 4.72 | <0.0001 | 11 | 34 |
| Collagen chain trimerization | Reactome | 3.86 | 0.001 | 7 | 21 | |
| Assembly of collagen fibrils and other multimeric structures | Reactome | 3.84 | 0.002 | 8 | 26 | |
| Actin | Regulation of actin cytoskeleton | WikiPathways | 2.63 | 0.012 | 12 | 65 |
| Regulation of actin cytoskeleton | KEGG | 2.36 | 0.018 | 16 | 101 | |
| Cell–matrix and cell–cell interactions | Cell adhesion molecules (CAMs) | KEGG | 5.45 | <0.0001 | 17 | 57 |
| Tight Junction | KEGG | 3.4 | 0.001 | 17 | 87 | |
| Focal Adhesion‐PI3K‐Akt‐mTOR‐signalling pathway | WikiPathways | 3.29 | 0.003 | 24 | 141 | |
| Focal adhesion | WikiPathways | 3.06 | 0.002 | 18 | 101 | |
| Inflammation | ||||||
| Interleukin signalling | Interleukin‐4 and 13 signalling | Reactome | 9.28 | <0.0001 | 37 | 106 |
| IL‐17 signalling pathway | KEGG | 4.53 | <0.0001 | 13 | 46 | |
| Interleukin‐10 signalling | Reactome | 3.23 | 0.005 | 10 | 43 | |
| IL‐17 signalling pathway | WikiPathways | 2.07 | 0.038 | 4 | 17 | |
| NF‐κB | Quercetin and NF‐κB/AP‐1 Induced Cell Apoptosis | WikiPathways | 2.92 | 0.006 | 4 | 12 |
| TAK1 activates NF‐κB by phosphorylation and activation of IKKs complex | Reactome | 2.76 | 0.014 | 5 | 18 | |
| Photodynamic therapy‐induced NF‐κB survival signalling | WikiPathways | 3.95 | 0.004 | 6 | 16 | |
| Arachidonic acid | Arachidonic acid metabolism | KEGG | 2.48 | 0.014 | 6 | 26 |
| Arachidonic acid metabolism | Reactome | 2.27 | 0.022 | 6 | 28 | |
| General | Inflammatory response pathway | WikiPathways | 5.06 | <0.0001 | 7 | 15 |
| Allograft rejection | WikiPathways | 4.05 | 0.001 | 11 | 40 | |
| Intestinal immune network for IgA production | KEGG | 3.95 | 0.0001 | 6 | 16 | |
| Th17 cell differentiation | KEGG | 2.88 | 0.006 | 11 | 54 | |
| Antigen processing and presentation | KEGG | 2.78 | 0.015 | 9 | 42 | |
| Th1 and Th2 cell differentiation | KEGG | 2.47 | 0.023 | 9 | 46 | |
| Neutrophil degranulation | Reactome | 2.31 | 0.017 | 38 | 294 | |
| TNF signalling pathway | KEGG | 2.13 | 0.027 | 9 | 51 | |
| Complement activation | ||||||
| Complement activation | WikiPathways | 4.93 | <0.0001 | 6 | 12 | |
| Complement and coagulation cascades | WikiPathways | 4.76 | <0.0001 | 10 | 29 | |
| Complement and coagulation cascades | KEGG | 4.48 | <0.0001 | 11 | 36 | |
| Complement cascade | Reactome | 3.86 | 0.001 | 7 | 21 | |
| Senescence | ||||||
| Senescence‐Associated Secretory Phenotype (SASP) | Reactome | 3.51 | 0.003 | 12 | 52 | |
| DNA damage/telomere stress induced senescence | Reactome | 2.83 | 0.004 | 6 | 23 | |
| Senescence and autophagy in cancer | WikiPathways | 1.98 | 0.033 | 10 | 61 | |
| RHO GTPase | ||||||
| RHO GTPases activate ROCKs | Reactome | 2.72 | 0.021 | 4 | 13 | |
| RHO GTPases activate PKNs | Reactome | 2.34 | 0.024 | 5 | 21 | |
| RHO GTPases activate CIT | Reactome | 2.37 | 0.019 | 4 | 15 | |
| RHO GTPases activate PAKs | Reactome | 2.21 | 0.023 | 4 | 16 | |
*Positive: the number of genes on the pathway that pass the statistical criteria (absolute logFC > 0.58 and p‐value < 0.05); Measured: the number of genes on the pathway that were measured in the dataset.
Network analysis
We created an integrated network showing the genes involved in each of the five main categories to study the interplay between the processes. The network analysis shows that the clusters of ECM, complement activation and senescence have multiple mutual genes with the inflammation cluster, showing the central role of inflammation in the connection between clusters. In addition, 12 genes are present in three or more clusters, as displayed in Figure 2.
Figure 2.
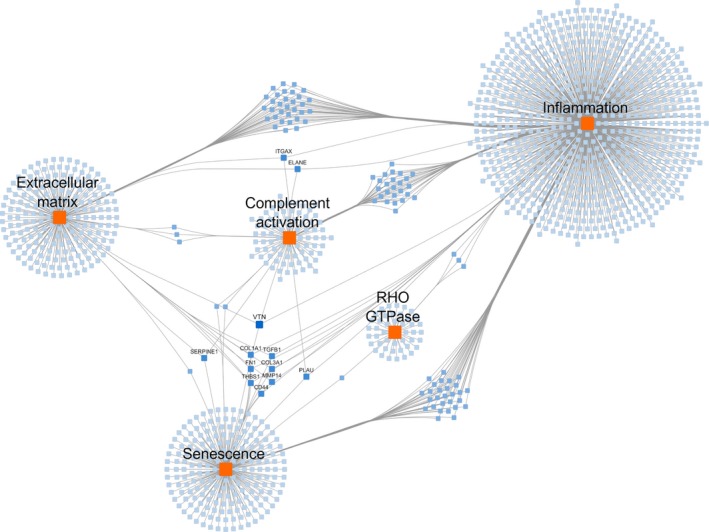
Network of the five identified pathway categories. Orange rectangles indicate the categories; blue nodes indicate the genes present in at least one pathway of the category; darker shades of blue indicate participation of the gene in more than one category; gene labels are shown for genes present in three or more categories.
Gene ontology analysis
Gene Ontology (GO) overrepresentation analysis of the differentially expressed genes resulted in fifty‐one significant GO functional terms (p‐value < 10−6). The complete tabular results of the GO analysis are shown in Table S2.
Clustering of the GO results
The GO terms were clustered into five categories: ECM, inflammation, cell adhesion, corticosteroids and development (Table 4).
Table 4.
Clusters resulting from the GO analysis
| GO term | p‐value |
FDR q‐value * |
Enrichment (B, b)* |
|---|---|---|---|
| Extracellular matrix | |||
| Extracellular matrix organization | 1.75E‐10 | 1.1E‐6 | 3.08 (155, 38) |
| Extracellular structure organization | 1.75E‐10 | 7.31E‐7 | 3.08 (155, 38) |
| Extracellular matrix disassembly | 3.75E‐6 | 1.27E‐3 | 4.30 (38, 13) |
| Inflammation | |||
| Defence response | 3.11E‐8 | 3.24E‐5 | 1.97 (427, 67) |
| Response to wounding | 4.76E‐8 | 4.25E‐5 | 3.43 (88, 24) |
| Response to inorganic substance | 7.67E‐8 | 6.39E‐5 | 2.30 (246, 45) |
| Response to stimulus | 9.65E‐8 | 7.54E‐5 | 1.33 (2236, 236) |
| Immune response | 7.25E‐7 | 3.94E‐4 | 1.99 (335, 53) |
| Regulation of immune system process | 7.59E‐7 | 3.95E‐4 | 1.66 (667, 88) |
| Response to oxygen‐containing compound | 1.38E‐6 | 6.41E‐4 | 1.69 (597, 80) |
| Regulation of response to stimulus | 1.65E‐6 | 7.35E‐4 | 1.35 (1767, 189) |
| Humoral immune response | 1.83E‐6 | 7.89E‐4 | 3.23 (78, 20) |
| Regulation of immune response | 2.54E‐6 | 9.91E‐4 | 1.81 (432, 62) |
| Acute inflammatory response | 2.94E‐6 | 1.05E‐3 | 5.13 (27, 11) |
| Immune system process | 3.42E‐6 | 1.19E‐3 | 1.49 (981, 116) |
| Regulation of cytokine production | 4.13E‐6 | 1.36E‐3 | 1.99 (291, 46) |
| Response to molecule of bacterial origin | 5.84E‐6 | 1.62E‐3 | 2.52 (135, 27) |
| Positive regulation of response to stimulus | 6.42E‐6 | 1.74E‐3 | 1.47 (983, 115) |
| Inflammatory response | 8.81E‐6 | 2.25E‐3 | 2.26 (178, 32) |
| Cell adhesion | |||
| Cell adhesion | 6.53E‐9 | 9.07E‐6 | 2.14 (359, 61) |
| Biological adhesion | 1.01E‐8 | 1.26E‐5 | 2.11 (363, 61) |
| Cell–cell adhesion | 2.98E‐7 | 1.69E‐4 | 2.58 (161, 33) |
| Regulation of cell adhesion | 8.63E‐6 | 2.25E‐3 | 1.92 (308, 47) |
| Corticosteroids | |||
| Response to steroid hormone | 4.29E‐6 | 1.34E‐3 | 2.88 (96, 22) |
| Response to glucocorticoid | 5.13E‐6 | 1.46E‐3 | 3.39 (63, 17) |
| Response to corticosteroid | 7.13E‐6 | 1.9E‐3 | 3.19 (71, 18) |
| Development | |||
| Developmental process | 4.24E‐11 | 5.3E‐7 | 1.43 (2081, 237) |
| Epidermis development | 1.91E‐10 | 5.96E‐7 | 6.11 (35, 17) |
| Anatomical structure development | 2.98E‐8 | 3.38E‐5 | 1.48 (1380, 162) |
| Cellular developmental process | 1.04E‐7 | 7.66E‐5 | 1.53 (1105, 134) |
| Cell differentiation | 1.31E‐6 | 6.29E‐4 | 1.60 (756, 96) |
| Tissue development | 2.24E‐6 | 9.02E‐4 | 2.11 (250, 42) |
| Regulation of developmental process | 9.62E‐6 | 2.4E‐3 | 1.43 (1088, 124) |
*FDR q‐value: p‐value after correction for multiple testing; B: the total number of genes associated with the GO term; b: the number of genes associated with the GO term that pass the statistical criteria (absolute logFC > 0.58 and p‐value < 0.05). In total, there are 7901 number of genes in the dataset (N = 7901); 628 genes are differentially expressed (n = 628); Enrichment is defined as (b/n)/(B/N). Results with a p‐value < 10−6 were considered to be significant.
Figure 3 shows an integrated flowchart of the methods and results.
Figure 3.
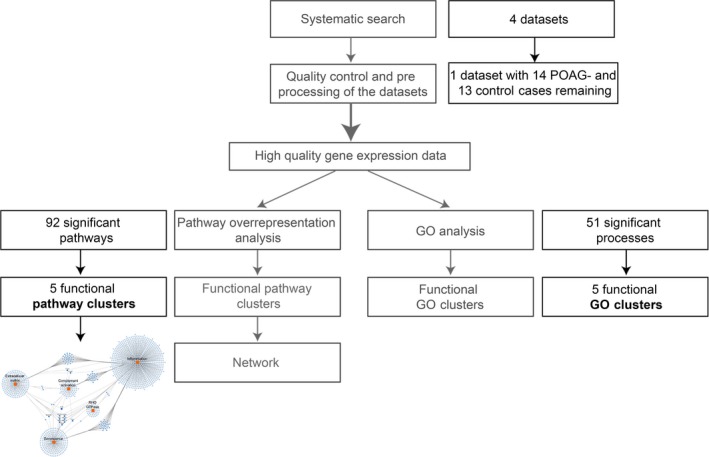
Flow chart of the methods and results of this paper. The grey text represents the methods, black text represents the results.
Discussion
Faced with the enormous amount of data obtained by omics studies, research has been directed to determine how this data can be interpreted and used in a meaningful way. In this study, we have shown how developments in bioinformatics enable the needed integration of omics data to improve interpretation and understanding of biological processes and their contribution to human disease. Specifically, we demonstrated how pathway and gene ontology analysis generate new insights into the molecular pathways involved in the pathogenesis of POAG.
We applied a systematic bioinformatics approach to perform quality control and preprocessing steps on gene expression profiling datasets in which differences in gene expression of TM cells in patients with and without POAG were compared. Although only one dataset passed our quality control, pathway overrepresentation analysis identified 92 pathways that were significantly changed in patients with POAG, as compared to patients without POAG. These pathways were clustered into five functional categories: ECM, inflammation, complement activation, senescence and Rho GTPase. These categories were combined into a network of connecting genes, showing overlap between the categories and the central position of the inflammation cluster. Also, the genes present in at least three categories were visualized within the network. The additional GO analysis on our preprocessed and quality controlled dataset showed that the significantly changed genes were involved in ECM, inflammation and cell adhesion, which we already found in the pathway analysis. Additionally, development and corticosteroid‐related clusters were found. As far as we know, this study is the first to perform a systematic, state‐of‐the‐art step‐by‐step approach on the available gene expression datasets of TM tissue from patients with POAG and controls.
For each of the five identified molecular process categories, other studies provide supportive evidence of their role in the TM and their involvement in the pathogenesis of POAG.
Multiple changes have been described in the ECM of TM derived from patients with POAG. For example, the stiffness of glaucomatous TM, especially the juxtacanalicular tissue, is higher and an increase in plaque‐like depositions that consist, among others, of a core of elastic fibres is seen (Rohen et al. 1981; Last et al. 2011). In addition, gene expression studies have shown differences in the expression of genes encoding ECM proteins between patients with POAG and healthy controls. These differences correlate with morphological changes that occur in the ECM of the TM, for example genes that are involved in the formation of collagen, fibronectin and integrins (Liton et al. 2006). Furthermore, TGF‐β signalling regulates the ECM turnover (Fuchshofer & Tamm 2009). TGF‐β2 was identified in our study as part of the Extracellular Matrix Organization pathway and is known to regulate the ECM metabolism in TM cells and tissues. It induces elastin and collagen cross‐linking enzymes (LOX‐genes), which are associated with the pathological ECM changes observed in glaucomatous TM (Fuchshofer & Tamm 2009; Sethi et al. 2011). Elastin, collagen and LOX‐genes are also present in the Extracellular Matrix Organization pathway we identified. Moreover, TGF‐β1 is present in thirteen of our significantly changed pathways. It is known to induce the expression of smooth muscle actin in cultured TM cells and therefore influences the TM actin cytoskeleton (Tamm et al. 1996). Interestingly, corticosteroids, which we identified as a functional category in our GO analysis, also induce changes in the cytoskeleton, better known as the formation of cross‐linked actin networks (CLANs) (Clark et al. 1994).
Concerning the inflammation category, inflammatory mediators, such as TGF‐β1, TNF‐α and interleukins such as IL‐6, can induce changes in the ECM and the cytoskeleton of the TM. This implies that an inflammatory response is also involved in the pathogeneses of POAG, which was also confirmed by other studies (Taurone et al. 2015). Moreover, interleukins, for example IL‐10, IL‐8 and TGF‐β1, are upregulated in the aqueous humour of patients with POAG (Micera et al. 2016). In addition, arachidonic acid, which we also found in our pathway analysis, is a precursor of prostaglandins. Prostaglandin analogues are currently used for the treatment of POAG and affect the outflow in the TM (Toris et al. 2008). Furthermore, NF‐κB, another inflammatory component, is known to be activated in the TM cells in glaucoma where it protects against oxidative stress (Wang et al. 2001).
The category Rho GTPase is of special interest. Downstream targets of Rho GTPase are Rho/Rho‐associated kinases (ROCKs), including RHOA. Rho/Rho‐associated kinases (ROCKs) plays an important role in focal adhesions, actin stress fibres and cell adhesion (Wang et al. 2013). Therefore, they are likely to play an important role in the function of the TM and in the pathogenesis of glaucoma (Wang et al. 2013; Rao et al. 2017). Moreover, ROCK inhibitors are currently being tested to lower the intra‐ocular pressure in glaucoma (Inoue & Tanihara 2013; Rao et al. 2017).
Finally, the category senescence is shown to be involved in POAG. Ageing is a known risk factor (de Voogd et al. 2005). With ageing, multiple changes in the TM have been described, for example an increase in TM stiffness (Morgan et al. 2015; Liu et al. 2017). Additionally, Senescence‐Associated Secretory Phenotype (SASP) genes play a key role as their expression activates multiple inflammation factors such as TNF‐α, and, among others, IL‐1/NF‐κB and TGF‐β/SMAD signalling pathways (Hubackova et al. 2012). There is evidence that ageing tissue is chronically inflamed, which suggests there is an interplay between senescence and inflammation (Young & Narita 2009).
We created a network of the five molecular process categories that we have identified to be involved in the pathogenesis of POAG. This network does not only show an interplay between the senescence and inflammation cluster, as suggested above, but also shows that ECM and complement activation clusters share multiple genes with the inflammation cluster. This points out the central role of inflammation in the connection between clusters (Fig. 2). Furthermore, within the network, the gene symbols of the genes that are present in at least three of the categories are shown. More than 50% of these genes have been associated with POAG. TGF‐β1 is highly expressed in glaucomatous TM cells and can be induced by mechanical stress (Liton et al. 2005; Fatma et al. 2009). Furthermore, the exposure of the TM to TGF‐β1 or TGF‐β2 increases the expression of fibronectin (FN1) (Fatma et al. 2009). CD44 is increased in the aqueous humour of patients with POAG (Mokbel et al. 2010). COL3A1 and COL1A1 are differentially expressed after exposure to oxidative stress, which is known to affect the TM in patients with POAG (Izzotti et al. 2006; Luna et al. 2009). Further, the allele frequencies of SERPINE1 are significantly different in patients with POAG compared to a control group (Zhou & Liu 2010). Lastly, PLAU is differentially expressed after exposure to dexamethasone or triamcinolone and it is known that patients with POAG are more susceptible to develop corticosteroid‐induced ocular hypertension (Tripathi et al. 1999; Fan et al. 2008). The association of the above‐mentioned genes with POAG suggests a role for the other identified genes as well.
In addition to the pathway analysis, we performed GO analysis. Gene Ontology (GO) annotations are based on the function of the differentially expressed genes. They do not have the level of detail of a known pathway diagram, but may add information where such detailed information is still lacking. ECM, inflammation and cell adhesion were found in this analysis as well. Complementary, we identified development and corticosteroid‐related clusters in our analysis. Studies have also shown that corticosteroids cause molecular changes in TM that increase the outflow resistance (Jones & Rhee 2006; Kersey & Broadway 2006).
The findings described in the publication of Liu et al. are of special interest as we used the dataset they made publically available. They investigated the functional distribution of the DEGs, using the Database for Annotation, Visualization and Integrated Discovery (DAVID) and showed that among others, cell adhesion, ECM, extracellular region, signal peptide, glycoprotein and secretion are involved in the pathogenesis of POAG (Liu et al. 2013). The GO analysis we performed in our study showed similar results. However, there are some discrepancies which might partially be explained by differences in defining the cut‐off for DEGs and the significance level of the GO terms.
The recently published study of Qiu et al. (2017) used the same publicly available dataset as we used for pathway and GO analysis. However, they did not describe quality checks and did not remove the patient with a MYOC mutation or the deviating control sample, from the database. In addition, they only used the KEGG database to perform pathway analysis. Our results add additional processes that have been confirmed by previous studies: ECM, inflammation, Rho GTPase and senescence, including each of the subcategories for the ECM and inflammation categories. Information on these processes might not be completely present in the KEGG database or they may be embedded in larger less specific pathways. The result of our study emphasizes the importance of performing a systematic step‐by‐step approach using multiple bioinformatics techniques and the benefits of combining knowledge from multiple pathway databases, in order to include the greatest possible coverage of knowledge and to obtain the most comprehensive results.
The final study to discuss is the study of Danford et al. (2017) which identified all genes that have a confirmed link with POAG through transcriptomics, genetic association, functional and genome‐wide association studies. After identification, the genes were classified according to their associated ocular tissue, including the TM. The study of Fan et al. investigated the differences in gene expression between TM cells treated with and without steroid and was excluded in the analysis in order to avoid study bias. The pathway analysis Danford et al. performed on their 64 identified TM tissue‐associated genes revealed the TGF‐β signalling pathway, ECM organization, and senescence and autophagy in cancer as the most overrepresented pathways in the TM. As discussed before, the ECM organization and senescence pathways were also identified in our study and TGF‐β is involved in thirteen of our significantly changed pathways.
One of the strengths of our study is that we integrated the pathway databases of WikiPathways, KEGG and Reactome into one collection. None of these databases captures the complete gene and pathway knowledge: 42.2% of the genes in this combined pathway collection are only covered in one of the three databases. This shows the importance of integrating the available databases. We chose WikiPathways, Reactome and KEGG as their pathways are of high quality, they all belong to the most extensive and commonly used pathway databases, and they provide their data in a machine‐readable format.
Furthermore, we performed an extensive quality check on the retrieved publicly available datasets to avoid that divergent samples or an overall insufficient quality would affect the results of our following analyses. The fact that only one dataset could be maintained, stresses the importance of and the need for extensive and systematic quality control, which is often missing when performing analysis on publicly available data.
In short, the purpose of this study was to systematically analyse available gene expression data of the TM in patients with POAG and controls. The analyses performed in this study provide a comprehensive overview of the processes involved in the molecular pathogenesis of POAG. These results show good face validity and confirm findings from histological, biochemical, genome‐wide association and transcriptomics studies. The appearance of already known points of action for drugs such as ROCK inhibitors, prostaglandins and corticosteroids in our results supports the validity of this approach and stresses its potential in the identification of new treatment options.
This study shows how findings from decades of biochemical and histological studies of POAG can be efficiently retrieved by applying state‐of‐the‐art bioinformatics to genome‐wide data, clearly indicating the power and promise of this approach.
Supporting information
Table S1. Complete results of the pathway analysis.
Table S2. Complete results of the GO analysis.
File S1. Quality control of dataset GSE4316 (Liton et al.).
Figure S1. Results of the quality control on the normalized data of dataset GSE4316, visualized in multiple plots.
File S2. Quality control of dataset GSE27276 (Liu et al.).
Figure S2. Results of the quality control on the normalized data of dataset GSE27276, visualized in multiple plots.
Figure S3. Histogram of the distribution of the average log‐scaled expression of the probes.
The authors thank Liu et al., Liton et al., and Diskin et al. and their contributors for their research, for making their data publicly available, and for the correspondence regarding data‐related questions. Preliminary results of this publication were presented at the European Conference on Computational Biology (ECCB) 2016, the Dutch ophthalmology conference (NOG) 2017 and 2018, and the Annual meeting of the Association for Research in Vision and Ophthalmology (ARVO) 2017.
References
- Ashburner M, Ball CA, Blake JA et al. (2000): Gene ontology: tool for the unification of biology. The Gene Ontology Consortium. Nat Genet 25: 25–29. [DOI] [PMC free article] [PubMed] [Google Scholar]
- Barrett T, Wilhite SE, Ledoux P et al. (2013): NCBI GEO: archive for functional genomics data sets–update. Nucleic Acids Res 41: D991–D995. [DOI] [PMC free article] [PubMed] [Google Scholar]
- Clark AF, Wilson K, McCartney MD, Miggans ST, Kunkle M & Howe W (1994): Glucocorticoid‐induced formation of cross‐linked actin networks in cultured human trabecular meshwork cells. Invest Ophthalmol Vis Sci 35: 281–294. [PubMed] [Google Scholar]
- Danford ID, Verkuil LD, Choi DJ et al. (2017): Characterizing the “POAGome”: a bioinformatics‐driven approach to primary open‐angle glaucoma. Prog Retin Eye Res 58: 89–114. [DOI] [PMC free article] [PubMed] [Google Scholar]
- Diskin S, Kumar J, Cao Z, Schuman JS, Gilmartin T, Head SR & Panjwani N (2006): Detection of differentially expressed glycogenes in trabecular meshwork of eyes with primary open‐angle glaucoma. Invest Ophthalmol Vis Sci 47: 1491–1499. [DOI] [PMC free article] [PubMed] [Google Scholar]
- Eden E, Navon R, Steinfeld I, Lipson D & Yakhini Z (2009): GOrilla: a tool for discovery and visualization of enriched GO terms in ranked gene lists. BMC Bioinformatics 10: 48. [DOI] [PMC free article] [PubMed] [Google Scholar]
- Edgar R, Domrachev M & Lash AE (2002): Gene Expression Omnibus: NCBI gene expression and hybridization array data repository. Nucleic Acids Res 30: 207–210. [DOI] [PMC free article] [PubMed] [Google Scholar]
- Eijssen LM, Jaillard M, Adriaens ME, Gaj S, de Groot PJ, Muller M & Evelo CT (2013): User‐friendly solutions for microarray quality control and pre‐processing on ArrayAnalysis.org. Nucleic Acids Res 41: W71–W76. [DOI] [PMC free article] [PubMed] [Google Scholar]
- Fabregat A, Sidiropoulos K, Garapati P et al. (2016): The reactome pathway knowledgebase. Nucleic Acids Res 44: D481–D487. [DOI] [PMC free article] [PubMed] [Google Scholar]
- Fan BJ, Wang DY, Tham CC, Lam DS & Pang CP (2008): Gene expression profiles of human trabecular meshwork cells induced by triamcinolone and dexamethasone. Invest Ophthalmol Vis Sci 49: 1886–1897. [DOI] [PubMed] [Google Scholar]
- Fatma N, Kubo E, Toris CB, Stamer WD, Camras CB & Singh DP (2009): PRDX6 attenuates oxidative stress‐ and TGFbeta‐induced abnormalities of human trabecular meshwork cells. Free Radic Res 43: 783–795. [DOI] [PMC free article] [PubMed] [Google Scholar]
- Fuchshofer R & Tamm ER (2009): Modulation of extracellular matrix turnover in the trabecular meshwork. Exp Eye Res 88: 683–688. [DOI] [PubMed] [Google Scholar]
- Hubackova S, Krejcikova K, Bartek J & Hodny Z (2012): IL1‐ and TGFbeta‐Nox4 signaling, oxidative stress and DNA damage response are shared features of replicative, oncogene‐induced, and drug‐induced paracrine ‘bystander senescence’. Aging (Albany NY) 4: 932–951. [DOI] [PMC free article] [PubMed] [Google Scholar]
- van Iersel MP, Kelder T, Pico AR, Hanspers K, Coort S, Conklin BR & Evelo C (2008): Presenting and exploring biological pathways with PathVisio. BMC Bioinformatics 9: 399. [DOI] [PMC free article] [PubMed] [Google Scholar]
- Inoue T & Tanihara H (2013): Rho‐associated kinase inhibitors: a novel glaucoma therapy. Prog Retin Eye Res 37: 1–12. [DOI] [PubMed] [Google Scholar]
- Izzotti A, Bagnis A & Sacca SC (2006): The role of oxidative stress in glaucoma. Mutat Res 612: 105–114. [DOI] [PubMed] [Google Scholar]
- Jones R 3rd & Rhee DJ (2006): Corticosteroid‐induced ocular hypertension and glaucoma: a brief review and update of the literature. Curr Opin Ophthalmol 17: 163–167. [DOI] [PubMed] [Google Scholar]
- Kanehisa M & Goto S (2000): KEGG: kyoto encyclopedia of genes and genomes. Nucleic Acids Res 28: 27–30. [DOI] [PMC free article] [PubMed] [Google Scholar]
- Kanehisa M, Sato Y, Kawashima M, Furumichi M & Tanabe M (2016): KEGG as a reference resource for gene and protein annotation. Nucleic Acids Res 44: D457–D462. [DOI] [PMC free article] [PubMed] [Google Scholar]
- Kanehisa M, Furumichi M, Tanabe M, Sato Y & Morishima K (2017): KEGG: new perspectives on genomes, pathways, diseases and drugs. Nucleic Acids Res 45: D353–D361. [DOI] [PMC free article] [PubMed] [Google Scholar]
- Kelder T, van Iersel MP, Hanspers K, Kutmon M, Conklin BR, Evelo CT & Pico AR (2012): WikiPathways: building research communities on biological pathways. Nucleic Acids Res 40: D1301–D1307. [DOI] [PMC free article] [PubMed] [Google Scholar]
- Kersey JP & Broadway DC (2006): Corticosteroid‐induced glaucoma: a review of the literature. Eye (Lond) 20: 407–416. [DOI] [PubMed] [Google Scholar]
- Kolesnikov N, Hastings E, Keays M et al. (2015): ArrayExpress update–simplifying data submissions. Nucleic Acids Res 43: D1113–D1116. [DOI] [PMC free article] [PubMed] [Google Scholar]
- Kutmon M, van Iersel MP, Bohler A, Kelder T, Nunes N, Pico AR & Evelo CT (2015): PathVisio 3: an extendable pathway analysis toolbox. PLoS Comput Biol 11: e1004085. [DOI] [PMC free article] [PubMed] [Google Scholar]
- Kutmon M, Riutta A, Nunes N et al. (2016): WikiPathways: capturing the full diversity of pathway knowledge. Nucleic Acids Res 44: D488–D494. [DOI] [PMC free article] [PubMed] [Google Scholar]
- Last JA, Pan T, Ding Y et al. (2011): Elastic modulus determination of normal and glaucomatous human trabecular meshwork. Invest Ophthalmol Vis Sci 52: 2147–2152. [DOI] [PMC free article] [PubMed] [Google Scholar]
- Liton PB, Liu X, Challa P, Epstein DL & Gonzalez P (2005): Induction of TGF‐beta1 in the trabecular meshwork under cyclic mechanical stress. J Cell Physiol 205: 364–371. [DOI] [PMC free article] [PubMed] [Google Scholar]
- Liton PB, Luna C, Challa P, Epstein DL & Gonzalez P (2006): Genome‐wide expression profile of human trabecular meshwork cultured cells, nonglaucomatous and primary open angle glaucoma tissue. Mol Vis 12: 774–790. [PMC free article] [PubMed] [Google Scholar]
- Liu Y, Allingham RR, Qin X et al. (2013): Gene expression profile in human trabecular meshwork from patients with primary open‐angle glaucoma. Invest Ophthalmol Vis Sci 54: 6382–6389. [DOI] [PMC free article] [PubMed] [Google Scholar]
- Liu B, McNally S, Kilpatrick JI, Jarvis SP & O'Brien CJ (2017): Aging and ocular tissue stiffness in glaucoma. Surv Ophthalmol 63: 56–74. [DOI] [PubMed] [Google Scholar]
- Luna C, Li G, Qiu J, Epstein DL & Gonzalez P (2009): Role of miR‐29b on the regulation of the extracellular matrix in human trabecular meshwork cells under chronic oxidative stress. Mol Vis 15: 2488–2497. [PMC free article] [PubMed] [Google Scholar]
- Micera A, Quaranta L, Esposito G et al. (2016): Differential Protein Expression Profiles in Glaucomatous Trabecular Meshwork: an Evaluation Study on a Small Primary Open Angle Glaucoma Population. Adv Ther 33: 252–267. [DOI] [PMC free article] [PubMed] [Google Scholar]
- Milacic M, Haw R, Rothfels K, Wu G, Croft D, Hermjakob H, D'Eustachio P & Stein L (2012): Annotating cancer variants and anti‐cancer therapeutics in reactome. Cancers (Basel) 4: 1180–1211. [DOI] [PMC free article] [PubMed] [Google Scholar]
- Mokbel TH, Ghanem AA, Kishk H, Arafa LF & El‐Baiomy AA (2010): Erythropoietin and soluble CD44 levels in patients with primary open‐angle glaucoma. Clin Exp Ophthalmol 38: 560–565. [DOI] [PubMed] [Google Scholar]
- Morgan JT, Raghunathan VK, Chang YR, Murphy CJ & Russell P (2015): The intrinsic stiffness of human trabecular meshwork cells increases with senescence. Oncotarget 6: 15362–15374. [DOI] [PMC free article] [PubMed] [Google Scholar]
- Qiu H, Zhu B & Ni S (2017): Identification of genes associated with primary open‐angle glaucoma by bioinformatics approach. Int Ophthalmol 38: 19–28. [DOI] [PubMed] [Google Scholar]
- R Core Team (2013): R: A language and environment for statistical computing. In: Computing RFfS (ed.). Vienna, Austria: R Core Team. [Google Scholar]
- Rao PV, Pattabiraman PP & Kopczynski C (2017): Role of the Rho GTPase/Rho kinase signaling pathway in pathogenesis and treatment of glaucoma: bench to bedside research. Exp Eye Res 158: 23–32. [DOI] [PMC free article] [PubMed] [Google Scholar]
- Ritchie ME, Phipson B, Wu D, Hu Y, Law CW, Shi W & Smyth GK (2015): limma powers differential expression analyses for RNA‐sequencing and microarray studies. Nucleic Acids Res 43: e47. [DOI] [PMC free article] [PubMed] [Google Scholar]
- Rohen JW, Futa R & Lutjen‐Drecoll E (1981): The fine structure of the cribriform meshwork in normal and glaucomatous eyes as seen in tangential sections. Invest Ophthalmol Vis Sci 21: 574–585. [PubMed] [Google Scholar]
- Sethi A, Mao W, Wordinger RJ & Clark AF (2011): Transforming growth factor‐beta induces extracellular matrix protein cross‐linking lysyl oxidase (LOX) genes in human trabecular meshwork cells. Invest Ophthalmol Vis Sci 52: 5240–5250. [DOI] [PMC free article] [PubMed] [Google Scholar]
- Shannon P, Markiel A, Ozier O et al. (2003): Cytoscape: a software environment for integrated models of biomolecular interaction networks. Genome Res 13: 2498–2504. [DOI] [PMC free article] [PubMed] [Google Scholar]
- Sommer A, Tielsch JM, Katz J, Quigley HA, Gottsch JD, Javitt J & Singh K (1991): Relationship between intraocular pressure and primary open angle glaucoma among white and black Americans. The Baltimore Eye Survey. Arch Ophthalmol 109: 1090–1095. [DOI] [PubMed] [Google Scholar]
- Tamm ER, Siegner A, Baur A & Lutjen‐Drecoll E (1996): Transforming growth factor‐beta 1 induces alpha‐smooth muscle‐actin expression in cultured human and monkey trabecular meshwork. Exp Eye Res 62: 389–397. [DOI] [PubMed] [Google Scholar]
- Taurone S, Ripandelli G, Pacella E et al. (2015): Potential regulatory molecules in the human trabecular meshwork of patients with glaucoma: immunohistochemical profile of a number of inflammatory cytokines. Mol Med Rep 11: 1384–1390. [DOI] [PubMed] [Google Scholar]
- Tektas OY & Lutjen‐Drecoll E (2009): Structural changes of the trabecular meshwork in different kinds of glaucoma. Exp Eye Res 88: 769–775. [DOI] [PubMed] [Google Scholar]
- Toris CB, Gabelt BT & Kaufman PL (2008): Update on the mechanism of action of topical prostaglandins for intraocular pressure reduction. Surv Ophthalmol 53(Suppl1): S107–S120. [DOI] [PMC free article] [PubMed] [Google Scholar]
- Tripathi RC, Parapuram SK, Tripathi BJ, Zhong Y & Chalam KV (1999): Corticosteroids and glaucoma risk. Drugs Aging 15: 439–450. [DOI] [PubMed] [Google Scholar]
- de Voogd S, Ikram MK, Wolfs RC, Jansonius NM, Hofman A & de Jong PT (2005): Incidence of open‐angle glaucoma in a general elderly population: the Rotterdam Study. Ophthalmology 112: 1487–1493. [DOI] [PubMed] [Google Scholar]
- Wang N, Chintala SK, Fini ME & Schuman JS (2001): Activation of a tissue‐specific stress response in the aqueous outflow pathway of the eye defines the glaucoma disease phenotype. Nat Med 7: 304–309. [DOI] [PMC free article] [PubMed] [Google Scholar]
- Wang WH, McNatt LG, Pang IH, Hellberg PE, Fingert JH, McCartney MD & Clark AF (2008): Increased expression of serum amyloid A in glaucoma and its effect on intraocular pressure. Invest Ophthalmol Vis Sci 49: 1916–1923. [DOI] [PubMed] [Google Scholar]
- Wang J, Liu X & Zhong Y (2013): Rho/Rho‐associated kinase pathway in glaucoma (Review). Int J Oncol 43: 1357–1367. [DOI] [PubMed] [Google Scholar]
- Young AR & Narita M (2009): SASP reflects senescence. EMBO Rep 10: 228–230. [DOI] [PMC free article] [PubMed] [Google Scholar]
- Zhou G & Liu B (2010): Single nucleotide polymorphisms of metabolic syndrome‐related genes in primary open angle glaucoma. Int J Ophthalmol 3: 36–42. [DOI] [PMC free article] [PubMed] [Google Scholar]
Associated Data
This section collects any data citations, data availability statements, or supplementary materials included in this article.
Supplementary Materials
Table S1. Complete results of the pathway analysis.
Table S2. Complete results of the GO analysis.
File S1. Quality control of dataset GSE4316 (Liton et al.).
Figure S1. Results of the quality control on the normalized data of dataset GSE4316, visualized in multiple plots.
File S2. Quality control of dataset GSE27276 (Liu et al.).
Figure S2. Results of the quality control on the normalized data of dataset GSE27276, visualized in multiple plots.
Figure S3. Histogram of the distribution of the average log‐scaled expression of the probes.