

SUMMARY
Protein degradation via the use of bivalent chemical degraders provides an alternative strategy to block protein function and assess the biological roles of putative drug targets. This approach capitalizes on the advantages of small molecule inhibitors while moving beyond the restrictions of traditional pharmacology. Herein we report a first-in-class chemical degrader (UNC6852) that targets Polycomb Repressive Complex 2 (PRC2). UNC6852 contains an EED226 derived ligand and a ligand for VHL which bind to the WD40 aromatic cage of EED and CRL2VHL, respectively, to induce proteasomal degradation of PRC2 components, EED, EZH2, and SUZ12. Degradation of PRC2 with UNC6852 blocks the histone methyltransferase activity of EZH2, decreasing H3K27me3 levels in HeLa cells and diffuse large B-cell lymphoma (DLBCL) cells containing EZH2 gain-of-function mutations. UNC6852 degrades both wild type and mutant EZH2, and additionally displays anti-proliferative effects in this cancer model system.
Keywords: Embryonic Ectoderm Development (EED), Enhancer of Zeste Homolog 2 (EZH2), Suppressor of Zeste Homolog 12 (SUZ12), Polycomb Repressive Complex 2 (PRC2), bivalent chemical degrader, von-Hippel Lindau (VHL), diffuse large B-cell lymphoma (DLBCL), histone methyltransferase (HMT)
INTRODUCTION
Polycomb Repressive Complex 2 (PRC2) is a multicomponent complex with histone methyltransferase (HMT) activity that installs and maintains mono-through trimethylation at histone 3 lysine 27 (H3K27). H3K27 trimethylation (H3K27me3) is a key mechanism responsible for gene repression (Ferrari et al., 2014). The catalytic activity of PRC2 is dependent on the formation of a complex containing three core subunits: Embryonic Ectoderm Development (EED), Enhancer of Zeste Homolog 1 (EZH1) or EZH2, and Suppressor of Zeste Homolog 12 (SUZ12) (Margueron and Reinberg, 2011). EZH1 and EZH2 share significant sequence homology and both HMTs can be incorporated into PRC2 to generate an active complex; however, EZH1 has a lower abundance and often lesser HMT activity as compared to EZH2 (Margueron et al., 2008; Lee et al., 2018). Other proteins commonly associated with PRC2 include Jumonji and AT-rich interacting Domain 2 (JARID2), (Peng et al., 2009) PHD finger protein 19 (PHF19), and AE Binding Protein 2 (AEBP2) (Hyun et al., 2017). Structural elucidation of PRC2 revealed an intricate network of protein-protein interactions between EED, EZH2 and SUZ12 which are necessary for PRC2 catalytic activity (Liu, 2015; Justin et al., 2016; Kasinath et al., 2018; Poepsel, Kasinath and Nogales, 2018). Specifically, EED recognition of H3K27me3 via its WD40 domain serves to stabilize the stimulation responsive motif (SRM) of EZH2 and allosterically activates the SET domain of EZH2 for trimethylation of H3K27 on adjacent nucleosomes (Justin et al., 2016).
PRC2 has been reported as both an oncogene and suppressor of tumorigenesis in an assortment of cancer types (Gan et al., 2018). EZH2, EED, and SUZ12 are commonly upregulated in certain cancers such as breast, colorectal, and prostate cancer (Liu et al., 2015; Gan et al., 2018). Overexpression of EZH2 and elevated levels of H3K27me3 have been linked to both increased cell proliferation and chemotherapy resistance which can result in low survival rates. EED, EZH2, and SUZ12 are also susceptible to mutations in cancer. For example, EZH2 gain-of-function mutations are commonly associated with lymphomas. Heterozygous EZH2 gain-of-function mutations in the C-terminal SET domain occur at Y641, A677, and A687, and lead to EZH2 hyperactivity, an increase in global H3K27me3 levels, and aberrant gene repression (Veneti, Gkouskou and Eliopoulos, 2017). Diffuse Large B-cell Lymphomas (DLBCL) commonly harbour these mutations, marking EZH2 as an important target for therapeutic intervention (McCabe et al., 2012).
Effective inhibition of PRC2 catalytic activity has been achieved by targeting both EED and EZH2. While initial efforts were focused on developing inhibitors of the catalytic SET domain of EZH2 (Genta, Pirosa and Stathis, 2019), it was recently demonstrated that small molecule antagonists of the EED WD40 domain could phenocopy EZH2 inhibitors due to the critical role of EED in regulating PRC2 activity (He et al., 2017; Qi et al., 2017). EED and EZH2 inhibition have each been shown to reduce global H3K27me3 levels and result in antiproliferative effects in EED and EZH2 wild type (WT) cancer cell lines, as well as cell lines with EZH2 gain-of-function mutations (Xu et al., 2015; He et al., 2017; Shortt et al., 2017; Lee et al., 2018). EZH2 inhibitors that bind the SET domain include chemical probes such as UNC1999, as well as several compounds in clinical development including GSK126, EPZ-6438 (Tazemostat), CPI-1205, and DS-3201b (Valemostat), which have been particularly effective in lymphomas with activating EZH2 mutations (McCabe et al., 2012; Konze et al., 2013; Dilworth and Barsyte-Lovejoy, 2019; Genta, Pirosa and Stathis, 2019). More recently, EED chemical probes EED226 and A-395 were reported, and currently MAK683, an analogue of EED226, is in the clinic for similar applications (He et al., 2017; Huang et al., 2017; Dilworth and Barsyte-Lovejoy, 2019). Resistance to EZH2 inhibitors has been observed in the clinic and is one limitation to this class of SAM-competitive molecules; however, EED antagonists have the potential to overcome this acquired resistance (Brooun et al., 2016; Lee et al., 2018). Overall, targeting PRC2 for cancer treatment has been shown to be an effective strategy, yet new approaches are needed to overcome observed resistance to EZH2 inhibitors and to develop novel therapeutics.
Bivalent chemical protein degraders, otherwise known as PROTACs™, are molecules designed to degrade a specific endogenous protein of interest (POI) by harnessing the E3 Ubiquitin ligase pathway (Cromm and Crews, 2017; Salami and Crews, 2017). Bivalent protein degraders are composed of a ligand for the desired POI, an E3 ligase ligand, and an optimized linker connecting the two ligands. The most extensively used E3 ligase recruiting ligands include VH032 and pomalidomide, which are responsible for recruitment of von-Hippel Lindau (VHL) as part of the CRL2VHL E3 ubiquitin ligase complex and cereblon (CRBN) as part of the CRL4CRBN E3 ubiquitin ligase complex, respectively (Fischer et al., 2014; Cardote, Gadd and Ciulli, 2017; Cromm and Crews, 2017). The linker region typically consists of a flexible alkyl or polyethylene glycol (PEG) moiety, although other linkers have been explored. These bifunctional molecules bring the POI into close proximity with the E3 ligase recruiting protein to form a ternary complex, which allows the E3 ligase Cullin ring complex to ubiquitylate a lysine residue on the POI, thereby tagging the protein for proteasomal degradation (Gadd et al., 2017). Positive cooperativity of ternary complex formation between these proteins and the subsequent ubiquitylation of an available lysine are both important factors for efficient proteasomal degradation. Additionally, chemical degraders act catalytically which compensates for their inherently low cell permeability (Bondeson et al., 2015; Riching et al., 2018). Because they are catalytic and don’t require very high-affinity for their POI, bivalent chemical degraders have the potential to facilitate degradation of previously ‘undruggable’ targets and represent a promising therapeutic strategy. Just recently, the first PROTAC™ entered the clinic for the treatment of metastatic castration-resistant prostate cancer (Mullard, 2019), demonstrating that the anticipated pharmacokinetic challenges due to their high molecular mass can be overcome. Due to the availability of ligands for both EZH2 and EED, we postulated that the development of bivalent degraders could be an effective alternative strategy to inhibit PRC2 function.
Herein we describe the design, synthesis, and evaluation of a PRC2 bivalent chemical degrader based on the potent EED ligand EED226 which effectively degrades EED, EZH2, and SUZ12 in a VHL-dependent fashion, reduces H3K27me3 levels, and decreases proliferation of DB and Pfeiffer cells which are DLBCL cell lines harboring EZH2 activating mutations. Together, these results demonstrate the feasibility of developing PRC2-targeted degraders to block PRC2 function, to interrogate PRC2 biology, and as potential therapeutics.
RESULTS
Design and Synthesis of EED-Targeted Bivalent Degraders
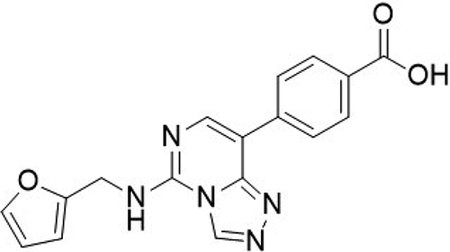
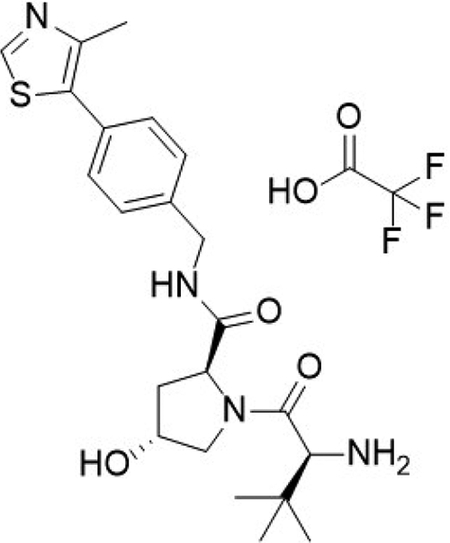
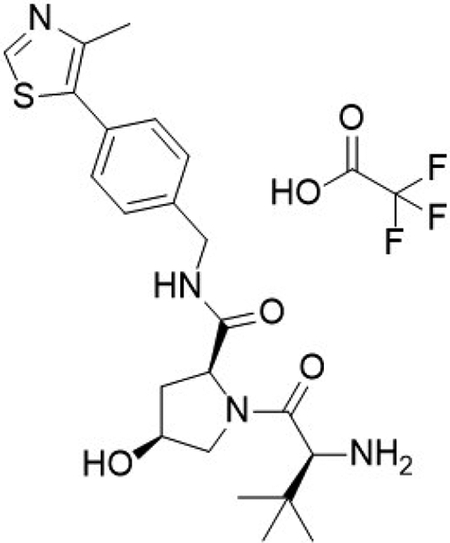
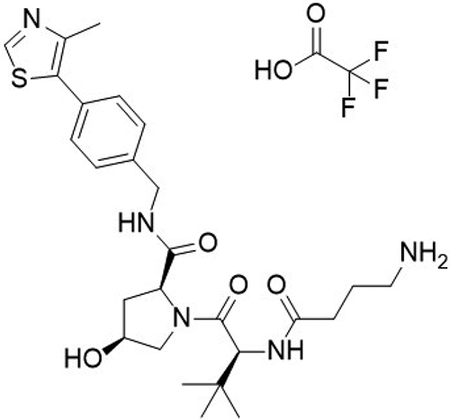
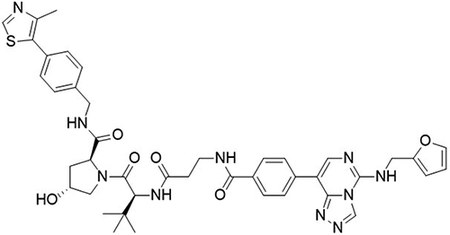
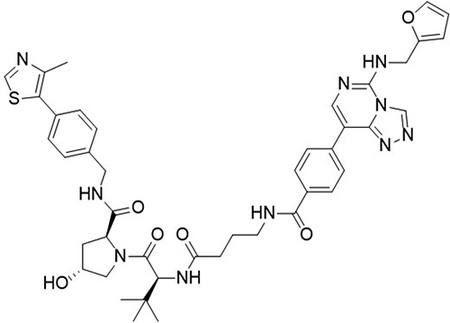
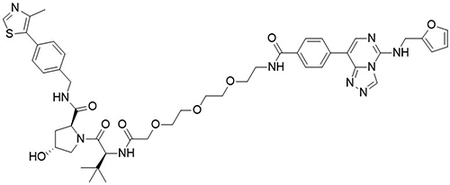
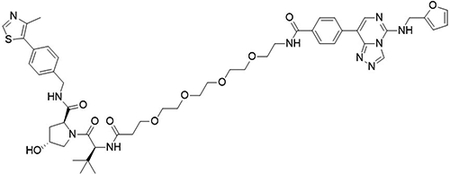
Based upon the successful development of potent ligands for EED which function as allosteric inhibitors of PRC2 and the emerging field of bivalent chemical degraders, we designed and synthesized a series of heterobifunctional EED-targeted chemical degraders. These compounds are comprised of an analogue of a known EED ligand, EED226, and VH032-amine, a ligand which has been successfully employed in numerous examples for CRL2VHL recruitment (Figure 1) (Frost et al., 2016; Qi et al., 2017; An and Fu, 2018; Zou, Ma and Wang, 2019). We first needed to identify an exit vector on EED226 that would be synthetically amenable to functionalization with a linker moiety without a significant loss in potency. A crystal structure of EED226 bound to the WD40 domain of EED indicated that the sulfone moiety of EED226 is solvent exposed, providing a potential site for functionalization (PDB: 5GSA, Qi et al. 2017). VHL ligands have several known functionalization sites based on their prior incorporation into bivalent degraders providing multiple possible exit vectors. Importantly, the exit vector chosen can have a large impact on ternary complex formation (Cromm and Crews, 2017; Chan et al., 2018; Smith et al., 2019). Functionalization off of the terminal amine of VH032 has been extensively used in the design of bivalent degraders so we chose this position for linker appendage (Frost et al., 2016; Chan et al., 2018; Girardini et al., 2019). To connect the two ligands, different length alkyl (UNC6851-UNC6853) and PEG linkers (UNC6845-UNC6847) were incorporated to assess the distance required to induce successful EED degradation upon formation of the EED-degrader-VHL ternary complex (Table 1) (Cyrus et al., 2011). To enable this approach, we synthesized a carboxylic acid functionalized EED ligand via a Suzuki-Miyaura reaction with (4-(methoxycarbonyl)phenyl)boronic acid and 8-bromo-N-(furan-2-ylmethyl)-[1,2,4]triazolo[4,3-c]pyrimidin-5-amine (1) and subsequent basic hydrolysis to yield (2) (Scheme S1). VH032-amine (3) was reacted with the various N-Boc alkyl and PEG linkers followed by deprotection (4 – 9). Assembly of the final compounds was achieved by an amidation reaction to afford UNC6851, UNC6852, UNC6853, UNC6845, UNC6846, and UNC6847 (Scheme S2).
Figure 1. Chemical structures of UNC6852 and UNC7043.

(A) UNC6852 is a bivalent chemical degrader of PRC2 containing an EED ligand (green) and a VHL ligand (coral). (B) UNC7043 is a corresponding inactive control compound which contains a cis-hydroxyproline amino acid, abrogating binding to VHL.
Table 1. Analysis of the extent of EED binding and degradation with 6 EED-targeted degraders.
EED IC50 values were determined by TR-FRET and are reported as the average of two biological replicates ± standard deviation. EED degradation (%) was evaluated in HeLa cells dosed with 5 μM compound for 24 hrs. Results were quantified based on western blot analysis in Figure S3C, D. EED percent degradation is reported as the average of two biological replicates ± standard deviation.
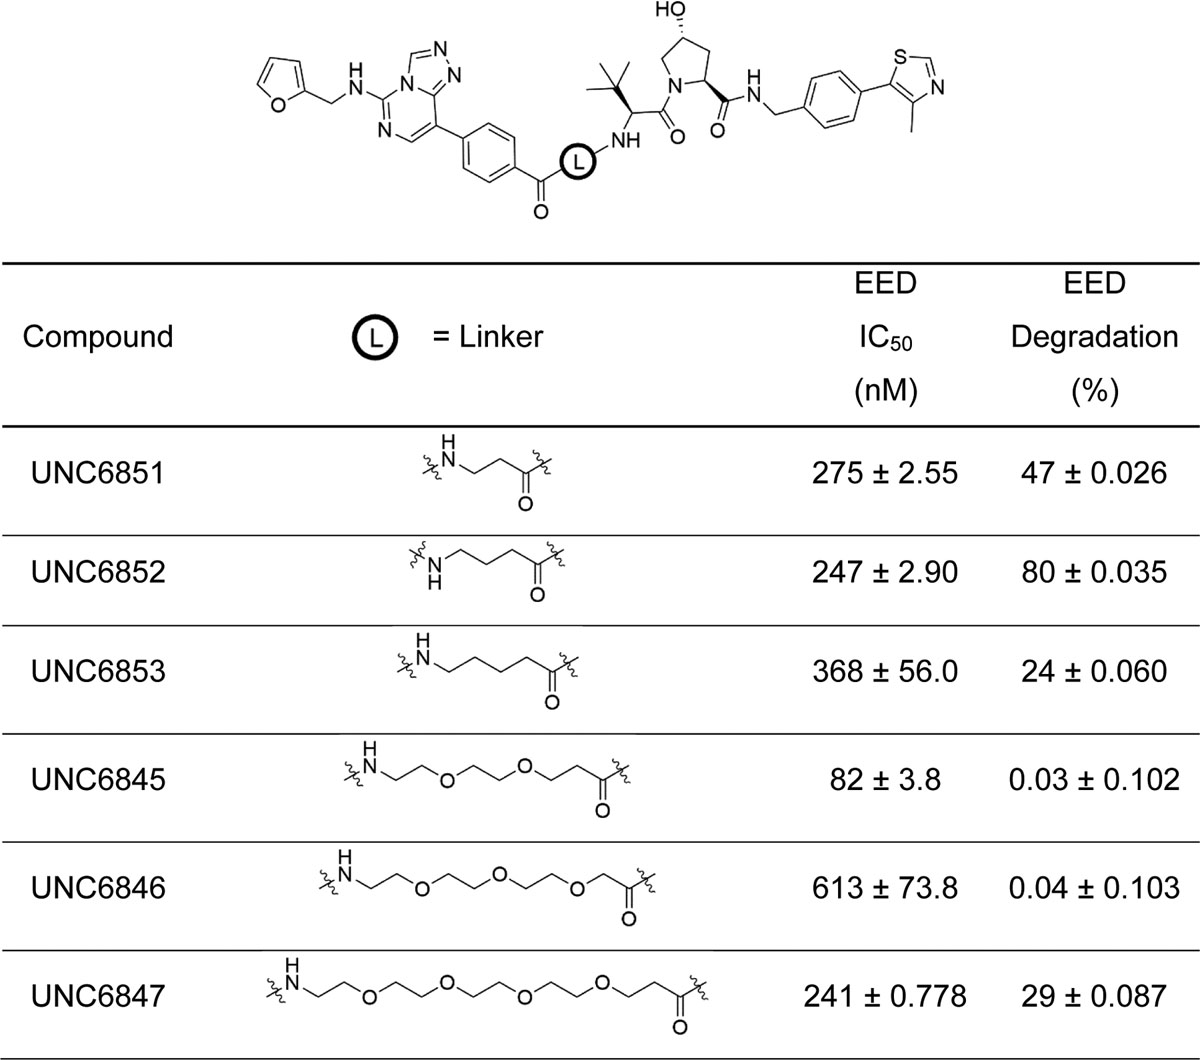 |
Initially we confirmed that our bivalent molecules still potently bound to the WD40 domain of EED via a time-resolved fluorescence resonance energy transfer (TR-FRET) assay. In this assay we used 6XHis-tagged recombinant EED (residues 1 – 441) and a biotinylated EED ligand previously developed in our lab (UNC5114-biotin, Barnash et al. 2017) which were conjugated to a fluorophore labelled anti-6XHis antibody (acceptor) and europium labelled streptavidin (donor), respectively. EED226 was used as a positive control and displayed potencies comparable to literature reported values (Figure S1, IC50 = 45 nM; reported IC50 = 22 nM) (Huang et al., 2017). We also synthesized a negative control EED ligand, UNC5679, which showed no significant binding within the concentrations tested and is greater than 200-fold less potent than EED226 (Figure S1, IC50 = >10 μM; reported IC50 = 20.49 μM) (Huang et al., 2017). Alkyl linked compounds UNC6851, UNC6852, and UNC6853 showed a 6-fold, 5.5-fold, and 8-fold loss in potency compared to EED226, respectively. PEG linked compounds UNC6845, UNC6846, and UNC6847 revealed a 2-fold, 14-fold, and 5-fold loss in potency, respectively. Overall, these data confirm that our bivalent molecules are sufficiently potent binders of the WD40 domain of EED, and therefore should be able to engage EED as the first step in initiating the E3 ligase mediated proteasomal degradation pathway.
UNC6852 Mediates PRC2 Degradation
Next, we sought to assess the ability of our six bivalent molecules to enable EED degradation. To do so, we first performed extensive antibody validation studies utilizing overexpression systems to identify EED and EZH2 antibodies that were both compatible with the Jess™ system for automated protein analysis (ProteinSimple) and suitable for follow-up studies (Figure S2). HeLa lysates were then generated from cells treated with bivalent degraders (5 μM) for 4, 24, and 48 hrs and screened on the Jess™ system (Figure S3A, B), which allows for the analysis of protein degradation in a more high-throughput fashion than traditional western blotting experiments. Due to the close proximity of EZH2 residues to the EED226 binding site, we speculated that EED226-derived degraders may additionally facilitate EZH2 degradation, and therefore both EED and EZH2 protein levels were monitored. Encouragingly, these data indicated that UNC6851 and UNC6852 resulted in a decrease in the levels of both EED and EZH2 at 24 hrs, with UNC6852 having a more pronounced effect than UNC6851 at shorter and longer time points (4 and 48 hours, Figure S3A, B). These compounds differ by a single CH2 group in the linker, with UNC6851 containing a 2-methylene linker and UNC6852 a 3-methylene linker. In contrast, significant degradation was not observed with UNC6853 which contains a slightly longer 4-methylene linker, highlighting that even minor variations in a linker moiety can significantly impact degradation efficiency. The bivalent molecules with PEG linkers (UNC6845, UNC6846, and UNC6847), all of which are longer than the 4-methylene linker of UNC6853, were similarly unable to alter the levels of EED or EZH2 under these conditions. To validate these results, we performed traditional western blot analysis, evaluating EED and EZH2 protein levels after treatment with each of the six degraders for 24 hours. UNC6852 was again identified as the most proficient degrader of EED (80% degradation, Table 1, Figure S3C, D) and EZH2 (76%) under these conditions.
To further investigate the degradation potential of UNC6852, we evaluated EED and EZH2 levels upon treatment with UNC6852 in a dose response format at 24 hrs and over various times at a fixed concentration (10 μM) by western blot analysis (Figure 2, Figure S4). Upon treatment of HeLa cells with UNC6852, no cellular toxicity was observed at concentrations up to 30 μM. UNC6852 was capable of degrading EED and EZH2 to varying extents at different concentrations and time points. EED and EZH2 degradation occurred at similar concentrations of UNC6852, with DC50 values (the concentration at which 50% degradation was observed) of 0.79 ± 0.14 μM and 0.3 ± 0.19 μM, respectively (Figures S4B, G). The maximal degradation observed (Dmax) was slightly higher for EED (92%) than EZH2 (75%) and interestingly, EED was also degraded at earlier time points than EZH2, with apparent half-lives (t1/2) of 0.81 ± 0.30 hours and 1.92 ± 0.96 hours, respectively (Figures S4A, G).
Figure 2. UNC6852 degrades PRC2 components EED, EZH2, and SUZ12 in HeLa cells.

(A) Western blot analysis of PRC2 components following UNC6852 treatment in a dose response fashion (0 – 30 μM, 24 hours). (B) Western blot analysis of PRC2 components following treatment of UNC6852 (10 μM) from 2 to 72 hrs. Data are representative of at least two biological replicates. Quantification of these results are reported in Supplementary Figure S4.
SUZ12 is the third core component of PRC2, and thus we were equally interested in determining if UNC6852 can effectively degrade SUZ12. In the dose response and time course studies described above, we found that SUZ12 was degraded by UNC6852 but to a lesser extent than both EED and EZH2 (Figure 2, Figure S4). We were unable to calculate the DC50 and half-life for SUZ12 due to a maximal degradation of only 22%.
UNC6852 Facilitates PRC2 Degradation via VHL Recruitment
To confirm that UNC6852 is facilitating degradation of PRC2 via the ubiquitin-proteasomal degradation pathway induced by CRL2VHL E3 ligase recruitment, we utilized proteasome inhibitors and an inactive heterobifunctional control compound (UNC7043, Figure 1). We designed and synthesized UNC7043, which is structurally identical to UNC6852 except that it contains the opposite enantiomer at the hydroxyproline moiety on the VHL ligand (Scheme S2). This subtle change to VH032 disables ligand binding to VHL, and hence when incorporated into a bivalent molecule, no longer recruits VHL. As expected, UNC7043 treatment did not degrade EED, EZH2, or SUZ12 when HeLa cells were dosed at 10 μM for 24 hrs (Figure 3A). This result further established that UNC6852-mediated degradation of PRC2 is occurring via the CRL2VHL based ubiquitin-proteasomal degradation pathway.
Figure 3. PRC2 components are not degraded upon treatment with proteasome inhibitors or negative control compound UNC7043.

(A) Western blot analysis of PRC2 components upon treatment of HeLa cells with UNC6852 and negative control compound UNC7043 (10 μM for 24 hours). (B) Western blot analysis of PRC2 components in HeLa cells pre-treated with proteasome inhibitors MLN4924 (1 μM for 7 hours), Carfilzomib and MG-132 (5 μM for 4.5 hours), followed by UNC6852 4 hrs at 10 μM. Data are representative of at least two biological replicates.
Additionally, pre-treatment with proteasome inhibitors MLN4924, Carfilzomib, and MG-132 prior to addition of UNC6852 effectively blocked EED and EZH2 degradation, again confirming the proposed degradation mechanism (Figure 3B). Specifically, HeLa cells were pre-treated for 7 hrs with MLN4924 (Pevonedistat) and 4.5 hrs with Carfilzomib or MG-132 to halt cellular ubiquitylation mechanisms prior to addition of UNC6852 for 4 hrs. Degradation effects could not be evaluated at longer time points due to the toxicity inherent to these proteasome inhibitors (Maniaci et al., 2017; Huang et al., 2018). While it has been previously reported that proteasome inhibitor treatment can decrease endogenous EZH2 levels, treatment of HeLa cells with proteasome inhibitors alone did not change EZH2 levels under these conditions (Rizq et al., 2017).
UNC6852 selectively degrades EED and EZH2
To assess the effects of UNC6852 treatment on cellular protein levels more broadly, we performed global proteomics experiments using tandem mass tag (TMT) quantification comparing HeLa cells treated with UN6852 (10 μM, 24 hrs) to DMSO treated control cells. Whole proteome analysis resulted in the identification of >60,000 peptides corresponding to 5,452 quantifiable proteins. Notably, these data revealed that EED and EZH2 were selectively degraded by UNC6852 within the proteome (Figure 4). Significant degradation was defined by a p-value of <0.01 and a log2 fold change ratio of −0.5 (UNC6852 treated/DMSO treated). Although SUZ12 did not meet these criteria (log2 fold change = −0.34), modest SUZ12 degradation (21%) was observed which is consistent with our previously determined Dmax value via western blot analysis (Dmax = 22%, Figure S4). Additionally, we were interested in evaluating the ability of UNC6852 to degrade EZH1 due to its significant sequence homology with EZH2; however, EZH1 was not identified in the proteomics analysis, presumably due to low levels of EZH1 expression as we were also unable to detect EZH1 by western blot. Overall, this confirms that UNC6852 selectively degrades PRC2 via the E3 ligase ubiquitylation pathway.
Figure 4. UNC6852 selectively degrades PRC2.

Quantitative proteomics results showing relative abundance of proteins in HeLa cells treated with DMSO, UNC6852, or UNC7043 (10 μM, 24 hrs). Of the total 5,452 quantifiable proteins, EED and EZH2 were selectively degraded by UNC6852 within the proteome. Significant degradation was defined by a p-value of <0.01 and a log2 fold change ratio of −0.5 (UNC6852 treated/DMSO treated). Data shown are three replicates measured in a single 10-plex TMT experiment.
UNC6852 reduces H3K27me3 levels and DLBCL cell proliferation
We next sought to investigate the effects of PRC2 degradation on H3K27me3 levels and cellular proliferation. We first treated HeLa cells with UNC6852, EED226, and UNC1999, a potent EZH1/2 inhibitor, over a time course of 24 to 72 hrs at 10 μM to monitor H3K27me3 levels by western blot. As expected, UNC6852 resulted in a decrease in protein levels of both EED and EZH2 over these time points, whereas EED226 and UNC1999 had no effect (Figure S5A). Importantly, UNC6852, EED226, and UNC1999 led to a comparable decrease in H3K27me3 levels, with H3K27me3 reduced by 51%, 52%, and 60%, respectively, after 72 hours (Figures S5A, B). As complete loss of H3K27me3 has previously been shown take up to 5 to 7 days upon treatment with PRC2 inhibitors, we observed a further decrease in H3K27me3 levels after 96 hours of treatment with UNC6852 (Figures S5C, D).
Next, we were interested in evaluating the sensitivity of DLBCL cell lines that contain heterozygous EZH2 missense mutations to UNC6852. These gain-of-function mutations in the catalytic SET domain including EZH2Y641N and EZH2A677G lead to an increase in H3K27me3 levels due to PRC2 hyperactivity (Xu et al., 2015). First, we investigated the effect of UNC6852 on PRC2 degradation in DB cells (EZH2Y641N) in a dose-dependent manner at 24 hours (Figure 5A, Figure S4). We observed degradation of EED and EZH2/EZH2Y641N in DB cells (DC50 = 0.61 ± 0.18 μM and 0.67 ± 0.24 μM, respectively), resulting in similar half maximal degradation concentrations as in HeLa cells. In contrast to prior results in HeLa cells where we observed partial degradation, EZH2/EZH2Y641N and EED were both completely degraded by UNC6852 (Dmax = 96% and 94%, respectively). Additionally, SUZ12 was also degraded to a much larger extent in DB cells. The maximal degradation of SUZ12 was 3.7-fold higher (Dmax = 82%) than in HeLa cells, with a calculated half maximal degradation concentration of 0.59 ± 0.17 μM. As expected, treatment with UNC7043 in DB cells did not affect the levels of these proteins (Figure 5B). Degradation of PRC2 by UNC6852 in DB cells also significantly reduced H3K27me3 levels, with a 71% loss of H3K27me3 after 72 hours (Figure 5C, D). To ensure that UNC6852 functions similarly in DLBCL lines with different missense mutations, we also treated Pfeiffer cells (EZH2A677G) with UNC6852 and similarly observed degradation of all three PRC2 subunits (Figure S6). Overall, UNC6852 potently degrades the core components of PRC2 and results in a concomitant loss of H3K27me3 in DLBCL cells with EZH2 gain-of-function mutations.
Figure 5. UNC6852 degrades PRC2 and reduces H3K27me3 levels in EZH2Y641N DB cells.

(A) Western blot analysis of the degradation of EED, EZH2, and SUZ12 in DB cells containing a heterozygous EZH2Y641N mutation treated with UNC6852 (0.1 – 30 μM for 24 hours). (B) Western blot analysis following treatment of DB cells with UNC6852 or negative control compound UNC7043 (10 μM for 24 hours). (C) Western blot analysis of PRC2 components and H3K27me3 in DB cells treated with UNC6852 in a time dependent fashion (10 μM for 24, 48 and 72 hours). (D) Quantification of H3K27me3 levels relative to total H3 in C. DMSO control was normalized to 1. Data are representative of at least two biological replicates. Data are represented as mean ± standard deviation
Furthermore, when DB and Pfeiffer cells were treated with UNC6852 for up to 12 days, robust anti-proliferative effects were observed (Figures 6A – C). Cells were similarly treated with EED226 or UNC1999, both of which have been shown to effectively reduce DLBCL cell proliferation (McCabe et al., 2012; Konze et al., 2013; Huang et al., 2017; Yuan et al., 2018). UNC6852 displayed a concentration dependent inhibition of cell proliferation, similar to EED226 and UNC1999, with an EC50 of 3.4 ± 0.77 μM after 9 days in DB cells and 0.41 ± 0.066 μM after 6 days in Pfeiffer cells (Figures 6D, Figure S7C, E). Additionally, overall cell toxicity was significantly less with UNC6852 (95% viable cells) as compared to EED226 (67% viable cells) and UNC1999 (67% viable cells) in DB cells after 12 days (Figure S7A). In contrast, Pfeiffer cell viability was affected upon treatment with UNC6852, EED226, and UNC1999 (Figure S7B). This is not surprising as EZH2 inhibition and shRNA mediated knockdown has been previously shown to lead to profound cytotoxic responses in Pfeiffer cells driven by caspase mediated apoptosis (McCabe et al., 2012). Interestingly, the negative control compound UNC7043 which is unable to bind VHL had no effect on cell proliferation despite containing a potent EED ligand (Figures 6A – C). This result reaffirms that the difference in proliferative effects between EED226 and UNC7043 in DLBCL cells is likely due to the lack of permeability inherent to most bivalent degraders and that catalytic degradation is required for efficacy. Concordantly, it can be concluded that the anti-proliferative effects seen with UNC6852 are due to PRC2 degradation as opposed to EED inhibition alone.
Figure 6. UNC6852 decreases cell proliferation in EZH2 mutant DLBCL cell lines.

(A) Proliferation effects on DB cells upon treatment with EED226, UNC1999, UNC6852, and UNC7043 (3 μM) reported relative to DMSO treatment. Corresponding cell viability data are shown in Supplementary Figure S7A. (B) Proliferation effects on Pfeiffer cells upon treatment with EED226, UNC1999, UNC6852, and UNC7043 (3 μM) reported relative to DMSO treatment. Corresponding cell viability data are shown in Supplementary Figure S7B. (C) Quantification of proliferation effects shown in A and B at day 6 and day 9 time points. (D) UNC6852 displays a concentration dependent inhibition of DB cell proliferation after 9 days of treatment (0.5 – 10 μM, EC50 = 3.4 ± 0.77 μM) and Pfeiffer cell proliferation after 6 days of treatment (0.1 – 5 μM, EC50 = 0.41 ± 0.066 μM). Corresponding cell viability data are shown in Supplementary Figures S7D and S7F. Data are represented as the mean of three biological replicates ± standard deviation (A-D).
DISCUSSION
Herein we report our discovery of an EED-targeted bivalent chemical degrader. We show that UNC6852 potently binds EED in vitro, degrades EED and other PRC2 components in a highly selective fashion, inhibits PRC2 catalytic activity resulting in decreased H3K27me3 levels, and has antiproliferative effects in DLBCL cell lines. We demonstrate that UNC6852 effectively degrades PRC2 components EED, EZH2, and SUZ12 via VHL recruitment and the E3 ligase proteasome degradation pathway.
To achieve efficient degradation, productive ternary complex formation with EED and VHL, as well as subsequent ubiquitylation of an available lysine residue, are essential. In common with other chemical degraders, we found that the linker incorporated to bridge the EED and VHL ligands was critical. UNC6852 contains a short alkyl linker of only three methylene groups, and we were surprised to find that the addition of a fourth methylene group (UNC6853) was sufficient to substantially reduce EED degradation, confirming the sensitivity of this system to the spatial proximity and orientation of the two ligands. As a relatively small set of potential EED degraders was evaluated in this study, ongoing efforts are aimed at determining the ‘sweet-spot’ for optimal linking within this ligand pair and establishing broader structure-degradation relationships in order to optimize the degradation efficiency of this class of molecules.
Although UNC6852 contains a potent and selective ligand for EED to mediate EED degradation, we were pleased to find that EZH2 was potently degraded in a parallel fashion, and SUZ12 to a somewhat lesser extent in multiple cell lines. This phenomenon of a bivalent degrader not only degrading its intended target, but an entire protein complex is quite unique. This result was confirmed by both western blot experiments as well as more extensive global proteomics studies, which also revealed the exquisite selectivity of UNC6852 mediated degradation within the proteome. It has been known for some time that EZH2 is not catalytically active in isolation, and recent structural studies have revealed that EZH2, EED, and SUZ12 associate intimately and the interactions between these three subunits seem to closely regulate enzymatic activity (Jiao et al., 2015). Specifically, EED is engulfed by a belt-like structure of EZH2, and SUZ12 contacts both of these two subunits. As a result, EZH2 is positioned in very close proximity to the EED226 binding site. Mechanistically, it is possible that UNC6852 mediates the direct ubiquitylation of EED, EZH2, and SUZ12. Alternatively, ubiquitylation of one of the three PRC2 components may result in the entire complex being recruited to the proteasome for degradation due to the close association and intertwined nature of the three proteins. It is also conceivable that some combination of these two mechanisms contribute to overall PRC2 degradation, as EED, EZH2, and SUZ12 are not all degraded to the same extent under identical conditions. We observed that SUZ12, which is somewhat further from the EED226 binding site in PRC2 is degraded to a lesser extent than both EED and EZH2, suggesting that PRC2 is not consistently recruited to the proteasome as a single unit. Overall, these mechanistic questions are challenging to tease apart but they are of high interest in conceptualizing the degradation of protein complexes more broadly.
Due to the genetic data linking PRC2 to tumorigenesis, extensive efforts have led to the development of numerous clinical candidates that target the SET domain of EZH2, as well as more recently the WD40 domain of EED. However, it has been reported that resistance to SAM-competitive EZH2 inhibitors can be caused by single point mutations in cell culture (Baker et al., 2015; Gibaja et al., 2016), suggesting that patients may become refractory to this class of molecules. Targeted protein degradation as a therapeutic approach is unique in that it is more likely to prevent the evolution of target-directed resistance mechanisms, and recent excitement over this approach to drug discovery cannot be overstated. As a result, we were motivated to investigate small molecule induced PRC2 degradation as an additional approach to targeting PRC2, particularly in the context of human cancer cell lines that are sensitive to EZH2 and EED inhibition. We demonstrate that UNC6852 has comparable antiproliferative effects to EZH2 and EED inhibitors (UNC1999 and EED226, respectively) in DB and Pfeiffer cells. We can attribute the effect observed with UNC6852 to PRC2 catalytic degradation versus on target inhibition because the negative control compound UNC7043 which potently binds EED in vitro but does not engage VHL has no effect. Importantly, the cell toxicity observed in DB cells with UNC6852 was substantially less than with both EED and EZH2 inhibitors, further supporting the notion that PRC2 degraders may have specific advantages over existing inhibitors in some cases. In summary, the results presented in this study demonstrate that PRC2-targeted degradation can be achieved and is a viable approach to potently and selectively inhibit PRC2 function. UNC6852 represents a useful tool compound to further interrogate PRC2 function in development and disease, as well as for further development into potential therapeutics.
STAR METHODS
LEAD CONTCT AND MATERIALS AVAILABILITY
Further information and requests for reagents should be directed to and will be fulfilled by the Lead contact, Lindsey I. James (ingerman@email.unc.edu).
EXPERIMENTAL MODEL AND SUBJECT DETAILS
Cell Lines
HeLa Cell Culture Conditions
HeLa cells were obtained from ATCC (CCL-2™) through the UNC Lineberger Tissue Culture Facility. Cells were cultured in MEM-α 1X (Gibco™, 12571071), 1% MEM Non-essential amino acid solution (Sigma, M7145), and 10% FBS (VWR Seradigm, 89510–194). Cells were maintained in a humidified incubator at 37°C, 5% CO2.
DB Cell Culture Conditions
DB cells were obtained from ATCC (CRL-2289™) through the UNC Lineberger Tissue Culture Facility. Cells were cultured in RPMI 1640 (Gibco™, 11-875-093) and 10% FBS. Cells were maintained in a humidified incubator at 37°C, 5% CO2.
Pfeiffer Cell Culture Conditions
Pfeiffer cells were obtained from ATCC (CRL-2632™) through the UNC Lineberger Tissue Culture Facility. Cells were cultured in RPMI 1640 (Gibco™, 11-875-093) and 10% FBS. Cells were maintained in a humidified incubator at 37°C, 5% CO2.
293T Cell Culture Conditions
293T cells were obtained from ATCC (CRL-11268™). Cells were cultured in DMEM (Gibco, 11995–065), 1% pen/strep, and 10% FBS. Cells were maintained in a humidified incubator at 37°C, 5% CO2.
METHOD DETAILS
Protein Expression and Purification
Full length EED (reference sequence AAD08714) was expressed with an N-terminal His-tag in a pET28 vector. The pET28-EED expression construct was transformed into Rosetta2 BL21(DE3)pLysS competent cells (Novagen, EMD Chemicals, San Diego, CA). Protein expression was induced by growing cells at 37°C with shaking until the OD600 reached ~0.6–0.8 at which time the temperature was lowered to 15°C and expression was induced by adding 0.1 mM IPTG and continuing shaking overnight. Cells were harvested by centrifugation and pellets were stored at −80°C.
His-tagged EED protein was purified by resuspending thawed cell pellets in 30 ml of lysis buffer (50 mM sodium phosphate pH 7.2, 150 mM NaCl, 30 mM imidazole, 1X EDTA free protease inhibitor cocktail (Roche Diagnostics, Indianapolis, IN)) per liter of culture. Cells were lysed on ice by sonication with a Branson Digital 450 Sonifier (Branson Ultrasonics, Danbury, CT) at 40% amplitude for 12 cycles with each cycle consisting of a 20 second pulse followed by a 40 second rest. The cell lysate was clarified by centrifugation and loaded onto a HisTrap FF column (GE Healthcare, Piscataway, NJ) that had been preequilibrated with 10 column volumes of binding buffer (50 mM sodium phosphate pH 7.2, 500 mM NaCl, 30 mM imidazole) using an AKTA FPLC (GE Healthcare, Piscataway, NJ). The column was washed with 15 column volumes of binding buffer and protein was eluted in a linear gradient to 100% elution buffer (50 mM sodium phosphate pH 7.2, 500 mM NaCl, 500 mM imidazole) over 20 column volumes. Peak EED containing fractions were pooled and concentrated to less than 8 ml in Amicon Ultra-15 concentrators 10 kDa molecular weight cut-off (Merck Millipore, Carrigtwohill Co. Cork IRL). Concentrated protein was loaded onto a HiLoad 26/60 Superdex 200 prep grade column (GE Healthcare, Piscataway, NJ) that had been preequilibrated with 1.2 column volumes of sizing buffer (25 mM Tris pH 7.5, 500 mM NaCl, 2 mM DTT, 5% glycerol) using an ATKA FPLC (GE Healthcare, Piscataway, NJ). Protein was eluted isocratically in sizing buffer over 1.3 column volumes at a flow rate of 2 ml/min collecting 3 ml fractions. Peak fractions were analyzed for purity by SDS-PAGE and those containing pure protein were pooled and concentrated using Amicon Ultra-15 concentrators 10 kDa molecular weight cut-off (Merck Millipore, Carrigtwohill Co. Cork IRL). Concentrated EED protein was dialyzed into a buffer containing 25 mM Tris, pH 7.5, 250 mM NaCl, 2 mM DTT, 5% glycerol for storage.
Time Resolved-Fluorescence Energy Transfer Assay
The TR-FRET assay was developed and performed as previously reported (Rectenwald et al., 2019). Briefly, assays were run using white, low-volume, flat-bottom, nonbinding, 384-well microplates (Greiner, 784904) containing a total assay volume of 10 μL per well. The assay buffer was composed of 20 mM Tris [pH 7.5], 150 mM NaCl, 0.05% Tween 20, and 2 mM DTT. LANCE Europium (Eu)-W1024 Streptavidin conjugate (2 nM) and LANCE Ultra ULight™-anti-6x-His antibody (10 nM) were used as donor and acceptor fluorophores associated with the tracer ligand and protein, respectively. Final assay concentrations of 15 nM 6X histidine tagged EED protein (residues 1–441, N-terminal tag) and 15 nM of UNC5114-biotin tracer ligand were used for final compound testing. Assay performance was evaluated using the Z’ factor calculation at varying DMSO concentrations up to 3%. Low signals were obtained using 50 μM EED226 to obtain complete inhibition and high signals were obtained without compound. The Z’ factor was consistent at each DMSO concentration revealing a DMSO tolerance of up to 3% (Z’ 0.5% = 0.83, Z’ 3% = 0.80).
A 10 point, three-fold serial dilution of each compound at 100X final assay concentration was made in DMSO using a TECAN Freedom EVO liquid handling workstation to create an assay mother plate. The top concentration of each compound in the mother plate was 1 mM. Using a TTP Labtech Mosquito® HTS liquid handling instrument, assay ready plates were stamped with 100 nL of the compound solutions from the mother plate. 10 μL of a mixture consisting of EED, UNC5114-biotin, and the fluorophore reagents (concentrations noted above) was added to each well of an assay ready plate using a Multidrop Combi (ThermoFisher). After addition of assay components, plates were sealed with clear covers, mixed gently on a tabletop shaker for 1 minute, centrifuged at 1000×g for 2 minutes, and allowed to equilibrate in a dark space for 1 hour. After 1 hour, the plate was read on an EnVision 2103 Multilabel Plate Reader (PerkinElmer) using an excitation filter at 320 nm and emission filters at 615 and 665 nm. Emission signals (615 and 665 nm) were measured simultaneously using a dual mirror D400/D630 (using a 100-microsecond delay). TR-FRET output signal was expressed as emission ratios of acceptor/donor (665/615 nm) counts. Percent inhibition was calculated on a scale of 0% (i.e., activity with DMSO vehicle only) to 100% (100 μM EED226) using full column controls on each plate. The data was fit with a four-parameter nonlinear regression analysis using GraphPad Prism to determine IC50 values and are reported as an average of two biological replicates ± standard deviation.
Cell Dosing and Lysis
For degradation analysis, cells were cultured in 6 well plates (Olympus Genesee Scientific, 25–105) and dosed with the appropriate concentration of bivalent degrader from a DMSO stock. Adherent cells (HeLa) were seeded at 400,000 cells/well for 24 hr analysis and 100,000 cells/well for 72 hr analysis. At the appropriate time point, cells were washed with 2X PBS, scraped in PBS (1 mL), centrifuged, aspirated, and lysed in 40–50 μL of modified RIPA lysis buffer (1X Modified RIPA buffer (25 mM Tris pH 8, 150 mM NaCl, 1 % NP-40, 1 % sodium deoxycholate, 0.1 % SDS), 1X Protease inhibitor cocktail (Active Motif, 37490), 4μL/mL Benzonase® nuclease (Millipore, ≥90% SDS page, E1014), DPBS (Gibco™)). Non-adherent cells (DB and Pfeiffer) were seeded at 800,000 cells/well for 24 hr analysis, and 100,000 cells/well for 72 hr analysis. Cells were centrifuged, aspirated, washed with 2X PBS, and aspirated again and lysed in 40–50 μL of Cytobuster lysis buffer (Cytobuster™ (71009), 1X Protease inhibitor cocktail (Active Motif, 37490), 2μL/mL Benzonase® nuclease (Millipore, ≥90% SDS page, E1014)).
The protein levels were quantified using Pierce™ Detergent Compatible Bradford Assay Kit (Thermo Scientific, 23246) for the modified RIPA lysis buffer, and with Protein Assay Dye Reagent Concentrate (Bio-Rad, 5000006) using a known concentration of BSA standard for the Cytobuster lysis buffer.
Jess ProteinSimple Analysis
Jess Protein Simple was used according to product guideline instructions. HeLa cell were treated with bivalent degraders UNC6851, UNC6852, UNC6853, UNC6845, UNC6846, UNC6847 at 5 μM for 4, 24, and 48 hrs, and cell lysates were generated using a modified RIPA buffer. Cell lysates were used at 1mg/mL. The primary antibodies used were: anti-EED (1:10, R&D Systems, AF5827), anti-EZH2 (1:100, D2C9 XP®, Cell Signaling Technology, 5246S). The secondary antibodies used were: anti-sheep HRP secondary antibody (1:25, LifeTech/Novex, A16041), anti-rabbit secondary IR antibody (1:20, Protein Simple, 043–820).
Western Blot Analysis
Cell lysate (20 μg) was combined with Laemmli buffer (Bio-Rad; 2X - 1610737 or 4X - 1610747) containing 2-mercaptoethanol (5%) and samples were boiled at 95 °C prior to gel loading. Gels (15μL, 15 well; 4–15% precast mini-PROTEAN® TGX™ gels, Bio-Rad, 4561046DC; or 4–15% precast mini-PROTEAN® TGX™ Stain Free™ gels, Bio-Rad 4568086) were placed in a Mini-PROTEAN® tetra cell at 200V in 1X Tris/Gycine/SDS running buffer (Bio-Rad, 1610772). Molecular weight ladder’s used were either Precision Plus Protein™ Dual Color Standard (Bio-Rad, 161–0374), or PageRuler™ Plus pre-stained protein ladder (ThermoFisher, 26619). Protein was transferred onto Immobilon-FL PVDF Membranes (Millipore Sigma, IPFL00010), with 1X Tris/Gycine transfer buffer (Bio-Rad, 1610772) and methanol (0.2% volume) at 100V for 1 hr at 4°C. Membranes were blocked at room temperature for 1 hr with Odyssey® blocking buffer (TBS, LI-COR, 926–31099), and the incubated with primary antibodies overnight at 4°C.
Primary Antibodies:
anti-EED (1:500, R&D Systems, AF5827), anti-EZH2 (1:1000, D2C9 XP® Cell Signaling Technology, 5246S), anti-SUZ12 (1:500, D39F6 XP® Cell Signaling Technology, 3737S), anti-GAPDH-AlexaFluor® 680 (1:5000, Abcam, ab184095), anti-GAPDH (1:5000, EMD Millipore, AB2302), anti-H3K27me3 (1:2000, Abcam, ab6002), anti-Histone H3 (1:5000, Abcam, ab1791), anti-HA (Abcam, 1:500, ab9110).
Membranes were incubated with the corresponding secondary antibodies for 1hr at room temperature prior to imaging. Fluorescence imaging was performed on a LI-COR Odyssey. For chemiluminescent detection, membranes were activated with ECL Prime western blotting detection reagent (Amersham, RPN2232) and imaged on a Bio-Rad Chemidoc.
Li-COR Fluorescent Secondary Antibodies:
IR Dye® 680RD (1:10000, Goat anti-mouse, LI-COR, 926–68070), IR Dye® 800CW (1:10000, Goat anti-rabbit, LI-COR, 926–32211).
Chemi-Doc Chemiluminescent Secondary Antibodies:
Goat anti-chicken HRP (1:10000, LifeTech/Novex, A16054), Donkey anti-sheep HRP (1:10000, LifeTech/Novex, A16041), Donkey anti-rabbit HRP (1:10000, LifeTech/Novex, A16035).
Western blot quantification
Western blots were analysed by firstly calculating the densitometry on either ImageStudio software or ImageLab software for LI-COR or Chemidoc imaging, respectively. The densitometry of the protein of interest band relative to the densitometry of each corresponding GAPDH band was calculated. The resulting densitometry relative to the DMSO band was calculated to give the % degradation.
For the dose response and time study these values were plotted in GraphPad Prism against the corresponding concentration or time of degrader treatment. An inhibitor concentration vs response (three parameters) regression was plotted and the IC50 values were taken from GraphPad Prism which corresponded to either the apparent half-life (t1/2, when protein levels were plotted against time), or the half maximal degradation concentration (DC50, when protein levels were plotted against concentration). The maximal degradation (Dmax) was calculated based on the % degradation at 30 μM after 24 hours).
Cell Proliferation Analysis
Exponentially growing DB cells were seeded in a 12 well plate (Corning® Costar®, CLS3513) at a cell density of 0.5 × 10⁵ cells/mL and exponentially growing Pfeiffer cells were seeded at a cell density of 1.0 × 10⁵ cells/mL. Every 3 days the media was exchanged, cells were split back to the seeding density, and the compound or DMSO control were re-dosed. At each time point the cells were counted on an automated Bio-Rad TC20™ cell counter with Trypan blue (Abcam, ab233465) and cell counting slides (1450015) to give the cell count (cells/mL) and cell viability (%). The % cell proliferation is calculated based on the total cell number expressed as split-adjusted viable cells, relative to the DMSO control at the same time point. To determine an EC50, the total cell number is expressed as a split-adjusted viable cells/mL and the results were analyzed in GraphPad Prism with a log(inhibitor) vs response - variable slope (four parameters). EC50 values and are reported as an average of three biological replicates ± standard deviation.
Antibody Validation Methods
pCMVHA EED WT (Addgene plasmid # 24231; http://n2t.net/addgene:24231; RRID:Addgene_24231) and pCMVHA hEZH2 (Addgene plasmid # 24230; http://n2t.net/addgene:24230; RRID:Addgene_24230) were a gift from Kristian Helin.(Bracken et al., 2003) Constructs were confirmed by sequencing prior to use. pCMVHA EED WT contains the DNA sequence to express the two smaller isoforms of EED (EED3/4) but not the two larger predicted isoforms EED1/2.(Montgomery et al., 2007) Two individually isolated plasmids from the original bacterial streak received from Addgene were transfected into 293T cells using Fugene HD (Promega) per manufacturer’s protocol. Cells were collected two days post transfection and assayed by western blot using anti-HA (Abcam, ab9110, 1:1500) to confirm protein expression. For validation of EED antibody AF5827 (R&D Systems) and EZH2 antibody CST5246 (Cell Signaling Technology), the same plasmids were transfected into HeLa cells using Fugene HD and cell lysates analyzed by western blot using the respective antibodies relative to untransfected controls. Blots are provided overexposed to see endogenous levels of EED and EZH2 in untransfected controls as well as overlaid on membrane to allow for comparison to the ladder (PageRuler Plus Prestained Protein Ladder, 10–250kDa, ThermoFisher). GAPDH (Millipore, AB2302, 1:5000) is provided as a loading control for all samples.
Global Proteomics Experiments
Exponentially growing HeLa cells were seeded in 10 cm plates and treated with UNC6852, UNC7043, or DMSO (10 μM, 24 hrs). Cells from biological triplicates were harvested on ice and centrifuged at 4 °C for 10 min. Lysis on ice with 8M urea in 50 mM Tris-HCl pH 7.8 with 1X protease inhibitor cocktail (Active Motif, 37490) and 1X phosphatase inhibitor (Roche, PhosSTOP, 05892791001). Sample preparation: Each sample (200 μg) was incubated with trypsin overnight. Samples were desalted with SepPak C18 cartridges (Waters, 100 mg sorbent, WAT036820), and Pierce BCA peptide quantitation assay was performed. Each sample (50 μg) was labelled with a TMT label. After labelling, samples were quenched and combined 1:1 into a single multiplexed sample. An aliquot (100 μg) of the mixed sample was fractionated into 8 fractions using the Pierce high pH reversed phase fractionation spin columns. Peptide fractions were analysed in duplicate by LC-MS/MS using a Thermo Easy nLC 1200-QExactive HF. Proteins were identified by searching raw data against a reviewed Uniprot human database (containing 20,245 sequences) using Andromeda and quantified using TMT intensities within MaxQuant v1.6.3.4. Further data analysis was performed in Perseus, Excel, and GraphPad Prism. Statistical significance between each pair of groups was calculated using Student’s T-test and a p-value of <0.01 was used as the significance cut-off. Log2 fold change of each protein was calculated by dividing the averaged log2 TMT intensities of each compound by the averaged log2 TMT intensities of the DMSO control across all replicates. A log2 absolute fold change of 0.5 was used as the significance cut-off.
Synthesis of Compound Intermediates and Final Compounds
General Chemistry Procedures
All reagents and solvents were obtained from commercial suppliers and were used without further purification unless otherwise stated. EED226 and UNC1999 were purchased from MedChemExpress, and UNC5679 (reported as compound 19) was synthesized according to literature procedures (Huang et al., 2017). Reactions were carried out using conventional glassware and room temperature was generally 22 °C. Reactions were carried out at elevated temperatures using a temperature regulated hot plater-stirrer. Thin layer chromatography was carried out using Merck silica plates coated with fluorescent indicator UV254. These were analysed under 254 nm UV light. Analytical LCMS data for all compounds were acquired using an Agilent 6110 Series system with the UV detector set to 254 nm. Samples were injected (<10 μL) onto an Agilent Eclipse Plus 4.6 × 50 mm, 1.8 μm, C18 column at room temperature. Mobile phases A (H2O + 0.1% acetic acid) and B (MeOH + 0.1% acetic acid) were used with a linear gradient from 10% to 100% B in 5.0 min, followed by a flush at 100% B for another 2 minutes with a flow rate of 1.0 mL/min. Mass spectra (MS) data were acquired in positive ion mode using an Agilent 6110 single quadrupole mass spectrometer with an electrospray ionization (ESI) source. Normal phase column chromatography was performed with a Teledyne Isco CombiFlash®Rf 200 using RediSep®Rf SILICA columns with the UV detector set to 254 nm and 280 nm. Reverse phase column chromatography was performed with a Teledyne Isco CombiFlash®Rf 200 using C18 RediSep®Rf Gold columns with the UV detector set to 220 nm and 254 nm. Preparative HPLC was performed using an Agilent Prep 1200 series with the UV detector set to 220 nm and 254 nm. Samples were injected onto either a Phenomenex Luna 250 × 30 mm (5 μm) C18 column or a Phenomenex Luna 75 × 30 mm (5 μm) C18 column at room temperature. Analytical LCMS (at 254 nm) was used to establish the purity of targeted compounds. All compounds that were evaluated in biochemical and biophysical assays had >95% purity as determined by LCMS.
Analysis of Products
1H and 13C NMR spectra were obtained on a Bruker AV 400 at 400 MHz, 101 MHz respectively. Chemical shifts are reported in ppm and coupling constants are reported in Hz with CDCl3 referenced at 7.26 (1H) and 77.1 ppm (13C), DMSO-d6 referenced at 2.50 (1H) and 39.5 ppm (13C), and MeOD-d4 referenced at 3.31 (1H) and 49.0 ppm (13C).
Chemistry Abbreviations
Trifluoroacetic acid (TFA), N,N-Diisopropylethylamine (DIPEA), Dimethyl formamide (DMF), Tetrahydrofuran (THF), 2-(1H-Benzotriazole-1-yl)-1,1,3,3-tetramethylaminium tetrafluoroborate (TBTU).
Chemistry Experimental
8-bromo-N-(furan-2–2-ylmethyl)-[1,2,4]triazolo[4,3-c]pyrimidin-5-amine (1)

Prepared according to literature procedures (Huang et al., 2017). To a flask was added furan-2-ylmethanamine (24.6 mL, 278.0 mmol, 41.6 equiv) and 8-bromo-5-(methylthio)-[1,2,4]triazolo[4,3-c]pyrimidine (1.6g, 6.7 mmol, 1.0 equiv) and stirred at room temperature for 2 hr. The reaction was concentrated in vacuo almost to dryness and filtered under vacuum with CH2Cl2 (50 mL) to yield the desired product as a white solid 8-bromo-N-(furan-2–2-ylmethyl)-[1,2,4]triazolo[4,3-c]pyrimidin-5-amine (1.57 g, 80%).
1H NMR (DMSO-d6, 400 MHz): δ 9.44 (s, 1H), 7.82 (s, 1H), 7.61 (t, J = 1.4 Hz, 1H), 6.42 (d, J = 1.4 Hz, 2H), 4.68 (s, 2H).
13C NMR (DMSO-d6, 101 MHz): δ 150.9, 147.8, 143.8, 143.2, 142.7, 134.0, 110.7, 108.1, 91.2, 38.0.
LCMS: expected mass for [M+H]+ (C10H8BrN5O), 293.99 m/z; found, 294.10 m/z.
4-(5-((furan-2-ylmethyl)amino)-[1,2,4]triazolo[4,3-c]pyrimidin-8-yl)benzoic acid (2)
To an oven dried microwave vial was added (4-(methoxycarbonyl)phenyl)boronic acid (184 mg, 1.0 mmol, 1.5 equiv), 8-bromo-N-(furan-2-ylmethyl)-[1,2,4]triazolo[4,3-c]pyrimidin-5-amine (200 mg, 680 μmol, 1.0 equiv), Pd(dppf)Cl2.CH2Cl2 (111 mg, 136 μmol, 0.2 equiv), and sodium bicarbonate (143 mg, 1.70 mmol, 2.5 equiv), and purged under N2. To the vial was added THF (4 mL), H2O (2 mL) and heated to 110 °C for 18 hrs. The reaction was cooled to room temperature, filtered through celite with EtOAc, and purified by column chromatography (silica, 0–100% EtOAc in hexane) to yield the intermediate methyl 4-(5-((furan-2-ylmethyl)amino)-[1,2,4]triazolo[4,3-c]pyrimidin-8-yl)benzoate, which was used without further purification in the next step.
LCMS: expected mass for [M+H]+ (C18H15N5O3), 350.12 m/z; found, 350.10 m/z.
To the flask containing 4-(5-((furan-2-ylmethyl)amino)-[1,2,4]triazolo[4,3-c]pyrimidin-8-yl)benzoate was added lithium hydroxide (48.9 mg, 2.04 mmol, 3.0 equiv), THF (2.7 mL), H2O (0.5 mL) and heated to 50 °C for 16 hrs. The reaction was cooled, THF concentrated in vacuo, and diluted with 1M HCl (200 mL). The organics were extracted with EtOAc (3 ˣ 200 mL), washed with brine (400 mL) and dried with a phase separator to yield the desired product as a white solid 4-(5-((furan-2-ylmethyl)amino)-[1,2,4]triazolo[4,3-c]pyrimidin-8-yl)benzoic acid (227 mg, 99% over two steps).
1H NMR (DMSO-d6, 400 MHz): δ 9.64 (s, 1H), 9.26 (s, 1H), 8.30 (d, J = 8.7 Hz, 2H), 8.19 (s, 1H), 8.02 (d, J = 8.68 Hz, 2H), 7.63 – 7.62 (m, 1H), 6.45 – 6.42 (m, 2H), 4.78 (d, J = 5.4 Hz, 2H).
13C NMR (DMSO-d6, 101 MHz): δ 167.1, 151.2, 148.3, 143.9, 142.5, 141.4, 137.9, 129.5, 129.2, 126.8, 110.6, 107.8, 37.7, 2 × aromatic C not observed (coincident).
(2S,4R)-1-((S)-3,3-dimethyl-2-((2,2,2-trifluoroacetyl)-l4-azaneyl)butanoyl)-4-hydroxy-N-(4-(4-methylthiazol-5-yl)benzyl)pyrrolidine-2-carboxamide (3)
Compound 3 was synthesized according to literature procedures (Buckley et al., 2015). Obtained 871 mg.
1H NMR (MeOD-d4, 400 MHz) δ 9.01 (s, 1H), 7.49 – 7.40 (m, 4H), 4.67 (dd, J = 7.7, 9.5 Hz, 1H),4.58 – 4.52 (m, 2H), 4.36 (d, J = 15.5 Hz, 1H), 4.05 (s, 1H), 3.82 (d, J = 11.3 Hz, 1H), 3.71 (dd, J = 3.5, 11.2 Hz, 1H), 2.48 (s, 3H), 2.34 – 2.26 (m, 1H), 2.09 (ddd, J = 4.2, 9.6, 13.4 Hz, 1H), 1.13 (s, 9H).
13C NMR (MeOD-d4, 101 MHz) δ 174.0, 168.6, 153.3, 148.3, 140.4, 133.8, 131.1, 130.4, 129.0, 71.2, 61.0, 60.4, 58.0, 43.7, 39.1, 35.8, 26.6, 15.5.
LCMS: expected mass for [M+H]+ (C22H30N4O3S), 431.20 m/z; found, 431.20 m/z.
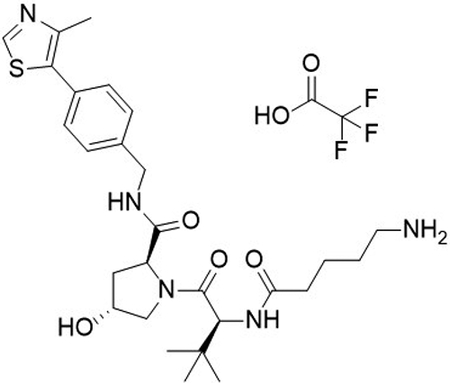
(2S,4R)-1-((S)-2-(3-aminopropanamido)-3,3-dimethylbutanoyl)-4-hydroxy-N-(4-(4-methylthiazol-5-yl)benzyl)pyrrolidine-2-carboxamide 2,2,2-trifluoroacetate (4)
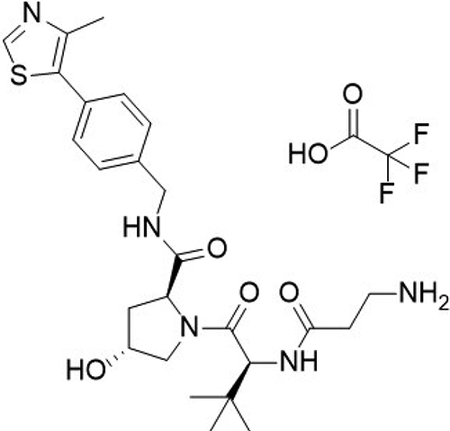
To a flask was added 3-((tert-butoxycarbonyl)amino)propanoic acid (34.7 mg, 184 μmol, 1.0 equiv), DIPEA (0.10 mL, 588.00 μmol, 3.2 equiv), and 2-(1H-benzo[d][1,2,3]triazol-1-yl)-1,1,3,3-tetramethyluronium tetrafluoroborate (77 mg, 239 μmol, 1.3 equiv) in DMF (2 mL), followed by addition of (2S,4R)-1-((S)-2-amino-3,3-dimethylbutanoyl)-4-hydroxy-N-(4-(4-methylthiazol-5-yl)benzyl)pyrrolidine-2-carboxamide (94.9 mg, 220 μmol, 1.0 equiv). The reaction was stirred at room temperature for 16 hrs, concentrated in vacuo and purified by column chromatography (silica, 0–10% MeOH in CH2Cl2). The intermediate was N-Boc deprotected with 20% TFA in CH2Cl2 (2 mL), concentrated in vacuo and purified by column chromatography (C18, 0–100% MeOH in H2O, 0.1% TFA). The product was concentrated to yield the desired product as a clear gum (2S,4R)-1-((S)-2-(3-aminopropanamido)-3,3-dimethylbutanoyl)-4-hydroxy-N-(4-(4-methylthiazol-5-yl)benzyl)pyrrolidine-2-carboxamide 2,2,2-trifluoroacetate (100 mg, 88 %) over 2 steps.
1H NMR (MeOD-d4, 400 MHz): δ 9.04 (s, 1H), 7.49 – 7.40 (m, 4H), 4.59 – 4.56 (m, 2H), 4.55 – 4.50 (m, 2H), 4.36 (d, J = 15.5 Hz, 1H), 3.98 (d, J = 11.1 Hz, 1H), 3.79 (dd, J = 3.8, 11.0 Hz, 1H), 3.23 – 3.10 (m, 2H), 2.69 (t, J = 6.4 Hz, 2H), 2.49 (s, 3H), 2.28 – 2.20 (m, 1H), 2.13 – 2.05 (m, 1H), 1.05 (s, 9H).
13C NMR (MeOD-d4, 101 MHz): δ 174.4, 172.4, 172.1, 153.4, 148.0, 140.6, 134.0, 131.0, 130.3, 129.0, 71.2, 60.8, 59.5, 57.9, 43.7, 39.1, 37.0, 36.2, 32.3, 27.0, 15.4.
LCMS: expected mass for [M+H]+ (C25H35N5O4S), 502.24 m/z; found, 502.20 m/z.
(2S,4R)-1-((S)-2-(4-aminobutanamido)-3,3-dimethylbutanoyl)-4-hydroxy-N-(4-(4-methylthiazol-5-yl)benzyl)pyrrolidine-2-carboxamide 2,2,2-trifluoroacetate (5)

To a flask was added 4-((tert-butoxycarbonyl)amino)butanoic acid (19 mg, 92 μmol, 1.0 equiv), DIPEA (51 μL, 0.29 mmol, 3.2 equiv), and 2-(1H-benzo[d][1,2,3]triazol-1-yl)-1,1,3,3-tetramethyluronium tetrafluoroborate (38 mg, 0.12 mmol, 1.3 equiv) in DMF (0.9 mL), followed by addition of (2S,4R)-1-((S)-2-amino-3,3-dimethylbutanoyl)-4-hydroxy-N-(4-(4-methylthiazol-5-yl)benzyl)pyrrolidine-2-carboxamide (50 mg, 92 μmol, 1.0 equiv). The reaction was stirred at room temperature for 16 hrs, concentrated in vacuo and purified by column chromatography (silica, 0–10% MeOH in CH2Cl2). The reaction was telescoped into the deprotection with 20% TFA in CH2Cl2 (2 mL), concentrated in vacuo and purified by column chromatography (C18, 0–100% MeOH in H2O, 0.1% TFA). The product was concentrated to yield the desired product as a clear oil (2S,4R)-1-((S)-2-(4-aminobutanamido)-3,3-dimethylbutanoyl)-4-hydroxy-N-(4-(4-methylthiazol-5-yl)benzyl)pyrrolidine-2-carboxamide 2,2,2-trifluoroacetate (31 mg, 53 %) over 2 steps.
1H NMR (MeOD-d4, 400 MHz): δ 8.91 (s, 1H), 7.50 – 7.41 (m, 4H), 4.62 – 4.49 (m, 4H), 4.36 (d, J = 15.5 Hz, 1H), 3.92 (d, J = 11.1Hz, 1H), 3.80 (dd, J = 3.9, 11.0 Hz, 1H), 2.96 (t, J = 7.4 Hz, 2H), 2.47 (s, 3H), 2.47 – 2.41 (m, 2H), 2.26 – 2.19 (m, 1H), 2.13 – 2.04 (m, 1H), 1.96 – 1.87 (m, 2H), 1.04 (s, 9H).
13C NMR (MeOD-d4, 101 MHz): δ 174.38, 174.36, 172.3, 153.0, 148.8, 140.3, 133.5, 131.4, 130.5, 130.3, 129.5, 129.0, 71.1, 60.8, 59.3, 58.0, 43.7, 40.4, 39.0, 36.4, 33.3, 27.0, 24.4, 15.7.
LCMS: expected mass for [M+H]+ (C26H37N5O4S), 516.26 m/z; found, 516.20 m/z.
(2S,4R)-1-((S)-2-(5-aminopentanamido)-3,3-dimethylbutanoyl)-4-hydroxy-N-(4-(4-methylthiazol-5-yl)benzyl)pyrrolidine-2-carboxamide 2,2,2-trifluoroacetate (6)
To a flask was added 5-((tert-butoxycarbonyl)amino)pentanoic acid (25 mg, 0.12 mmol, 1.0 equiv), DIPEA (65 μL, 0.37 mmol, 3.2 equiv), and 2-(1H-benzo[d][1,2,3]triazol-1-yl)-1,1,3,3-tetramethyluronium tetrafluoroborate (48 mg, 0.15 mmol, 1.3 equiv) in DMF (1.0 mL), followed by addition of (2S,4R)-1-((S)-2-amino-3,3-dimethylbutanoyl)-4-hydroxy-N-(4-(4-methylthiazol-5-yl)benzyl)pyrrolidine-2-carboxamide (50 mg, 0.12 mmol, 1.0 equiv). The reaction was stirred at room temperature for 16 hrs, concentrated in vacuo and purified by column chromatography (silica, 0–10% MeOH in CH2Cl2). The reaction was telescoped into the deprotection with 20% TFA in CH2Cl2 (2 mL), concentrated in vacuo and purified by column chromatography (C18, 0–100% MeOH in H2O, 0.1% TFA). The product was concentrated to yield the desired product as a clear oil (2S,4R)-1-((S)-2-(5-aminopentanamido)-3,3-dimethylbutanoyl)-4-hydroxy-N-(4-(4-methylthiazol-5-yl)benzyl)pyrrolidine-2-carboxamide 2,2,2-trifluoroacetate (41 mg, 55 %) over 2 steps.
1H NMR (MeOD-d4, 400 MHz): δ 9.06 (s, 1H), 7.49 – 7.39 (m, 4H), 4.62 – 4.50 (m, 4H), 4.37 (d, J = 15.5 Hz, 1H), 3.91 (d, J = 11.1Hz, 1H), 3.81 (dd, J = 3.9, 11.0 Hz, 1H), 2.93 (t, J = 6.5 Hz, 2H), 2.50 (s, 3H), 2.38 – 2.32 (m, 2H), 2.27–2.18 (m, 1H), 2.13 – 2.02 (m, 1H), 1.73 – 1.64 (m, 4H), 1.04 (s, 9H).
13C NMR (MeOD-d4, 101 MHz): δ 175.2, 174.4, 172.4, 153.5, 147.9, 140.7, 134.1, 130.9, 130.4, 129.1, 71.1, 60.8, 59.2, 58.0, 43.7, 40.3, 39.0, 36.5, 35.5, 28.0, 27.0, 23.4, 15.3.
LCMS: expected mass for [M+H]+ (C27H39N5O4S), 530.27 m/z; found, 530.20 m/z.
(2S,4R)-1-((S)-2-(3-(2-(2-aminoethoxy)ethoxy)propanamido)-3,3-dimethylbutanoyl)-4-hydroxy-N-(4-(4-methylthiazol-5-yl)benzyl)pyrrolidine-2-carboxamide 2,2,2-trifluoroacetate (7)
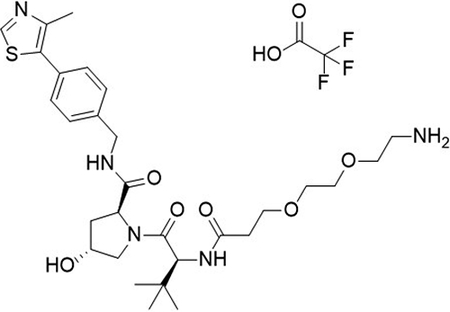
To a flask was added 2,2-dimethyl4-oxo-3,8,11-trioxa-5-azatetradecan-14-oic acid (100 mg, 1.15 mmol, 1.0 equiv), DIPEA (0.20 mL, 1.15 mmol, 3.2 equiv) and 2-(1H-benzo[d][1,2,3]triazol-1-yl)-1,1,3,3-tetramethyluronium tetrafluoroborate (151 mg, 469 μmol, 1.3 equiv) followed by addition of (2S,4R)-1-((S)-2-amino-3,3-dimethylbutanoyl)-4-hydroxy-N-(4-(4-methylthiazol-5-yl)benzyl)pyrrolidine-2-carboxamide (155 mg, 361 μmol, 1.0 equiv). The reaction was stirred at room temperature for 16 hrs, concentrated in vacuo and purified by column chromatography (silica, 0–10% MeOH in CH2Cl2). The reaction was telescoped into the deprotection with 20% TFA in CH2Cl2 (2 mL), concentrated in vacuo and purified by column chromatography (C18, 0–100% MeOH in H2O, 0.1% TFA). The product was concentrated to yield the desired product as a clear gum (2S,4R)-1-((S)-2-(3-(2-(2-aminoethoxy)ethoxy)propanamido)-3,3-dimethylbutanoyl)-4-hydroxy-N-(4-(4-methylthiazol-5-yl)benzyl)pyrrolidine-2-carboxamide 2,2,2-trifluoroacetate (135 mg, 53 %) over 2 steps.
1H NMR (MeOD-d4, 400 MHz): δ 9.08 (s, 1H), 7.52 – 7.41 (m, 4H), 4.64 (s, 1H), 4.60 – 4.49 (m, 3H), 4.39 (d, J = 15.5 Hz, 1H), 3.91 (d, J = 11.3 Hz, 1H), 3.81 (dd, J = 3.8, 11.0 Hz, 1H), 3.75 (t, J = 3.8, 11.0 Hz, 2H), 3.71 – 3.68 (m, 2H), 3.67 – 3.62 (m, 4H), 3.13 – 3.08 (m, 2H), 2.62 – 2.52 (m, 2H), 2.50 (s, 3H), 2.27 – 2.20 (m, 1H), 2.12 – 2.04 (m, 1H), 1.04 (s, 9H).
13C NMR (MeOD-d4, 101 MHz): δ 174.4, 173.7, 172.3, 153.5, 147.9, 140.7, 134.1, 130.9, 130.5, 130.4, 129.5, 129.1, 71.31, 71.26, 71.1, 68.1, 67.8, 60.9, 59.1, 58.0, 43.7, 40.7, 39.1, 37.0, 36.7, 27.0, 15.3.
LCMS: expected mass for [M+H]+ (C29H43N5O6S), 590.29 m/z; found, 590.30 m/z.
(2S,4R)-1-((S)-14-amino-2-(tert-butyl)-4-oxo-6,9,12-trioxa-3-azatetradecanoyl)-4-hydroxy-N-(4-(4-methylthiazol-5-yl)benzyl)pyrrolidine-2-carboxamide 2,2,2-trifluoroacetate (8)
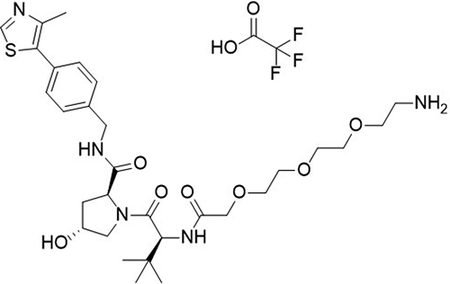
To a flask was added 2,2-dimethyl-4-oxo-3,8,11,14-tetraoxa-5-azahexadecan-16-oic acid (36 mg, 0.12 mmol, 1.0 equiv), DIPEA (65 μL, 0.37 mmol, 3.2 equiv) and 2-(1H-benzo[d][1,2,3]triazol-1-yl)-1,1,3,3-tetramethyluronium tetrafluoroborate (48 mg, 0.15 mmol, 1.3 equiv) followed by addition of (2S,4R)-1-((S)-2-amino-3,3-dimethylbutanoyl)-4-hydroxy-N-(4-(4-methylthiazol-5-yl)benzyl)pyrrolidine-2-carboxamide (50 mg, 0.12 mmol, 1.0 equiv). The reaction was stirred at room temperature for 16 hrs, concentrated in vacuo and purified by column chromatography (silica, 0–10% MeOH in CH2Cl2). The reaction was telescoped into the deprotection with 20% TFA in CH2Cl2 (2 mL), concentrated in vacuo and purified by column chromatography (C18, 0–100% MeOH in H2O, 0.1% TFA). The product was concentrated to yield the desired product as a clear gum (2S,4R)-1-((S)-14-amino-2-(tert-butyl)-4-oxo-6,9,12-trioxa-3-azatetradecanoyl)-4-hydroxy-N-(4-(4-methylthiazol-5-yl)benzyl)pyrrolidine-2-carboxamide 2,2,2-trifluoroacetate (23 mg, 27 %) over 2 steps.
1H NMR (MeOD-d4, 400 MHz): δ 9.02 (s, 1H), 7.49 – 7.42 (m, 4H), 4.70 (s, 1H), 4.59 – 4.54 (m, 1H), 4.54 – 4.48 (m, 2H), 4.40 (d, J = 15.5 Hz, 1H), 4.08 (d, J = 2.0 Hz, 2H), 3.90 (d, J = 11.0 Hz, 1H), 3.81 (dd, J = 3.7, 11.0 Hz, 1H), 3.75 – 3.67 (m, 13H), 3.14 – 3.09 (m, 2H), 2.49 (s, 3H), 2.29 – 2.21 (m, 1H), 2.14 – 2.05 (m, 1H), 1.05 (s, 9H).
13C NMR (MeOD-d4, 400 MHz): δ 174.3, 172.1, 171.9, 152.9, 140.2, 131.6, 130.5, 130.4, 129.5, 129.0, 72.0, 71.5, 71.3, 71.2, 71.1, 70.9, 67.9. 61.0, 58.4, 58.1, 43.7, 40.7, 39.0, 37.0, 27.0, 15.8.
LCMS: expected mass for [M+H]+ (C30H45N5O7S), 620.30 m/z; found, 620.30 m/z.
(2S,4R)-1-((S)-1-amino-17-(tert-butyl)-15-oxo-3,6,9,12-tetraoxa-16-azaoctadecan-18-oyl)-4-hydroxy-N-(4-(4-methylthiazol-5-yl)benzyl)pyrrolidine-2-carboxamide 2,2,2-trifluoroacetate (9)
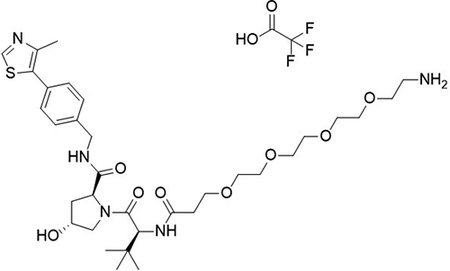
To a flask was added 2,2-dimethyl-4-oxo-3,8,11,14,17,20,23-heptaoxa-5-azahexacosan-26-oic acid (100 mg, 220 μmol, 1.0 equiv), DIPEA (0.12 mL, 706 μmol, 3.2 equiv) and 2-(1H-benzo[d][1,2,3]triazol-1-yl)-1,1,3,3-tetramethyluronium tetrafluoroborate (92 mg, 287 μmol, 1.3 equiv) followed by addition of (2S,4R)-1-((S)-2-amino-3,3-dimethylbutanoyl)-4-hydroxy-N-(4-(4-methylthiazol-5-yl)benzyl)pyrrolidine-2-carboxamide (94.9 mg, 220 μmol, 1.0 equiv). The reaction was stirred at room temperature for 16 hrs, concentrated in vacuo and purified by column chromatography (silica, 0–10% MeOH in CH2Cl2). The reaction was telescoped into the deprotection with 20% TFA in CH2Cl2 (2 mL), concentrated in vacuo and purified by column chromatography (C18, 0–100% MeOH in H2O, 0.1% TFA). The product was concentrated to yield the desired product as a clear gum (2S,4R)-1-((S)-1-amino-17-(tert-butyl)-15-oxo-3,6,9,12-tetraoxa-16-azaoctadecan-18-oyl)-4-hydroxy-N-(4-(4-methylthiazol-5-yl)benzyl)pyrrolidine-2-carboxamide 2,2,2-trifluoroacetate (92 mg, 42 %) over 2 steps.
1H NMR (MeOD-d4, 400 MHz): δ 9.02 (s, 1H), 7.50 – 7.41 (m, 4H), 4.64 (s, 1H), 4.59 – 4.49 (m, 3H), 4.37 (d, J = 15.5 Hz, 1H), 3.90 (d, J = 11.1 Hz, 1H), 3.80 (dd, J = 3.9, 11.0 Hz, 1H), 3.77 – 3.71 (m, 4H), 3.69 – 3.61 (m, 12H), 3.15 – 3.12 (m, 2H), 2.64 – 2.51 (m, 2H), 2.49 (s, 3H), 2.27 – 2.20 (m, 1H), 2.13 – 2.05 (m, 1H), 1.04 (s, 9H).
13C NMR (MeOD-d4, 101 MHz): δ 174.4, 173.9, 172.2, 153.3, 148.2, 140.6, 133.9, 131.1, 130.5, 130.4, 129.4, 129.0, 71.39, 71.35, 71.3, 71.23, 71.22, 71.1, 70.9, 68.3, 67.8, 60.8, 59.1, 58.0, 43.7, 40.5, 39.0, 37.1, 36.7, 27.0, 15.5.
LCMS: expected mass for [M+H]+ (C33H51N5O8S), 678.35 m/z; found, 678.30 m/z.
(2S,4S)-1-((S)-2-amino-3,3-dimethylbutanoyl)-4-hydroxy-N-(4-(4-methylthiazol-5-yl)benzyl)pyrrolidine-2-carboxamide 2,2,2-trifluoroacetate (10)
Compound 10 was synthesized according to literature procedures (Frost et al., 2016). Obtained 44 mg.
1H NMR (MeOD-d4, 400 MHz) δ 9.07 (s, 1H), 7.51 – 7.40 (m, 4H), 4.62 – 4.53 (m, 2H), 4.42 – 4.35 (m, 2H), 4.02 (s, 1H), 3.91 (dd, J = 5.3, 10.6 Hz, 1H), 3.63 (dd, J = 4.6, 10.5 Hz, 1H), 2.54 – 2.45 (m, 4H), 2.03 – 1.95 (m, 1H), 1.13 (s, 9H).
13C NMR (MeOD-d4, 101 MHz) δ 174.3, 168.7, 153.5, 147.9, 140.4, 134.1, 131.0, 130.4, 129.1, 71.3, 61.1, 60.2, 57.2, 43.8, 37.9, 35.6, 26.7, 15.3.
LCMS: expected mass for [M+H]+ (C22H30N4O3S), 431.20 m/z; found, 431.20 m/z.
(2S,4S)-1-((S)-2-(4-aminobutanamido)-3,3-dimethylbutanoyl)-4-hydroxy-N-(4-(4-methylthiazol-5-yl)benzyl)pyrrolidine-2-carboxamide 2,2,2-trifluoroacetate (11)
To a flask was added 4-((tert-butoxycarbonyl)amino)butanoic acid (10.6 mg, 53 μmol, 1.1 equiv), DIPEA (27 μL, 154 μmol, 3.2 equiv), and 2-(1H-benzo[d][1,2,3]triazol-1-yl)-1,1,3,3-tetramethyluronium tetrafluoroborate (20.1 mg, 63 μmol, 1.3 equiv) in DMF (2 mL), followed by addition of (2S,4S)-1-((S)-2-amino-3,3-dimethylbutanoyl)-4-hydroxy-N-(4-(4-methylthiazol-5-yl)benzyl)pyrrolidine-2-carboxamide 2,2,2-trifluoroacetate (26.2 mg, 48 μmol, 1.0 equiv). The reaction was stirred at room temperature for 16 hrs, concentrated in vacuo and purified by column chromatography (silica, 0–10% MeOH in CH2Cl2). The intermediate was N-Boc deprotected with 20% TFA in CH2Cl2 (2 mL), concentrated in vacuo and purified by column chromatography (C18, 0–100% MeOH in H2O, 0.1% TFA). The product was concentrated to yield the desired product as a clear gum (2S,4S)-1-((S)-2-(4-aminobutanamido)-3,3-dimethylbutanoyl)-4-hydroxy-N-(4-(4-methylthiazol-5-yl)benzyl)pyrrolidine-2-carboxamide 2,2,2-trifluoroacetate (18 mg, 58 %) over 2 steps.
1H NMR (MeOD-d4, 400 MHz): δ 9.11 (s, 1H), 7.51 – 7.41 (m, 4H), 4.57 – 4.47 (m, 3H), 4.45 – 4.36 (m, 2H), 4.04 (dd, J = 5.1, 10.6 Hz, 1H), 3.71 (dd, J = 3.6, 10.4 Hz, 1H), 2.95 (t, J = 7.5 Hz, 2H), 2.47 (s, 3H), 2.47 – 2.39 (m, 3H), 2.04 – 1.96 (m, 1H), 1.95 – 1.86 (m, 2H), 1.05 (s, 9H).
13C NMR (MeOD-d4, 101 MHz): δ 174.9, 174.6, 172.7, 153.7, 147.7, 140.6, 134.3, 130.9, 130.4, 129.2, 71.5, 61.1, 59.7, 57.6, 43.8, 40.4, 37.9, 35.9, 33.1, 27.0, 24.4, 15.2.
LCMS: expected mass for [M+H]+ (C26H37N5O4S), 502.25 m/z; found, 516.25 m/z.
E-5-bromo-4-hydrazineylidene-2-(methylthio)-4,5-dihydropyrimidine (12)
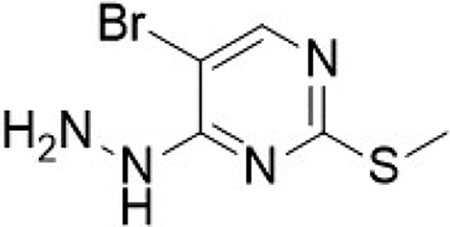
Prepared according to literature procedures (Huang et al., 2017). To a flask containing 5-bromo-4-chloro-2-(methylthio)pyrimidine (500 mg, 2.09 mmol, 1.0 equiv) in ethanol (10 mL), was added hydrazine monohydrate (340 mg, 4.39 mmol, 2.1 equiv) and the reaction was stirred at room temperature for 2 hrs. The reaction was filtered under vacuum with hexane to yield the desired product as a white solid E-5-bromo-4-hydrazineylidene-2-(methylthio)-4,5-dihydropyrimidine (484 mg, 99%).
1H NMR (MeOD-d4, 400 MHz): δ 8.89 (s, 1H), 3.26 (s, 3H).
13C NMR (MeOD-d4, 101 MHz): δ 178.6, 167.5, 163.9, 106.7, 23.3.
LCMS: expected mass for [M+H]+ (C5H7BrN4S), 234.96 m/z; found, 235.05 m/z.
8-bromo-5-(methylthio)-[1,2,4]triazolo[4,3-c]pyrimidine (13)
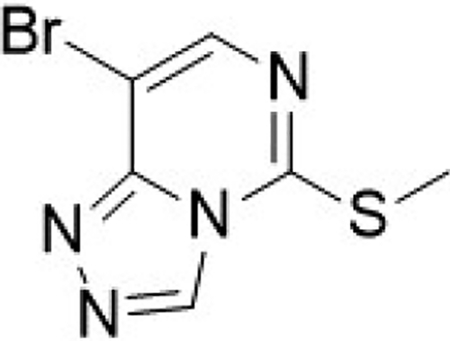
Prepared according to literature procedures (Huang et al., 2017). To a flask was added E-5-bromo-4-hydrazineylidene-2-(methylthio)-4,5-dihydropyrimidine (2.21 g, 9.39 mmol, 1.0 equiv), and triethoxymethane (1.39 g, 1.56 mL, 9.39 mmol, 1.0 equiv) and the reaction was heated to reflux (140 °C) for 4 h. The reaction was cooled to room temperature and the crude material concentrated in vacuo and purified by column chromatography (silica, 0–100% EtOAc in hexane) to yield the desired product as a white solid 8-bromo-5-(methylthio)-[1,2,4]triazolo[4,3-c]pyrimidine (1.64 g, 71%).
1H NMR (CDCl3, 400 MHz): δ 8.84 (s, 1H), 8.00 (s, 1H), 2.80 (s, 3H).
13C NMR (CDCl3, 101 MHz): δ 149.0, 147.4, 141.6, 133.9, 102.6, 14.1.
LCMS: expected mass for [M+H]+ (C6H5BrN4S), 244.94 m/z; found, 245.00 m/z.
(2S,4R)-1-((S)-2-(3-(4-(5-((furan-2-ylmethyl)amino)-[1,2,4]triazolo[4,3-c]pyrimidin-8-yl)benzamido)propanamido)-3,3-dimethylbutanoyl)-4-hydroxy-N-(4-(4-methylthiazol-5-yl)benzyl)pyrrolidine-2-carboxamide (UNC6851)
To a flask was added 4-(5-((furan-2-ylmethyl)amino)-[1,2,4]triazolo[4,3-c]pyrimidin-8-yl)benzoic acid (5 mg, 15 μmol, 1.0 equiv), DIPEA (7.8 μL, 45 μmol, 3.0 equiv) and 2-(1H-benzo[d][1,2,3]triazol-1-yl)-1,1,3,3-tetramethyluronium tetrafluoroborate (6.2 mg, 19 μmol, 1.3 equiv) followed by addition (2S,4R)-1-((S)-2-(3-aminopropanamido)-3,3-dimethylbutanoyl)-4-hydroxy-N-(4-(4-methylthiazol-5-yl)benzyl)pyrrolidine-2-carboxamide 2,2,2-trifluoroacetate (9.2 mg, 15.00 μmol, 1.0 equiv). The reaction was stirred at room temperature for 16 hrs, concentrated in vacuo and purified by preparative high-performance liquid chromatography (C18, 0–100% MeCN in H2O (0.1% TFA)) to yield the desired product as a white solid (3 mg, 27%).
1H NMR (MeOD-d4, 400 MHz): δ 9.06 (s, 1H), 8.04 (s, 1H), 7.97 – 7.91 (m, 4H), 7.48 (d, J = 1.7 Hz, 1H), 7.44 – 7.30 (m, 5H), 6.45 – 6.38 (m, 2H), 4.84 (s, 2H), 4.65 (s, 1H), 4.62 – 4.54 (m, 2H), 4.54 – 4.49 (m, 1H), 4.27 (d, J = 15.5 Hz, 1H), 3.97 (d, J = 10.4 Hz, 1H), 3.81 (dd, J = 3.9, 11.0 Hz, 1H), 3.78 – 3.71 (m, 1H), 3.66 – 3.57 (m, 1H), 2.69 – 2.57 (m, 2H), 2.44 (s, 3H), 2.29 – 2.22 (m, 1H), 2.12 – 2.05 (m, 1H), 1.05 (s, 9H).
LCMS: expected mass for [M+H]+ (C42H46N10O6S), 819.33 m/z; found, 819.20 m/z.
(2S,4R)-1-((S)-2-(4-(4-(5-((furan-2-ylmethyl)amino)-[1,2,4]triazolo[4,3-c]pyrimidin-8-yl)benzamido)butanamido)-3,3-dimethylbutanoyl)-4-hydroxy-N-(4-(4-methylthiazol-5-yl)benzyl)pyrrolidine-2-carboxamide (UNC6852)
To a flask was added 4-(5-((furan-2-ylmethyl)amino)-[1,2,4]triazolo[4,3-c]pyrimidin-8-yl)benzoic acid (5 mg, 15 μmol, 1.0 equiv), DIPEA (7.8 μL, 45 μmol, 3.0 equiv) and 2-(1H-benzo[d][1,2,3]triazol-1-yl)-1,1,3,3-tetramethyluronium tetrafluoroborate (6.2 mg, 19 μmol, 1.3 equiv) followed by addition (2S,4R)-1-((S)-2-(4-aminobutanamido)-3,3-dimethylbutanoyl)-4-hydroxy-N-(4-(4-methylthiazol-5-yl)benzyl)pyrrolidine-2-carboxamide 2,2,2-trifluoroacetate (9.4 mg, 15 μmol, 1.0 equiv). The reaction was stirred at room temperature for 16 hrs, concentrated in vacuo and purified by preparative high-performance liquid chromatography (C18, 0–100% MeCN in H2O (0.1% TFA)) to yield the desired product as a white solid (2 mg, 19%).
1H NMR (MeOD-d4, 400 MHz): δ 9.35 (s, 1H), 9.05 (s, 1H), 8.12 (s, 1H), 7.99 – 7.94 (m, 4H), 7.50 – 7.40 (m, 5H), 6.48 – 6.38 (m, 2H), 4.86 (s, 2H), 4.63 (s, 1H), 4.62 – 4.55 (m, 1H), 4.55 – 4.49 (m, 2H), 4.34 (d, J = 15.6 Hz, 1H), 3.93 (d, J = 11.0 Hz, 1H), 3.82 (dd, J = 3.8, 10.9 Hz, 1H), 3.49 – 3.39 (m, 2H), 2.47 (s, 3H), 2.43 – 2.37 (m, 2H), 2.27 – 2.19 (m, 1H), 2.12 – 2.06 (m, 1H), 1.99 – 1.90 (m, 2H), 1.06 (s, 9H).
13C NMR (MeOD-d4, 101 MHz): δ 175.4, 174.5, 172.4, 169.6, 160.6, 153.5, 152.0, 145.5, 145.3, 143.8, 140.7, 137.3, 135.1, 130.8, 130.3, 129.4, 129.0, 128.9, 128.8, 111.9, 111.6, 109.4, 71.1, 60.9, 59.3, 58.0, 43.7, 40.5, 39.4, 39.0, 36.5, 34.0, 27.1, 26.7, 15.3.
LCMS: expected mass for [M+H]+ (C43H48N10O6S), 833.35 m/z; found, 833.20 m/z.
(2S,4R)-1-((S)-2-(5-(4-(5-((furan-2-ylmethyl)amino)-[1,2,4]triazolo[4,3-c]pyrimidin-8-yl)benzamido)pentanamido)-3,3-dimethylbutanoyl)-4-hydroxy-N-(4-(4-methylthiazol-5-yl)benzyl)pyrrolidine-2-carboxamide (UNC6853)
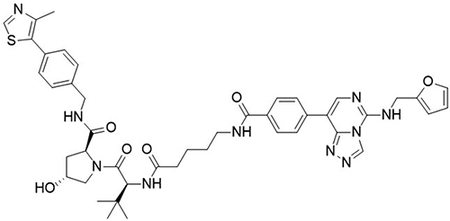
To a flask was added 4-(5-((furan-2-ylmethyl)amino)-[1,2,4]Striazolo[4,3-c]pyrimidin-8-yl)benzoic acid (5 mg, 15 μmol, 1.0 equiv), DIPEA (7.8 μL, 45 μmol, 3.0 equiv) and 2-(1H-benzo[d][1,2,3]triazol-1-yl)-1,1,3,3-tetramethyluronium tetrafluoroborate (6.2 mg, 19 μmol, 1.3 equiv) followed by addition (2S,4R)-1-((S)-2-(5-aminopentanamido)-3,3-dimethylbutanoyl)-4-hydroxy-N-(4-(4-methylthiazol-5-yl)benzyl)pyrrolidine-2-carboxamide 2,2,2-trifluoroacetate (9.6 mg, 15 μmol, 1.0 equiv). The reaction was stirred at room temperature for 16 hrs, concentrated in vacuo and purified by preparative high-performance liquid chromatography (C18, 0–100% MeCN in H2O (0.1% TFA)) to yield the desired product as a white solid (2 mg, 19 %).
1H NMR (MeOD-d4, 400 MHz): δ 9.03 (s, 1H), 8.09 (s, 1H), 7.94 (ap s, 4H), 7.47 – 7.31 (m, 6H), 6.40 (dd, J = 2.6, 19.7 Hz, 2H), 4.61 (s, 1H), 4.58 – 4.52 (m, 1H), 4.51 – 4.46 (m, 2H), 4.32 (d, J = 15.7 Hz, 1H), 3.89 (d, J = 11.0 Hz, 1H), 3.79 (dd, J = 3.9, 10.9 Hz, 1H), 3.41 (t, J = 6.4 Hz, 2H), 2.45 (s, 3H), 2.37 – 2.31 (m, 2H), 2.23 – 2.17 (m, 1H), 2.10 – 2.03 (m, 1H), 1.73 – 1.62 (m, 4H), 1.02 (s, 9H), 2 × H not observed (under H2O peak).
LCMS: expected mass for [M+H]+ (C44H50N10O6S), 847.36 m/z; found, 847.20 m/z.
(2S,4R)-1-((S)-13-(tert-butyl)-1-(4-(5-((furan-2-ylmethyl)amino)-[1,2,4]triazolo[4,3-c]pyrimidin-8-yl)phenyl)-1,11-dioxo-5,8-dioxa-2,12-diazatetradecan-14-oyl)-4-hydroxy-N-(4-(4-methylthiazol-5-yl)benzyl)pyrrolidine-2-carboxamide (UNC6845)
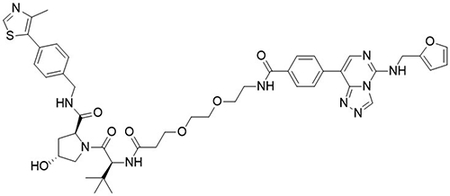
To a flask was 4-(5-((furan-2-ylmethyl)amino)-[1,2,4]triazolo[4,3-c]pyrimidin-8-yl)benzoic acid (10 mg, 30 μmol, 1.0 equiv), DIPEA (16 μL, 90 μmol, 3.0 equiv) and 2-(1H-benzo[d][1,2,3]triazol-1-yl)-1,1,3,3-tetramethyluronium tetrafluoroborate (12.4 mg, 39 μmol, 1.3 equiv) followed by addition of (2S,4R)-1-((S)-2-(3-(2-(2-aminoethoxy)ethoxy)propanamido)-3,3-dimethylbutanoyl)-4-hydroxy-N-(4-(4-methylthiazol-5-yl)benzyl)pyrrolidine-2-carboxamide 2,2,2-trifluoroacetate (21 mg, 30 μmol, 1.0 equiv). The reaction was stirred at room temperature for 16 hrs, concentrated in vacuo and purified by preparative high-performance liquid chromatography (C18, 0–100% MeCN in H2O (0.1% TFA)) to yield the desired product as a white solid (3 mg, 10 %).
1H NMR (MeOD-d4, 400 MHz): δ 9.35 (s, 1H), 9.07 (s, 1H), 8.14 (s, 1H), 7.96 (ap s, 4H), 7.50 – 7.47 (m, 1H), 7.47 – 7.37 (m, 4H), 6.46 – 6.37 (m, 2H), 4.66 (s, 1H), 4.57 (dd, J = 7.4, 15.2 Hz, 2H), 4.51 – 4.46 (m, 2H), 4.33 (d, J = 15.5 Hz, 1H), 3.89 (d, J = 11.2 Hz, 1H), 3.79 (dd, J = 3.8, 11.0 Hz, 1H), 3.75 – 3.58 (m, 10H), 2.53 – 2.43 (m, 4H), 2.21 (dd, J = 7.7, 13.2 Hz, 1H), 2.11 – 2.02 (m, 1H), 1.03 (s, 9H), 2 × H not observed (under H2O peak).
LCMS: expected mass for [M+H]+ (C46H54N10O8S), 907.38 m/z; found, 907.20 m/z.
(2S,4R)-1-((S)-15-(tert-butyl)-1-(4-(5-((furan-2-ylmethyl)amino)-[1,2,4]triazolo[4,3-c]pyrimidin-8-yl)phenyl)-1,13-dioxo-5,8,11-trioxa-2,14-diazahexadecan-16-oyl)-4-hydroxy-N-(4-(4-methylthiazol-5-yl)benzyl)pyrrolidine-2-carboxamide (UNC6846)
To a flask was 4-(5-((furan-2-ylmethyl)amino)-[1,2,4]triazolo[4,3-c]pyrimidin-8-yl)benzoic acid (5 mg, 15 μmol, 1.0 equiv), DIPEA (8 μL, 45 μmol, 3.0 equiv) and 2-(1H-benzo[d][1,2,3]triazol-1-yl)-1,1,3,3-tetramethyluronium tetrafluoroborate (6.2 mg, 19 μmol, 1.3 equiv) followed by addition of (2S,4R)-1-((S)-14-amino-2-(tert-butyl)-4-oxo-6,9,12-trioxa-3-azatetradecanoyl)-4-hydroxy-N-(4-(4-methylthiazol-5-yl)benzyl)pyrrolidine-2-carboxamide 2,2,2-trifluoroacetate (21 mg, 30 μmol, 1.0 equiv). The reaction was stirred at room temperature for 16 hrs, concentrated in vacuo and purified by preparative high-performance liquid chromatography (C18, 0–100% MeCN in H2O (0.1% TFA)) to yield the desired product as a white solid (4 mg, 30 %).
1H NMR (MeOD-d4, 400 MHz): δ 9.36 (s, 1H), 9.11 (s, 1H), 8.16 (s, 1H), 7.97 – 7.91 (m, 4H), 7.50 – 7.48 (m, 1H), 7.48 – 7.39 (m, 4H), 6.47 – 6.37 (m, 2H), 4.69 (s, 1H), 4.58 (dd, J = 7.6, 15.2 Hz, 2H), 4.52 – 4.47 (m, 2H), 4.34 (d, J = 15.6 Hz, 1H), 4.03 – 3.88 (m, 3H), 3.80 (dd, J = 3.7, 10.9 Hz, 1H), 3.72 – 3.62 (m, 10H), 3.63 – 3.53 (m, 1H), 2.48 (s, 3H), 2.26 – 2.19 (m, 1H), 2.12 – 2.04 (m, 1H), 1.03 (s, 9H), 2 × H not observed (under H2O peak).
LCMS: expected mass for [M+H]+ (C47H56N10O9S), 937.40 m/z; found, 937.20 m/z.
(2S,4R)-1-((S)-19-(tert-butyl)-1-(4-(5-((furan-2-ylmethyl)amino)-[1,2,4]triazolo[4,3-c]pyrimidin-8-yl)phenyl)-1,17-dioxo-5,8,11,14-tetraoxa-2,18-diazaicosan-20-oyl)-4-hydroxy-N-(4-(4-methylthiazol-5-yl)benzyl)pyrrolidine-2-carboxamide (UNC6847)
To a flask was 4-(5-((furan-2-ylmethyl)amino)-[1,2,4]triazolo[4,3-c]pyrimidin-8-yl)benzoic acid (10 mg, 30 μmol, 1.0 equiv), DIPEA (16 μL, 90 μmol, 3.0 equiv) and 2-(1H-benzo[d][1,2,3]triazol-1-yl)-1,1,3,3-tetramethyluronium tetrafluoroborate (12.4 mg, 39 μmol, 1.3 equiv) followed by addition of (2S,4R)-1-((S)-1-amino-17-(tert-butyl)-15-oxo-3,6,9,12-tetraoxa-16-azaoctadecan-18-oyl)-4-hydroxy-N-(4-(4-methylthiazol-5-yl)benzyl)pyrrolidine-2-carboxamide 2,2,2-trifluoroacetate (24 mg, 30 μmol, 1.0 equiv). The reaction was stirred at room temperature for 16 hrs, concentrated in vacuo and purified by preparative high-performance liquid chromatography (C18, 0–100% MeCN in H2O (0.1% TFA)) to yield the desired product as a white solid (2 mg, 6 %).
1H NMR (MeOD-d4, 400 MHz): δ 9.35 (s, 1H), 9.05 (s, 1H), 8.14 (s, 1H), 8.00 – 7.95 (m, 4H), 7.49 – 7.48 (m, 1H), 7.47 – 7.39 (m, 4H), 6.47 – 6.38 (m, 2H), 4.63 (s, 1H), 4.59 – 4.53 (m, 2H), 4.53 – 4.47 (m, 2H), 4.34 (d, J = 15.7 Hz, 1H), 3.88 (d, J = 11.0 Hz, 1H), 3.79 (dd, J = 3.8, 11.0 Hz, 1H), 3.73 – 3.54 (m, 17H), 2.58 – 2.50 (m, 1H), 2.48 (s, 3H), 2.46 – 2.40 (m, 1H), 2.24 – 2.17 (m, 1H), 2.12 – 2.01 (m, 1H), 1.02 (s, 9H), 2 × aliphatic H not observed (under H2O peak).
LCMS: expected mass for [M+H]+ (C50H62N10O10S), 995.44 m/z; found, [M/2+H]+ 498.30 m/z.
(2S,4S)-1-((S)-2-(4-(4-(5-((furan-2-ylmethyl)amino)-[1,2,4]triazolo[4,3-c]pyrimidin-8-yl)benzamido)butanamido)-3,3-dimethylbutanoyl)-4-hydroxy-N-(4-(4-methylthiazol-5-yl)benzyl)pyrrolidine-2-carboxamide (UNC7043)
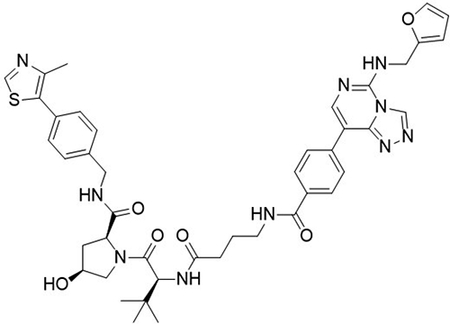
To a flask was 4-(5-((furan-2-ylmethyl)amino)-[1,2,4]triazolo[4,3-c]pyrimidin-8-yl)benzoic acid (10 mg, 30 μmol, 1.0 equiv), DIPEA (16 μL, 90 μmol, 3.0 equiv) and 2-(1H-benzo[d][1,2,3]triazol-1-yl)-1,1,3,3-tetramethyluronium tetrafluoroborate (12.4 mg, 39 μmol, 1.3 equiv) followed by addition of (2S,4R)-1-((S)-1-amino-17-(tert-butyl)-15-oxo-3,6,9,12-tetraoxa-16-azaoctadecan-18-oyl)-4-hydroxy-N-(4-(4-methylthiazol-5-yl)benzyl)pyrrolidine-2-carboxamide 2,2,2-trifluoroacetate (24 mg, 30 μmol, 1.0 equiv). The reaction was stirred at room temperature for 16 hrs, concentrated in vacuo and purified by preparative high-performance liquid chromatography (C18, 0–100% MeCN in H2O (0.1% TFA)) to yield the desired product as a white solid (4 mg, 18 %).
1H NMR (MeOD-d4, 400 MHz): δ 9.35 (s, 1H), 9.09 (s, 1H), 8.14 (s, 1H), 7.97 (ap s, 4H), 7.49 – 7.38 (m, 5H), 6.47 – 6.36 (m, 2H), 4.56 (d, J = 15.5 Hz, 1H), 4.53 – 4.48 (m, 2H), 4.42 – 4.33 (m, 2H), 4.06 (dd, J = 5.1, 10.5 Hz, 1H), 3.70 (dd, J = 3.9, 10.5 Hz, 1H), 3.48 – 3.37 (m, 2H), 2.48 (s, 3H), 2.47 – 2.36 (m, 3H), 2.01 – 1.88 (m, 3H), 1.06 (s, 9H), 2 × aliphatic H not observed (under H2O peak).
13C NMR (MeOD-d4, 101 MHz): δ 175.7, 174.9, 172.7, 169.6, 160.4, 160.0, 153.6, 152.0, 145.7, 145.3, 143.8, 140.6, 139.0, 137.2, 135.1, 130.8, 130.4, 129.1, 128.9, 128.8, 111.7, 111.6, 109.4, 71.5, 61.0, 59.7, 57.6, 43.8, 40.5, 39.4, 37.9, 35.9, 33.8, 27.0, 26.7, 15.2.
LCMS: expected mass for [M+H]+ (C43H48N10O6S), 833.35 m/z; found, 833.25 m/z.
QUANTIFICATION AND STATISTICAL ANALYSIS
The method of determining error bars is indicated in the corresponding figure legend and biological replicate number is indicated. Statistical significance for proteomics was calculated as outlined in the STAR Methods for Global Proteomics Analysis.
DATA AND CODE AVAILABILITY
The mass spectrometry proteomics data have been deposited to the ProteomeXchange Consortium via the PRIDE partner repository with the dataset identifier PXD016021 (Vizcaino et al., 2013).
Supplementary Material
SIGNIFICANCE.
The misregulation of PRC2 due to EZH2 overexpression or EZH2 gain-of-function mutations is prevalent in oncogenesis. Despite the growing number of EZH2 inhibitors in the clinic, inhibitor resistance through subsequent EZH2 mutations and chemoresistance is still a concern and new therapeutic approaches are clearly needed. Using an EED-targeted bivalent chemical degrader (UNC6852), we demonstrate the successful degradation of all core PRC2 components including EED, EZH2, and SUZ12. PRC2 degradation leads to a loss in PRC2 catalytic activity, a decrease in H3K27me3 levels, and antiproliferative effects in DLBCL cell lines with EZH2 gain-of-function mutations. Importantly, the antiproliferative effects of UNC6852 are comparable to those of potent inhibitors of EZH2 and EED. UNC6852 provides a unique tool for studying PRC2 function and downregulation of PRC2 activity in cancer. Additionally, PRC2-targeted degraders may have the ability to overcome acquired resistance to EZH2 small molecule inhibitors and provide a complementary therapeutic strategy to compounds currently in clinical development.
ACKNOWLEDGEMENTS
This work was supported by the National Institute on Drug Abuse, National Institutes of Health (NIH) (Grant R61DA047023-01) and the University Cancer Research Fund, University of North Carolina at Chapel Hill to L.I.J. and the National Institute of General Medical Sciences, NIH (Grant R01GM100919) to S.V.F. This research is based in part upon work conducted using the UNC Proteomics Core Facility, which is supported in part by P30CA016086 Cancer Center Core Support Grant to the UNC Lineberger Comprehensive Cancer Center. The authors thank Stephen V. Frye, Brian D. Strahl, Raghuvar Dronamraju, and Edward P. Browne for their helpful discussions throughout the project. The authors thank Ronan P. Hanley for reviewing the primary chemistry data and Jarod M. Waybright for reviewing the primary biology data. The authors thank Cristin M. Galardi for her guidance using the Jess (ProteinSimple) and Brian P. Hardy for assembly of the screening plate for TR-FRET.
Footnotes
DECLARATION OF INTERESTS
The authors declare no competing interests.
REFERENCES
- An S and Fu L (2018). Small-molecule PROTACs: An emerging and promising approach for the development of targeted therapy drugs, EBioMedicine, 36, 553–562. [DOI] [PMC free article] [PubMed] [Google Scholar]
- Baker T et al. (2015). Acquisition of a single EZH2 D1 domain mutation confers acquired resistance to EZH2-targeted inhibitors, Oncotarget, 6, 32646–32655. [DOI] [PMC free article] [PubMed] [Google Scholar]
- Barnash KD et al. (2017). Discovery of Peptidomimetic Ligands of EED as Allosteric Inhibitors of PRC2, ACS Comb. Sci, 19, 161–172. [DOI] [PMC free article] [PubMed] [Google Scholar]
- Bondeson DP et al. (2015). Catalytic in vivo protein knockdown by small-molecule PROTACs, Nat. Chem. Biol, 11, 611–617. [DOI] [PMC free article] [PubMed] [Google Scholar]
- Bracken AP et al. (2003). EZH2 is downstream of the pRB-E2F pathway, essential for proliferation and, EMBO Journal, 22, 5323–5335. [DOI] [PMC free article] [PubMed] [Google Scholar]
- Brooun A et al. (2016). Polycomb repressive complex 2 structure with inhibitor reveals a mechanism of activation and drug resistance, Nat. Commun, 7, 11384. [DOI] [PMC free article] [PubMed] [Google Scholar]
- Buckley DL et al. (2015). HaloPROTACS: Use of Small Molecule PROTACs to Induce Degradation of HaloTag Fusion Proteins, ACS Chem. Biol, 10, 1831–1837. [DOI] [PMC free article] [PubMed] [Google Scholar]
- Cardote TAF, Gadd MS and Ciulli A (2017). Crystal Structure of the Cul2-Rbx1-EloBC-VHL Ubiquitin Ligase Complex, Structure, 25, 901–911. [DOI] [PMC free article] [PubMed] [Google Scholar]
- Chan KH et al. (2018). Impact of Target Warhead and Linkage Vector on Inducing Protein Degradation: Comparison of Bromodomain and Extra-Terminal (BET) Degraders Derived from Triazolodiazepine (JQ1) and Tetrahydroquinoline (I-BET726) BET Inhibitor Scaffolds, J. Med. Chem, 61, 504–513. [DOI] [PMC free article] [PubMed] [Google Scholar]
- Cromm PM and Crews CM (2017). Targeted Protein Degradation: from Chemical Biology to Drug Discovery, Cell Chem. Biol, 24, 1181–1190. [DOI] [PMC free article] [PubMed] [Google Scholar]
- Cyrus K et al. (2011). Impact of linker length on the activity of PROTACs, Mol. BioSyst, 7, 359–364. [DOI] [PMC free article] [PubMed] [Google Scholar]
- Dilworth D and Barsyte-Lovejoy D (2019). Targeting protein methylation: from chemical tools to precision medicines, Cell. Mol. Life Sci, 76, 2967–2985. [DOI] [PMC free article] [PubMed] [Google Scholar]
- Ferrari KJ et al. (2014). Polycomb-Dependent H3K27me1 and H3K27me2 Regulate Active Transcription and Enhancer Fidelity, Mol. Cell, 53(1), 49–62. [DOI] [PubMed] [Google Scholar]
- Fischer ES et al. (2014). Structure of the DDB1-CRBN E3 ubiquitin ligase in complex with thalidomide, Nature, 512, 49–53. [DOI] [PMC free article] [PubMed] [Google Scholar]
- Frost J et al. (2016). Potent and selective chemical probe of hypoxic signalling downstream of HIF-α hydroxylation via VHL inhibition, Nat. Commun, 7, 1–12. [DOI] [PMC free article] [PubMed] [Google Scholar]
- Gadd MS et al. (2017). Structural basis of PROTAC cooperative recognition for selective protein degradation, Nat. Chem. Biol, 13, 514–521. [DOI] [PMC free article] [PubMed] [Google Scholar]
- Gan L et al. (2018). Epigenetic regulation of cancer progression by EZH2 : from biological insights to therapeutic potential, Biomark Res., 6:10. [DOI] [PMC free article] [PubMed] [Google Scholar]
- Genta S, Pirosa MC and Stathis A (2019). BET and EZH2 Inhibitors: Novel Approaches for Targeting Cancer, Curr. Oncol. Rep, 21. [DOI] [PubMed] [Google Scholar]
- Gibaja V et al. (2016). Development of secondary mutations in wild-type and mutant EZH2 alleles cooperates to confer resistance to EZH2 inhibitors, Oncogene, 35, 558–566. [DOI] [PMC free article] [PubMed] [Google Scholar]
- Girardini M et al. (2019). Cereblon versus VHL: Hijacking E3 ligases against each other using PROTACs, Bioorg. Med. Chem, 27, 2466–2479. [DOI] [PMC free article] [PubMed] [Google Scholar]
- He Y et al. (2017). The EED protein-protein interaction inhibitor A-395 inactivates the PRC2 complex, Nat. Chem. Biol, 13, 389–395. [DOI] [PubMed] [Google Scholar]
- Huang HT et al. (2018). A Chemoproteomic Approach to Query the Degradable Kinome Using a Multi-kinase Degrader, Cell Chem. Biol, 2, 88–99. [DOI] [PMC free article] [PubMed] [Google Scholar]
- Huang Y et al. (2017). Discovery of First-in-Class, Potent, and Orally Bioavailable Embryonic Ectoderm Development (EED) Inhibitor with Robust Anticancer Efficacy, J. Med. Chem, 60, 2215–2226. [DOI] [PubMed] [Google Scholar]
- Hyun K et al. (2017). Writing, erasing and reading histone lysine methylations, Exp. Mol. Med, 49, e324–22. [DOI] [PMC free article] [PubMed] [Google Scholar]
- Justin N et al. (2016). Structural basis of oncogenic histone H3K27M inhibition of human polycomb repressive complex 2, Nat. Commun, 7, 11316. [DOI] [PMC free article] [PubMed] [Google Scholar]
- Kasinath V et al. (2018). Structures of human PRC2 with its cofactors AEBP2 and JARID2, Science, 359, 940–944. [DOI] [PMC free article] [PubMed] [Google Scholar]
- Konze KD et al. (2013). An orally bioavailable chemical probe of the lysine methyltransferases EZH2 and EZH1, ACS Chem. Biol, 8, 1324–1334. [DOI] [PMC free article] [PubMed] [Google Scholar]
- Lee CH et al. (2018). Allosteric Activation Dictates PRC2 Activity Independent of Its Recruitment to Chromatin, Mol. Cell, 70, 422–434. [DOI] [PMC free article] [PubMed] [Google Scholar]
- Liu LJ and X. (2015). Structural basis of histone H3K27 trimethylation by an active polycomb repressive complex 2, Science, 350, aac4383. [DOI] [PMC free article] [PubMed] [Google Scholar]
- Liu YL et al. (2015). Expression and clinicopathological significance of EED, SUZ12 and EZH2 mRNA in colorectal cancer, J. Cancer Res. Clin. Oncol, 141, 661–669. [DOI] [PubMed] [Google Scholar]
- Maniaci C et al. (2017). Homo-PROTACs: Bivalent small-molecule dimerizers of the VHL E3 ubiquitin ligase to induce self-degradation, Nat. Commun, 8. [DOI] [PMC free article] [PubMed] [Google Scholar]
- Margueron R et al. (2008). Ezh1 and Ezh2 Maintain Repressive Chromatin through Different Mechanisms, Mol. Cell, 32, 503–518. [DOI] [PMC free article] [PubMed] [Google Scholar]
- Margueron R and Reinberg D (2011). The Polycomb complex PRC2 and its mark in life, Nature, 469, 343–349. [DOI] [PMC free article] [PubMed] [Google Scholar]
- McCabe MT et al. (2012). EZH2 inhibition as a therapeutic strategy for lymphoma with EZH2-activating mutations, Nature, 492, 108–112. [DOI] [PubMed] [Google Scholar]
- Montgomery ND et al. (2007). Molecular and Functional Mapping of EED Motifs Required for PRC2-Dependent Histone Methylation, J. Mol. Biol, 374, 1145–1157. [DOI] [PMC free article] [PubMed] [Google Scholar]
- Mullard A (2019). First targeted protein degrader hits the clinic, Nat. Rev. Drug Discov doi: 10.1038/d41573-019-00043-6. [DOI] [PubMed] [Google Scholar]
- Peng JC et al. (2009). Jarid2 / Jumonji Coordinates Control of PRC2 Enzymatic Activity and Target Gene Occupancy in Pluripotent Cells, Cell, 139, 1290–1302. [DOI] [PMC free article] [PubMed] [Google Scholar]
- Poepsel S, Kasinath V and Nogales E (2018). Cryo-EM structures of PRC2 simultaneously engaged with two functionally distinct nucleosomes, Nat. Struct. Mol. Biol, 25, 154–162. [DOI] [PMC free article] [PubMed] [Google Scholar]
- Qi W et al. (2017). An allosteric PRC2 inhibitor targeting the H3K27me3 binding pocket of EED, Nat. Chem. Biol, 13, 381–388. [DOI] [PubMed] [Google Scholar]
- Rectenwald JM et al. (2019). A General TR-FRET Assay Platform for High-Throughput Screening and Characterizing Inhibitors of Methyl-Lysine Reader Proteins, SLAS Discovery, 24, 693–700. [DOI] [PMC free article] [PubMed] [Google Scholar]
- Riching KM et al. (2018). Quantitative Live-Cell Kinetic Degradation and Mechanistic Profiling of PROTAC Mode of Action, ACS Chem. Biol, 13, 2758–2770. [DOI] [PubMed] [Google Scholar]
- Rizq O et al. (2017). Dual Inhibition of EZH2 and EZH1 Sensitizes PRC2-Dependent Tumors to Proteasome Inhibition, Clin. Cancer Res, 1–15. [DOI] [PMC free article] [PubMed] [Google Scholar]
- Salami J and Crews CM (2017). Waste disposal - An attractive strategy for cancer therapy, Science, 355, 1163–1167. [DOI] [PubMed] [Google Scholar]
- Shortt J et al. (2017). A chemical probe toolbox for dissecting the cancer epigenome, Nat. Rev. Cancer, 17, 160–183. [DOI] [PubMed] [Google Scholar]
- Smith BE et al. (2019). Differential PROTAC substrate specificity dictated by orientation of recruited E3 ligase, Nat. Commun, 10, 1–13. [DOI] [PMC free article] [PubMed] [Google Scholar]
- Veneti Z, Gkouskou KK and Eliopoulos AG (2017). Polycomb Repressor Complex 2 in Genomic Instability and Cancer, Int. J. Mol. Sci, 119, 1–16. [DOI] [PMC free article] [PubMed] [Google Scholar]
- Vizcaino JA et al. , (2013). The PRoteomics IDEntifications (PRIDE) database and associated tools: status in 2013. Nucleic Acid Res, 41, (D1):D1063–9. doi: 10.1093/nar/gks1262. [DOI] [PMC free article] [PubMed] [Google Scholar]
- Xu B et al. (2015). Targeting EZH2 and PRC2 dependence as novel anticancer therapy, Exp. Hematol, 43, 698–712. [DOI] [PMC free article] [PubMed] [Google Scholar]
- Yuan C et al. (2018). Total synthesis, structural revision and biological evaluation of γ-elemene-type sesquiterpenes, Org. Biomol. Chem, 16, 7843–7850. [DOI] [PubMed] [Google Scholar]
- Zou Y, Ma D and Wang Y (2019). The PROTAC technology in drug development, Cell Biochemi. Funct, 37, 21–30. [DOI] [PMC free article] [PubMed] [Google Scholar]
Associated Data
This section collects any data citations, data availability statements, or supplementary materials included in this article.
Supplementary Materials
Data Availability Statement
The mass spectrometry proteomics data have been deposited to the ProteomeXchange Consortium via the PRIDE partner repository with the dataset identifier PXD016021 (Vizcaino et al., 2013).