SIGNIFICANCE
Assessing and managing glaucoma are a complicated process in which experience plays a key role in decision making. Although advanced glaucoma is more easily diagnosed, patients with early glaucoma or who present with suspicious findings are more complicated. A need to aid clinicians in the decision-making process exists.
PURPOSE
The purpose of this study was to assess the impact of en face ocular coherence tomography images to clinical decision making when added to standard presentations of circumpapillary retinal nerve fiber layer thickness and automated perimetry.
METHODS
Thirty participants from two centers presenting either as a glaucoma suspect or for an initial glaucoma evaluation were enrolled. Six masked investigators were given standard presentations of circumpapillary retinal nerve fiber layer thickness and perimetry. They were asked if glaucomatous damage was present as well as a recommended plan of management on 5-point Likert scales. They were then given en face images of the retinal nerve fiber layer in three different presentations coupled with the standard presentation, and the questions were repeated. An intraclass correlation coefficient (ICC) was generated.
RESULTS
The masked investigators had moderate agreement from the standard presentation for assessment (ICC = 0.67 [95% confidence interval {CI}, 0.54 to 0.80] and ICC = 0.69 [95% CI, 0.52 to 0.80], respectively), as well as with the addition of the en face images (ICC = 0.69; 95% CI, 0.56 to 0.81). The en face images tended to change decisions in both assessment and plan toward likely to have glaucoma and likely to start treatment.
CONCLUSIONS
The addition of en face images to a standard presentation has an impact on clinical decision making. Although en face images seem to influence the decision toward likely to have glaucoma and likely to treat, it is unclear if this leads to a more accurate decision. Further investigations seem warranted to assess sensitivity and specificity of this approach.
When evaluating patients as glaucoma suspects, clinicians evaluate structure and function to decide on the likelihood the patient has glaucomatous damage. Unfortunately, there is often a discordance in testing between structure and function,1,2 which often leads to the clinician relying on clinical experience for decision making. Spaeth et al.3 provide useful techniques to guide clinicians in decision making depending on the clinical appearance of the optic nerve head, and clinical photography of the retinal nerve fiber layer provides the clinician a qualitative but not a quantitative approach.4 Optical coherence tomography provides a proven aid to clinicians in deciding the probability of glaucomatous damage using retinal nerve fiber layer thickness5,6 imaging coupled with standard automated perimetry. However, differences in perimetric stimuli, location, and density of the retinal nerve fiber layer damage can provide variable information to the clinician.7 In addition, optical coherence tomography can flag areas of concern that are variants of normal anatomy,8 and visual field testing may demonstrate concern without structural evidence from structural measures9,10 or clinician assessment of the optic nerve head. This leaves a gap for more or improved testing to help with clinical decision making in deciding between normal or early glaucomatous damage.
Using optical coherence tomography, reflectance of the retinal nerve fiber can also be used to illustrate glaucomatous defects. Pons et al.11 demonstrated that internal reflectivity of the retinal nerve fiber from optical coherence tomography was lower in patients with glaucoma than in control participants. Furthermore, Hood et al.12 compared en face slab images from optical coherence tomography with adaptive optics scanning laser ophthalmoscopy images, commenting that the en face images may provide more useful information to complement retinal nerve fiber layer thickness measurements in patients with glaucoma. Further evidence of this complementary benefit of en face and retinal nerve fiber thickness has been presented in which masked investigators were asked to compare structural optical coherence tomography measures with functional loss (King BJ, et al. IOVS 2015;56:ARVO E-Abstract 1990).
Given that en face optical coherence tomography has the ability to image retinal nerve fiber bundles, allowing the clinician to visualize defects within the retinal nerve fiber layer, this possible complementary aspect to traditional imaging may fill a gap in decision making. Because diagnosing early-onset glaucoma can be more challenging than moderate or advanced disease, en face optical coherence tomography may provide a more important role in managing this subset of patients.
Circumpapillary retinal nerve fiber layer scans from optical coherence tomography are a standard method for clinicians to evaluate change to the retinal nerve fiber layer secondary to glaucoma. Coupled with automated perimetry and clinical examination, these techniques often become the basis for decision making in glaucoma suspects. In addition, en face retinal nerve fiber bundle reflectance allows the clinician to visualize defects within the retinal nerve fiber layer.12,13 In this pilot, prospective, observational study, we investigate the impact of en face reflectance imaging on clinical decision making for glaucoma suspects to ascertain whether further development of these methods has potential clinical use.
METHODS
Subjects
Thirty participants presenting to one of two eye care centers as a glaucoma suspect or for an initial glaucoma evaluation were enrolled. Eleven of the participants were enrolled at the Indiana University School of Optometry and 19 at the Illinois College of Optometry. This study followed the guidelines of the Declaration of Helsinki and was approved by the Indiana University Institutional Review Board and Illinois College of Optometry Institutional Review Board, and informed consent in writing before testing was obtained from all participants. “Glaucoma suspect” was defined as having at least a glaucomatous-appearing optic nerve head or a visual field defect consistent with glaucoma. A glaucomatous-appearing optic nerve head was characterized by evidence of excavation, notching or thinning of the neuroretinal rim, thin sectoral area of the retinal nerve fiber layer, or asymmetric vertical cup-to-disc ratio greater than 0.2 (photography or ocular coherence tomography). A visual field defect consistent with glaucoma was defined as an abnormality with either a total deviation or a pattern deviation showing defects at two or more contiguous locations with P < .01, or three or more contiguous points with P < .05 in a pattern consistent with glaucoma. IOP was not a determining factor.
Inclusion and Exclusion Criteria
Inclusion criteria included participants aged 21 to 85 years, best-corrected visual acuity of 20/40 or better, refractive correction spherical equivalent between +3.00 and −6.00 D, and clear ocular media to allow imaging. All participants had to be able to perform reliable visual fields having less than 25% fixation losses, false positives, and false negatives. Exclusion criteria consisted of having known ocular diseases except for possibly having glaucoma, medications or conditions that could impair visual function, systemic conditions affecting visual function, and history of intraocular surgery except uncomplicated cataract surgery.
Study Protocol
Each subject had a 24-2 (Humphrey Field Analyzer; Carl Zeiss Meditec, Dublin, CA) visual field, as well as circumpapillary retinal nerve fiber layer measurement and a six-scan optical coherence tomography (Spectralis; Heidelberg Engineering, Heidelberg, Germany) protocol that covers approximately the central 24°14 (Fig. 1). All scans had to have a minimal quality value of 20 to be incorporated into the study, and scans with segmentation errors were repeated to resolve artifacts. For the six-scan protocol, high speed-imaging mode (11 μm between A-scans) was selected, with the distance between B-scans set at 30 μm, and each B-scan was averaged more than nine frames. A custom MATLAB (R201b; The MathWorks, Inc., Natick, MA) program montaged and produced en face images referenced to the inner limiting membrane. Six masked investigators (three from the Illinois College of Optometry and three from Indiana University), who were not part of the initial testing, went through a training module on the en face techniques and then were given the collected optical coherence tomography and perimetry results for each subject in fillable PDF forms (Fig. 2). These forms then autopopulated a spreadsheet to allow for comparisons.
FIGURE 1.
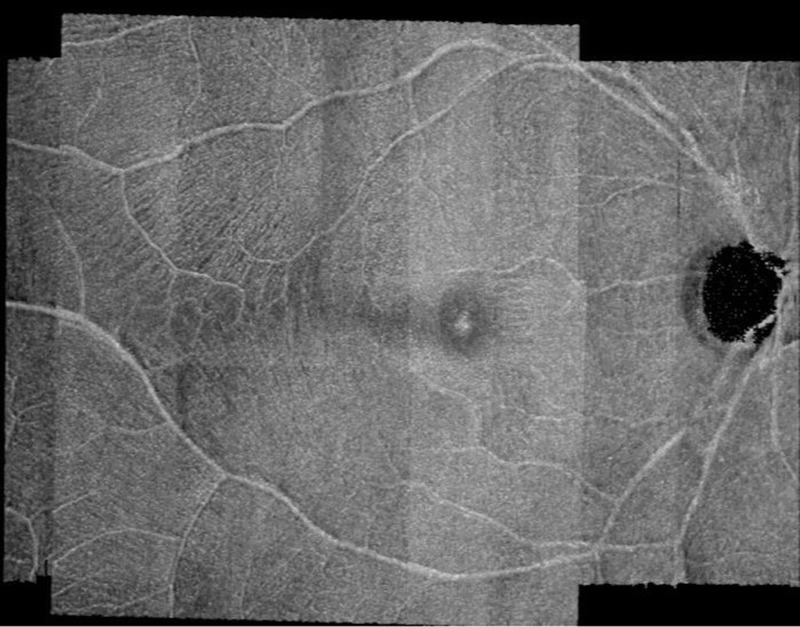
Illustration of six-scan protocol covering the posterior pole. One can visualize the retinal nerve fiber layer coursing from the temporal raphe to the optic nerve head.
FIGURE 2.
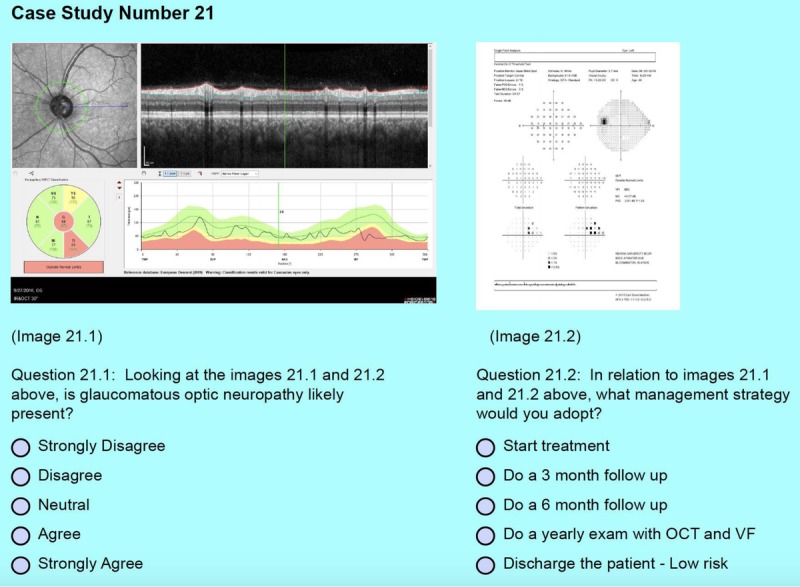
An example of the standard presentation to the masked investigators. The top half provides the circumpapillary retinal nerve fiber layer thickness scan and the corresponding 24-2. The bottom half displays the questions for the investigators to answer.
The masked investigators were a combination of providers with a minimum of 9 years of experience up to 40 years, with an average of 21 years working in either a primary care setting or glaucoma-based clinics. The combination of the examiners was chosen to give a more general experience rather than purely glaucoma specialists. Each examiner participated in a training module in which they were able to view examples of en face presentations in control subjects and patients with glaucoma. Examples also illustrated artifacts that can occur in the new en face modalities.
Three presentations of the participants' results were presented to each investigator, with the first two presentations being a standard presentation of circumpapillary retinal nerve fiber layer scans and 24-2 perimetry results (Fig. 2). The third presentation added en face imaging in three different formats. The first en face presentation was a stack of images in various depths of the retinal nerve fiber layer normalized to compensate from shadows from vitreal floaters or low-quality B-scans as reported by Ashimatey et al.14 and allowed the investigator to scroll through the retinal nerve fiber layer from the inner limiting membrane down to 72 μm (Fig. 3). The second en face image was a custom segmentation of the retinal nerve fiber layer in which for each B-scan, the value calculated was the sum of attenuation coefficients providing a combination of thickness and reflectance in a single map (Fig. 4). The third presentation was a custom normalized en face reflectance probability map based on a previously collected normative database14 (Fig. 5) in which 20 pixel by 20 pixel boxes were marked when the reflectance was lower than the fifth (light gray) or first (dark gray) percentiles. The order of the participants was randomized before presentation to the masked investigators using an online random integer generator (random.org).
FIGURE 3.
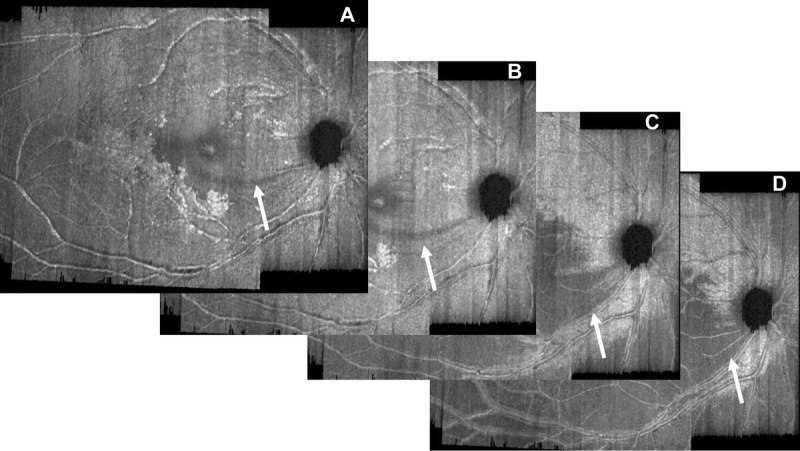
A selection of images to illustrate scrolling through the retinal nerve fiber layer: at 8 μm (A), at 16 μm (B), at 36 μm (C), and at 54 μm (D). An arcuate defect inferior-temporal is seen (white arrow) in panel A and continues to develop through to panel D.
FIGURE 4.
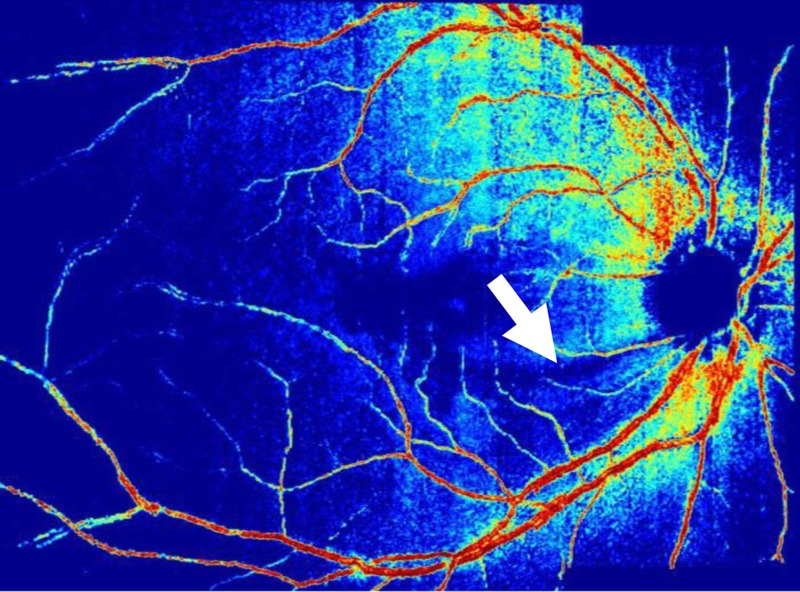
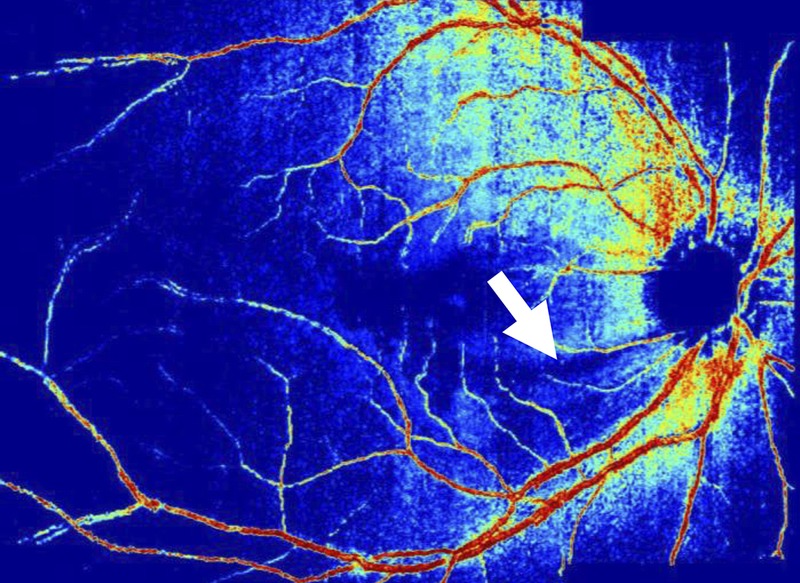
A custom segmentation map for the same participant in Fig. 3. Note the wedge defect off the inferior temporal rim (white arrow).
FIGURE 5.
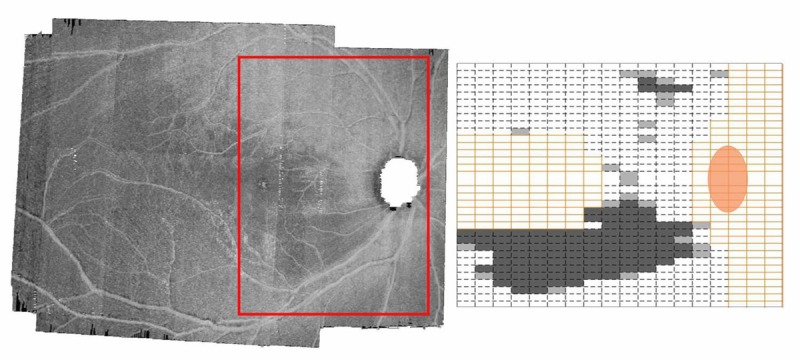
En face image with adjacent probability map for the same participant as in Figs. 3 and 4. The red box in panel A represents the area used for the probability map in panel B. The yellow boxes are excluded from analysis. The light gray boxes represent reflectance below the fifth percentile, and the dark gray boxes are below the first percentile.
The masked investigators were asked to assess whether glaucoma was likely present in one eye of 30 glaucoma suspects using a 5-point Likert scale (strongly disagree, disagree, neutral, agree, strongly agree) and a recommended management plan (start treatment, return in 3 months, return in 6 months, recommended yearly optical coherence tomography and 24-2, discharge as the patient is deemed to be low risk) for the first two presentations. After the third presentation, the initial two questions were asked along with a third question on whether the en face image was helpful for each of the three formats and graded with a 5-point Likert scale (strongly disagree, disagree, neutral, agree, strongly agree). Intraclass correlation coefficients were computed for both the second standard and third presentations for each question.
Statistical Analysis
An intraclass correlation coefficient was generated using SPSS (IBM Corporation, Armonk, NY) comparing agreement in both the assessment and the plan for the 30 subjects in the standard presentation (visual field and circumpapillary retinal nerve fiber layer). Additional intraclass correlation coefficients were generated for the assessment and plan for the presentation with new en face images (scroll through retinal nerve fiber layer, custom segmentation, and reflectance probability map) added to the standard presentation for assessment and plan, totaling eight intraclass correlation coefficients.
Data Sharing
In compliance with National Institutes of Health and Indiana University policies and to protect the confidentiality of our human subject data and protected health information, the Indiana University School of Optometry shares research data in the form of a limited data set pursuant to an approved data use agreement. Data and computer code used in this project will be shared with any research team whose institution executes an approved data use agreement with Indiana University.
RESULTS
Thirty glaucoma suspects were enrolled, 13 of whom were male and 17 were female, with ages from 27 to 81 years and a median age of 64 years. Self-reported race revealed 16 reporting African descent; 11, white; 2, Asian; and 1, multiple races, with 1 participant reporting as Hispanic ethnicity. The mean 24-2 mean deviation for all subjects was −1.17 dB, and the mean pattern standard deviation was 2.05 dB, with standard deviations of 2.08 and 1.40 dB, respectively. The minimal and maximal mean deviation values were −7.92 and +0.96 dB, and the minimal and maximal pattern standard deviation values were 1.24 and 8.84 dB.
Interrater Agreement
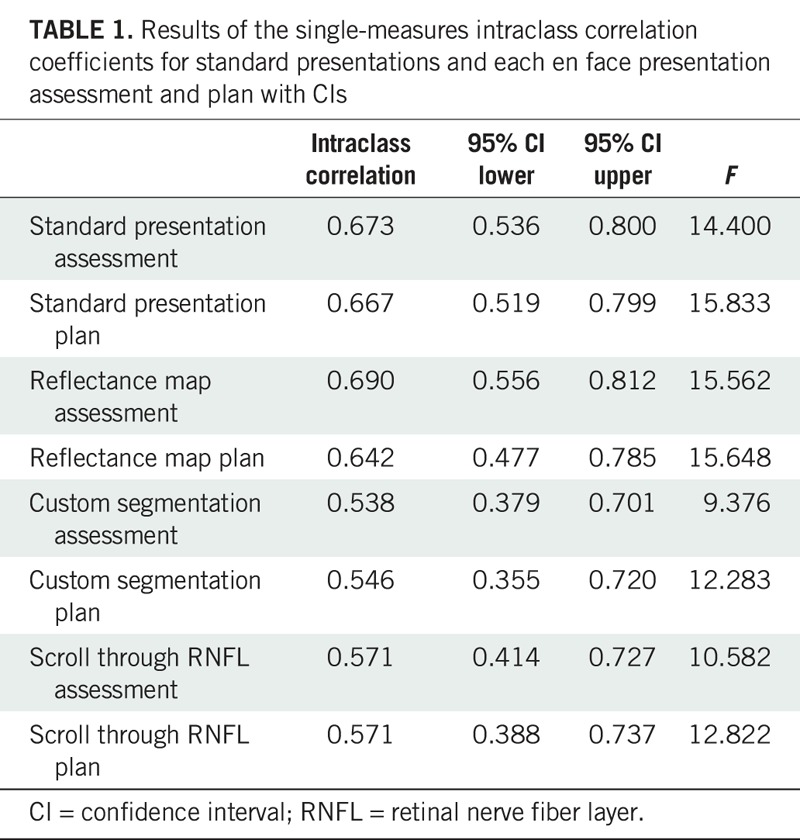
The level of agreement was moderate among the six masked investigators for the standard presentation in regard to assessment (single measures, 0.67; average measures, 0.92; F = 14.40, P < .001) and plan (single measures, 0.67; average measures, 0.92, F = 15.83, P < .001). The level of agreement remained moderate with the addition of en face images. For the en face reflectance addition, the level of agreement was slightly improved for assessment (single measures, 0.69; average measures, 0.93; F = 15.56, P < .001) as displayed in Table 1.
TABLE 1.
Results of the single-measures intraclass correlation coefficients for standard presentations and each en face presentation assessment and plan with CIs
Effect on Clinical Decision Making En Face Reflectance (Assessment)
Investigating the effect on clinical decision making, we looked at change from the second standard presentation for each investigator to the third presentation with en face reflectance (180 total presentations = 6 investigators × 30 subjects) using the first standard presentation as a learning presentation. Overall, for the second standard presentation, when asked on whether the participant illustrates glaucomatous optic neuropathy, “agree” or “strongly agree” was selected 29% of the time. When given the third presentation with en face reflectance, masked investigators changed their ranking 59% of the time (46% toward likely to have glaucoma and 13% toward unlikely to have glaucoma). Furthermore, 10 of the presentations had a greater than three-step change (all toward glaucoma, i.e., from originally choosing strongly disagree to agree), as shown in the upper panel of Fig. 6. Comparing the first standard presentation with the second standard presentation, the investigators changed their decision 39% of the time: 15% toward likely to have glaucoma and 24% toward unlikely to have glaucoma. Only 2 of the 180 presentations had a three-step or greater change in decision, and both were toward glaucoma.
FIGURE 6.
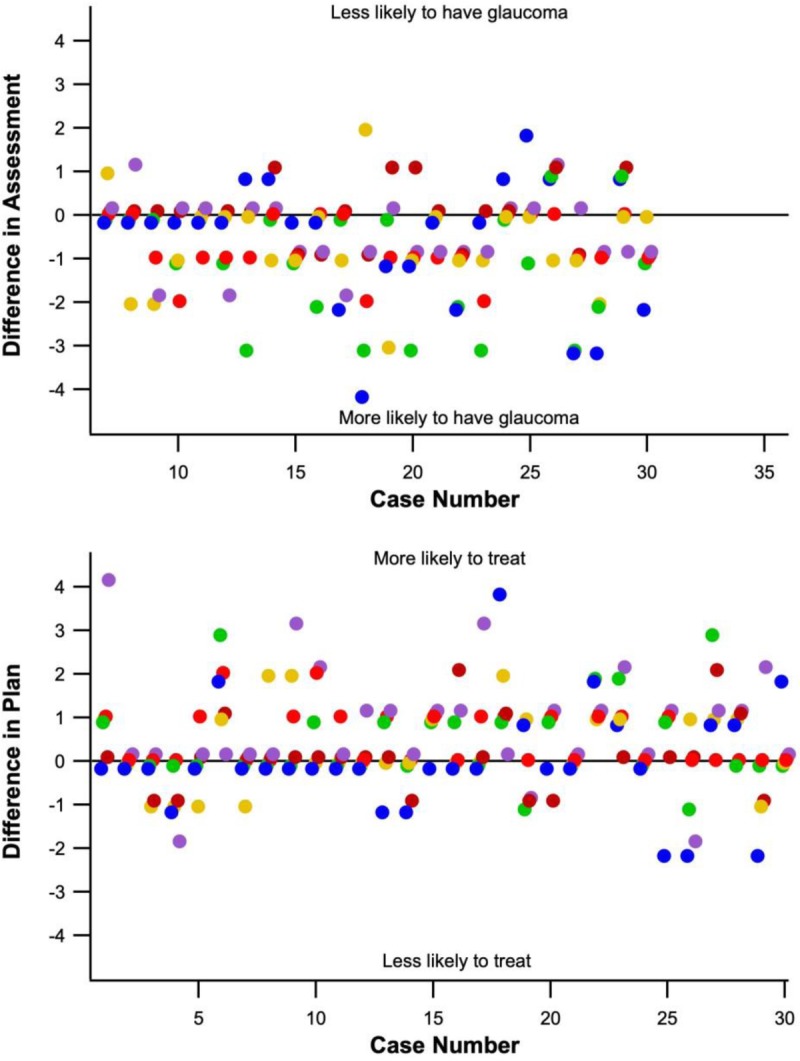
The top panel illustrates changes made to assessments after reviewing the reflectance probability map. Individual masked investigators are represented by separate colors. The top panel shows a tendency to change assessment toward likely to have glaucoma, with 10 changes of three steps or more all toward likely to have glaucoma. The bottom panel illustrates changes made in the plan after observing the reflectance probability map. Note the tendency toward treatment.
Effect on Clinical Decision Making Custom Segmentation and Scroll-through (Assessment)
The custom segmentation presentation had a similar trend to that of the en face reflectance map. Masked investigators changed decisions in assessment 56% of the time, with 39% toward glaucoma, whereas the scroll-through en face image had less effect in decision making but followed the same trend with 44% change in assessment, with 26% toward glaucoma. In addition, the custom segmentation maps had 8 of the 180 presentations having a three-step or greater change, 7 of which were toward glaucoma. The scroll-through presentation had only 3 of the 180 presentations illustrating a three-step or greater change, 2 of which were toward glaucoma.
Effect on Clinical Decision Making (Plan)
In comparing changes in decision making between the second standard presentation and the reflectance map for the plan, the decision to start treatment went from 30 to 60 of the 180 presentations, whereas the decision to dismiss went from 32 to 29. A similar trend was found for the custom segmentation presentation changing from 30 to 52, whereas the scroll-through presentation seemed to have the least effect going from 30 to 42 decisions to start treatment. As shown in the lower panel of Fig. 6, six of the presentations had a greater than three-step change, all toward starting treatment. Comparing the first standard presentation with the second standard presentation showed no change in the decision to recommend starting treatment, with the first presentation having 31 decisions and the second standard presentation having 30, as previously discussed.
Effect on Confidence of Decision
We also investigated whether the en face images increased or decreased the investigators' confidence in assessment. In this regard, it seems to change opinion both for and against, with 29 alterations toward increased confidence defined by changing decision from agree or disagree to strongly agree or strongly disagree, respectively. Moving from a decision to neutral opinion was regarded as decreased confidence, which occurred 23 times for the reflectance images. This was similarly seen in the custom segmentation and scroll-through responses. Investigating a change in decision from neutral to a decision (either agree or disagree), this occurred 34 times for both the reflectance probability map and custom segmentation and 30 times for the scroll-through presentation.
The investigators reported a positive response on the helpfulness of the en face images, with a median score of 4 (agree).
DISCUSSION
The addition of en face images in this study seemed to moderately influence clinical decision making in the direction toward selecting “agree” on whether the subject had glaucomatous optic neuropathy and to start treatment. The custom segmentation and more so the reflectance probability maps seemed to influence decisions. This indicates that clinicians may be more responsive to data from imaging when there is a probability or a value provided versus strictly visualizing potential defects as in the scroll-through scan. By comparison, there was minimal change in decisions comparing the first standard setting with the second standard setting.
The reflectance probability map seemed to double the number of times when investigators recommended starting treatment. Although this is potentially an advantage in regard to early diagnosis and initiation of treatment, it may also indicate starting treatment in patients who may not require it. As with retinal nerve fiber layer thickness maps, reflectance probability maps can also have false positives and artifacts. The investigators did have to go through a training module on the en face presentations, but their experience with these images was not the same as with traditional presentations, and therefore, they may not be as astute in deciding between false positives, artifacts, and true defects.
Agreement among investigators was moderate for both the standard presentation and with the addition of en face images. En face images seem to influence clinical decision making for most presentations and may be helpful as complementary to standard retinal nerve fiber layer presentations. Investigators seemed to change their decisions toward agreeing that the participant had glaucomatous optic neuropathy and were more willing to start treatment after reviewing the reflectance and custom segmentation maps compared with the standard presentations. In addition, they agreed that en face reflectance was helpful in their decision making, although in certain instances, it seemed to just as often increase confidence as it did to decrease confidence. Hood et al.12 suggested that en face images may allow for easier detection of retinal nerve fiber layer defects, and this study suggests that clinical decision making may be influenced by them.
Clinical decision making in glaucoma management is a complex process in which one has to obtain multiple data points for both structure and function to reach a conclusion. This process is often different among clinicians and can heavily depend on clinical experience. Advanced cases can be more straightforward, but patients early in the disease process present a more difficult challenge. In certain cases, the data seem inconclusive, and more data from the patient are required in order for decisions to be made. Furthermore, conflicting information or a patient unable to reliably perform perimetry can complicate decision making. This presents an opportunity to investigate other ways to view or analyze the data collected, one of which is to review en face images of the retinal nerve fiber layer as a complementary approach, especially in early disease.
As an example from this study (Fig. 7), the optical coherence tomography seems concerning, with the superior-temporal sector showing a thickness of 85 μm compared with the 133 μm of the inferior-temporal sector. The 24-2 states that the glaucoma hemifield test is within normal limits. One could argue the total deviation hints at an inferior-temporal arcuate defect, but this disappears when looking at the pattern deviation. The en face images clearly demonstrate a superior wedge defect of the retinal nerve fiber layer. In this case, most investigators believed that the participant had glaucomatous optic neuropathy with one strongly agreeing, yet only one recommended to start treatment in the initial presentation. After reviewing the en face images, all investigators recommended treatment.
FIGURE 7.
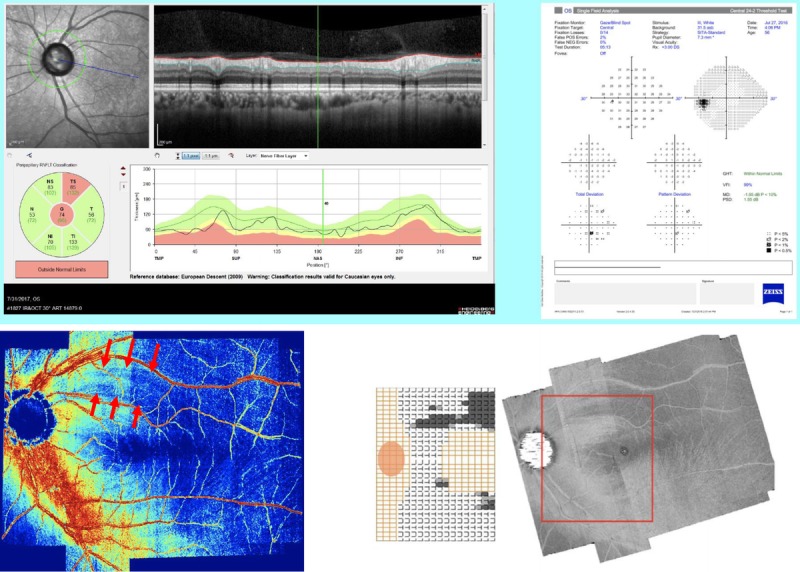
The top panel presents the standard presentation for case 15 with the superior-temporal sector marked, and the total deviation on the 24-2 suggests a corresponding arcuate defect that does not present in the pattern deviation. The middle panel illustrates a superior temporal defect in the custom segmentation (red arrows), and the bottom panel is the reflectance probability map also illustrating a superior wedge defect in the retinal nerve fiber layer.
There are limitations in this study. First, the subjects enrolled were all suspects or referred for an initial glaucoma evaluation, and therefore, the final diagnosis of the subjects was unknown at the time of the study. This prevents analysis on sensitivity and specificity for this study. Second, although this study tried to mimic data from a real-world setting, it was a study that required high-quality data. Therefore, the impact seen in the clinic with suboptimal imaging and low-quality fields cannot be assessed. Lastly, the masked examiners, although having gone through a training module, had limited experience with the new en face images.
This pilot study investigated three different techniques of en face imaging in glaucoma diagnosis and management to assess the potential impact to clinical decision making. The results show an effect toward diagnosing glaucoma and starting treatment. This justifies the need for further investigations to assess sensitivity and specificity of these approaches while also developing a larger and more diverse normative data set.
Footnotes
Submitted: June 17, 2019
Accepted: October 17, 2019
Funding/Support: National Institutes of Health (R01EY024542; to WHS) and Foundation for the National Institutes of Health (R01EY02813542; to WHS).
Conflict of Interest Disclosure: The authors listed report a financial conflict of interest. MC reports contract research funding from Heidelberg Engineering. WHS reports a consulting arrangement with Heidelberg Instruments.
Author Contributions and Acknowledgments: Conceptualization: BJK; Data Curation: BJK, WHS, CAC, AMS; Formal Analysis: BJK, WHS; Funding Acquisition: WHS, SAK; Investigation: BJK, MC, BAT, CAC, AMS, JAG, TDP; Methodology: BJK, WHS, SAK, MC; Project Administration: BJK, SAK, MC, BAT, CAC, AMS, JAG, TDP; Resources: WHS; Software: WHS; Supervision: BJK, WHS; Visualization: BJK; Writing – Original Draft: BJK; Writing – Review & Editing: WHS, SAK, MC, BAT, CAC, AMS, JAG, TDP.
The authors would like to acknowledge and thank Brittany Walker and Rebecca Tudor for their work in testing patients and gathering the optical coherence tomography images.
REFERENCES
- 1.Hood DC, Kardon RH. A Framework for Comparing Structural and Functional Measures of Glaucomatous Damage. Prog Retin Eye Res 2007;26:688–710. [DOI] [PMC free article] [PubMed] [Google Scholar]
- 2.Ashimatey BS, Swanson WH. Between-subject Variability in Healthy Eyes as a Primary Source of Structural-functional Discordance in Patients with Glaucoma. Invest Ophthalmol Vis Sci 2016;57:502–7. [DOI] [PMC free article] [PubMed] [Google Scholar]
- 3.Spaeth GL, Henderer J, Liu C, et al. The Disc Damage Likelihood Scale: Reproducibility of a New Method of Estimating the Amount of Optic Nerve Damage Caused by Glaucoma. Trans Am Ophthalmol Soc 2002;100:181–5. [PMC free article] [PubMed] [Google Scholar]
- 4.Wang F, Quigley HA, Tielsch JM. Screening for Glaucoma in a Medical Clinic with Photographs of the Nerve Fiber Layer. Arch Ophthalmol 1994;112:796–800. [DOI] [PubMed] [Google Scholar]
- 5.Schuman JS, Hee MR, Puliafito CA, et al. Quantification of Nerve Fiber Layer Thickness in Normal and Glaucomatous Eyes Using Optical Coherence Tomography. Arch Ophthalmol 1995;113:586–96. [DOI] [PubMed] [Google Scholar]
- 6.Pieroth L, Schuman JS, Hertzmark E, et al. Evaluation of Focal Defects of the Nerve Fiber Layer Using Optical Coherence Tomography. Ophthalmology 1999;106:570–9. [DOI] [PMC free article] [PubMed] [Google Scholar]
- 7.Swanson WH, King BJ. Comparison of Defect Depths for Sinusoidal and Circular Perimetric Stimuli in Patients with Glaucoma. Ophthalmic Physiol Opt 2019;39:26–36. [DOI] [PMC free article] [PubMed] [Google Scholar]
- 8.Swanson WH, King BJ, Horner DG. Using Small Samples to Evaluate Normative Reference Ranges for Retinal Imaging Measures. Optom Vis Sci 2019;96:146–55. [DOI] [PMC free article] [PubMed] [Google Scholar]
- 9.Strouthidis NG, Scott A, Peter NM, et al. Optic Disc and Visual Field Progression in Ocular Hypertensive Subjects: Detection Rates, Specificity, and Agreement. Invest Ophthalmol Vis Sci 2006;47:2904–10. [DOI] [PubMed] [Google Scholar]
- 10.Artes PH, Chauhan BC. Longitudinal Changes in the Visual Field and Optic Disc in Glaucoma. Prog Retin Eye Res 2005;24:333–54. [DOI] [PubMed] [Google Scholar]
- 11.Pons ME, Ishikawa H, Gurses-Ozden R, et al. Assessment of Retinal Nerve Fiber Layer Internal Reflectivity in Eyes with and without Glaucoma Using Optical Coherence Tomography. Arch Ophthalmol 2000;118:1044–7. [DOI] [PubMed] [Google Scholar]
- 12.Hood DC, Fortune B, Mavrommatis MA, et al. Details of Glaucomatous Damage Are Better Seen on OCT En Face Images Than on OCT Retinal Nerve Fiber Layer Thickness Maps. Invest Ophthalmol Vis Sci 2015;56:6208–16. [DOI] [PMC free article] [PubMed] [Google Scholar]
- 13.Ashimatey BS, King BJ, Malinovsky VE, et al. Novel Technique for Quantifying Retinal Nerve Fiber Bundle Abnormality in the Temporal Raphe. Optom Vis Sci 2018;95:309–17. [DOI] [PMC free article] [PubMed] [Google Scholar]
- 14.Ashimatey BS, King BJ, Burns SA, et al. Evaluating Glaucomatous Abnormality in Peripapillary Optical Coherence Tomography Enface Visualisation of the Retinal Nerve Fibre Layer Reflectance. Ophthalmic Physiol Opt 2018;38:376–88. [DOI] [PMC free article] [PubMed] [Google Scholar]


