Abstract
Significance.
The findings of this study indicate that patients could simultaneously be offered the individualized optical correction of wavefront-guided (WFG) lenses and the superior comfort afforded by polymer coatings. This could be helpful to patients with ectasia suffering ocular dryness or dependent on scleral lenses for lengthy periods of wear.
Purpose.
Wavefront-guided scleral lenses target lower- and higher-order aberrations of individual eyes using sub-micron-level contours in the anterior lens surface. Hydrophilic polyethylene glycol polymer coatings applied to lens surfaces improve comfort and wettability. This study aimed to quantify aberration changes (e.g. masking) when applying polymer coatings to WFG and conventional scleral lenses.
Methods.
Two control lenses (remained uncoated) and fourteen experimental lenses (two repeated builds of seven aberration designs: one spherical, two coma, four full-WFG (2nd to 5th order aberrations)) were manufactured and aberrations measured (mean of three) by two operators before and after coating. Root mean square (RMS) and visual image quality (logVSX) differences were calculated for 6mm diameters.
Results.
Median RMS aberration change due to coating was 0.012μm; range 0.008–0.057μm. Maximum logVSX change due to coating was 0.073, predicting a ~1 letter change in acuity. Instrument sensitivity was 0.002μm. Acute instrument and operator variabilities (standard deviations of individual (2nd to 5th order Zernikes) were all <0.027μm. Longitudinal variability (control lenses) was low: all <0.017μm. Although RMS of differences between repeated builds of all lenses were <0.25D and not statistically significant, relatively, manufacture constituted the major variability and RMS difference between repeated builds was at least 4x greater than effect of coating: median 0.167μm; range 0.088–0.312μm.
Conclusions.
Application of polymer coatings caused measureable changes in aberrations of WFG and conventional scleral lenses, however these were clinically and statistically insignificant and within variability of repeated lens manufacture. In their current states, WFG lenses and polymer coatings could be used simultaneously.
Individualized wavefront-guided contact lenses are a modern technology epitomizing the evolution of healthcare towards personalized medical treatments by tailoring the correction of both higher- and lower-order aberrations to individual eyes. Wavefront-guided contact lenses were initially manufactured and demonstrated with varying levels of efficacy in laboratory environments.1–10 Recently, they have been translated into the daily lives of a sample of 20 eyes with corneal ectasias11 and have also been fit outside research environments by private practitioners that possess wavefront sensors and a means to accurately quantify on-eye lens position. Manufacture of these lenses is described in detail elsewhere as well as briefly in the Methods section; in summary, a successful delivery method8,10,11 has been to incorporate wavefront-guided prescriptions into the design of the anterior surfaces of conventional scleral lenses. Conventional scleral lenses mask a substantial amount of anterior cornea irregularity and have become a standard of care for ectasia.
Another emerging technology is that of hydrophilic polyethylene glycol (PEG) polymer coatings, designed to improve surface wettability – and thereby improve the comfort – of rigid contact lenses.(Sindt, IOVS 2016;57:ARVO E-Abstract 1462; Walker and Redfern, TFOSS 2016).
Both wavefront-guided lenses and comfort coatings have been studied independently at the University of Houston, but never combined. Prior to this study, subjects that participated in both fields of research had needed to choose between the superior optical correction provided by wavefront-guided lenses and the superior comfort they report with polymer coatings. This choice is particularly difficult for patients whose ectasia is concurrent with ocular surface disease, dryness, and / or eye lid abnormalities that compromise lens wetting and increase tear film debris and lens deposits.
Wavefront-guided lenses are designed based on measured wavefront error expressed in terms of Zernike aberrations.12 Given that wavefront-guided prescriptions currently target higher order aberrations up to the fifth Zernike radial order2,3,13,14 and consist of fine – often sub-micron level – contours in the anterior lens surface, this study investigated whether the application of a coating would significantly alter or mask those fine contours upon which the efficacy of wavefront-guided prescriptions depend.
While coatings might also impact other optical lens properties, such as scatter,15 this study focusses on those characteristics measureable with aberrometry. The ability to measure aberrations (instrument and operator variabilities) as well as the precision and accuracy of lens manufacture were also investigated to meaningfully context the changes due to coating.
METHODS
Wavefront error data from a previous study11 were analyzed. Prior to collection of those data, University of Houston Institutional Review Board-approved informed consent was signed by every subject.
Lenses were designed and manufactured at the Visual Optics Institute at the University of Houston, College of Optometry, in Roflufocon D material (Contamac Optimum Extra, (www.contamac.com), using a DAC 2X-ALM OTT ophthalmic lens lathe (DAC International, www.dac-intl.com). Lenses were coated with Tangible Hydra-PEG coating (www.tangiblescience.com).
Lens Designs
Lens designs were based on the mean parameters of the 20 wavefront-guided lenses dispensed to eyes with corneal ectasia in a previous study.11 Macro parameters were constant across all lenses: 17 mm overall diameter, aspheric front surface, six-curve back surface with a 10 mm diameter optic zone, base curve 7.2 mm, and (base) spherical power −5 D.
While on an eye, the geometric center of a scleral lens does not typically coincide with the center of the pupil, therefore, wavefront-guided prescriptions are typically offset from the geometric lens center to be positioned over the pupil when worn. In this study, one third of prescriptions were centered on the geometric center of the lens, while the majority were offset in horizontal and vertical directions by 0.4803 and 0.4900 mm respectively. This offset can be appreciated in Figure 1 where, if the lens was worn on a right eye, the displacement of the wavefront-guided prescription would be superior and nasal relative to the geometric lens center (to compensate for a lens resting inferior and temporal relative to the pupil center). Again, these offset values were obtained from a previous study11 as the mean displacement of the geometric lens center from the pupil center in 20 eyes with corneal ectasia. No manufactured lenses were excluded; all lenses were measured as made.
Figure 1.
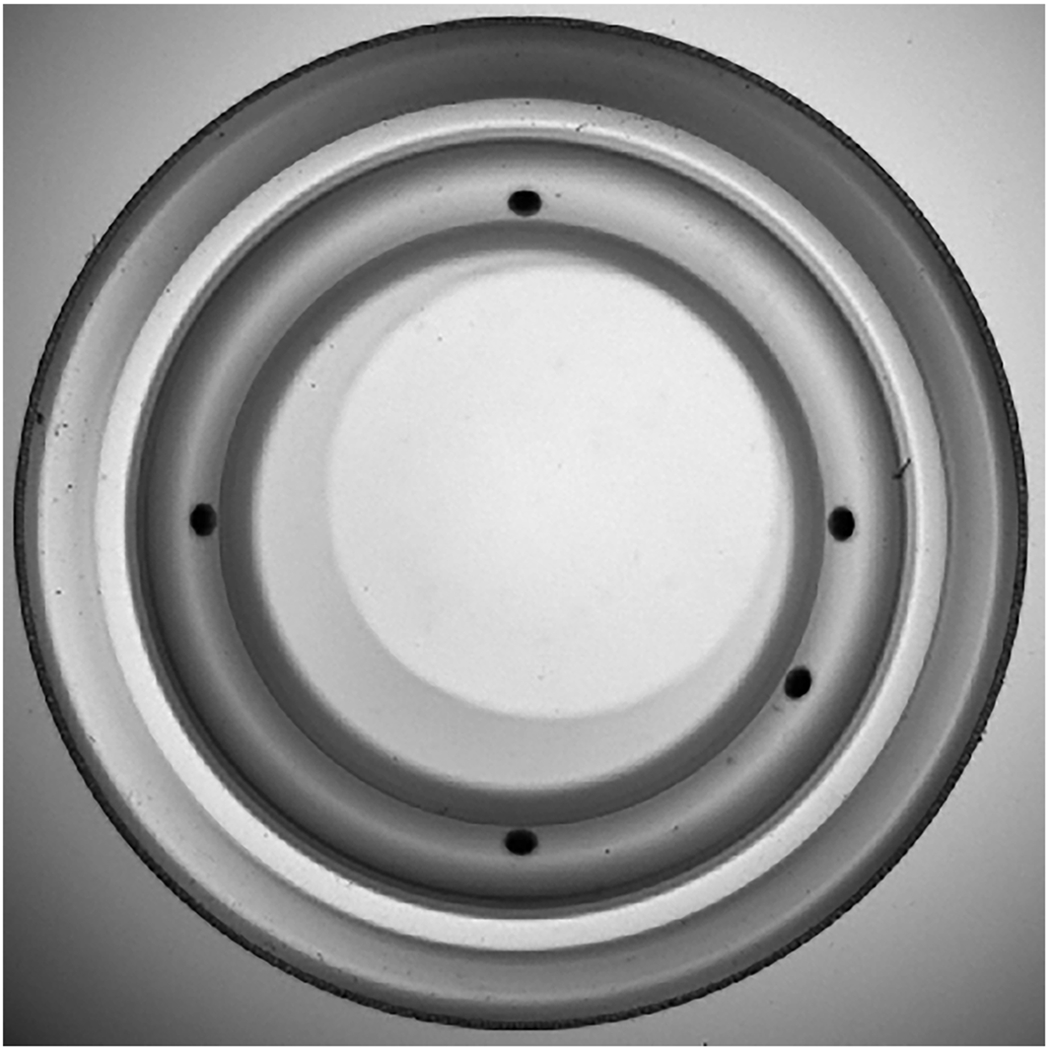
A wavefront-guided scleral lens as viewed by the SHSOphthalmic Optocraft profiler. The lens circumference and the five engravings were detected by the instrument to ensure alignment accuracy of each lens within 0.1 mm (translation) and 0.2 degrees (rotation). Note the wavefront-guided prescription (the lighter circle) is offset (up and to the right) from the geometric lens center.
Experimental Lenses
Fourteen experimental lenses, consisting of two repeated builds of seven aberration designs, were measured after manufacture and again after coating. One design was spherical (−5 D), containing no additional wavefront-guided prescription; the sphere was centered. In two designs, 0.153 μm (over 6 mm) of pure coma (the median magnitude of Zernike C7 for 20 wavefront-guided lenses11) was added to the −5 D sphere; one coma design was centered and one was offset. Four designs added full wavefront-guided prescriptions (all aberrations from 2nd to 5th Zernike radial orders) of four highly (and uniquely) aberrated eyes11 to the −5 D sphere. Designed aberration structures are shown in Figure 2.
Figure 2.
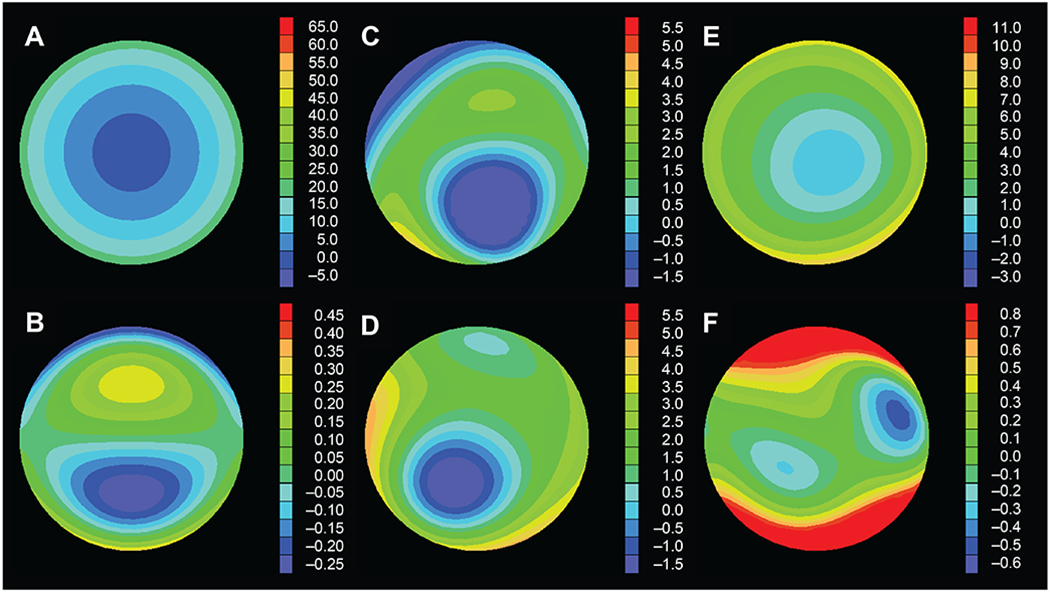
The designed aberration structures (6mm diameter) of the experimental lenses were selected from a sample of eyes with ectasia11 to span a range of aberration structures that differed in magnitude and composition (hence, the necessity of different scales here). Designs are (A) spherical, (B) pure coma, (C–F) full wavefront-guided (aberrations from 2nd to 5th Zernike radial orders).
Control Lenses
Two uncoated lenses served as controls (remained uncoated) to monitor instrument and operator variability over the course of the experiment: (1) a centered spherical (cross-sectional control) lens was profiled twice, once at the beginning of the experiment and once at the conclusion, without otherwise being handled during that time, and (2) an offset wavefront-guided (longitudinal control) lens, with aberrations up to the 5th Zernike radial order, was the first lens profiled any time measurements were made.
Protocol for Measuring Lens Aberrations
Aberration profiles of lenses were independently measured by two trained operators using a SHS Ophthalmic Optocraft profiler (www.optocraft.de). This is a single-pass Shack-Hartmann-based device operating at 546 nm with a 60 × 60 array of microlenslets spaced at 0.15 mm. Output from the Optocraft was wavefront error fit with a 10th radial order normalized Zernike polynomial expansion. Absolute instrument sensitivity was investigated, as done previously for Shack-Hartmann contact lens profilers,13,16 by taking repeated measures with an empty optical path (no lens).
Prior to lens measurement, each lens and the glass slide that supported the lens during measurement were cleaned and the aberrations inherent in the optical path of the instrument and slide were measured and set as the effective zero-point. Circumference of the lenses and five engraved lens markings (clinically used to monitor on-eye translation and rotation) (Figure 1) were detected by the Optocraft and used to align each lens to within 0.1 mm (translation) and 0.2 degrees (rotation) accuracies.
The changes in aberrations were evaluated in terms of individual (Zernike) and total (root mean square; RMS) aberrations, as well as the visual image quality metric logVSX (the base 10 logarithm of the visual Strehl ratio17).
Root mean square is a metric that quantifies the total amount of aberration (in a standard deviation sense) present over the pupil. Differences in aberrations between two conditions (e.g. coated and uncoated, within or between operators, two repeated lens builds) are considered in terms of the RMS of the difference. Here the difference between the two aberration structures was taken for each Zernike aberration term, then the (2nd through 5th order) RMS of those differences was calculated. While in some literature, lower order terms have been omitted and only higher-order RMS reported, here we emphasize total RMS (including lower order terms because they contribute to the total variability) and merely include higher-order RMS for comparison with literature.
While RMS is a familiar and useful metric to describe the magnitude of aberrations, to better predict potential visual impact of a change in aberrations, the difference in the visual image quality metric logVSX17 due to coating was calculated. LogVSX has been shown well correlated with change in visual acuity,18–20 predictive of subjective best focus,17,21 and able to objectively identify a spectacle prescription that performs equivalently to subjective refraction.22 Here, the measured aberration structure of each uncoated lens was taken as a fiducial baseline and the change in aberrations due to coating decreased logVSX.
RESULTS
Aberration data are for 6 mm diameters, 2nd through 5th Zernike radial orders, and are the term by term mean of three measurements per operator, where the lens was removed from the Optocraft and the instrument reset (including zeroing-out of internal aberrations) between each measurement. Fourteen experimental lenses, measured before and after coating, by two operators, equated to 58 required measurements – these were consolidated for convenience and performed in a total of 17 sessions.
The differences found in the conventional (spherical), pure coma (both centered and offset), and wavefront-guided lenses were comparable, so results are not segregated, that is, maximum, median, and minimum values refer to across all relevant lens designs. Figure 3 presents a summary of all categories of the results that are described in the sections below.
Figure 3.
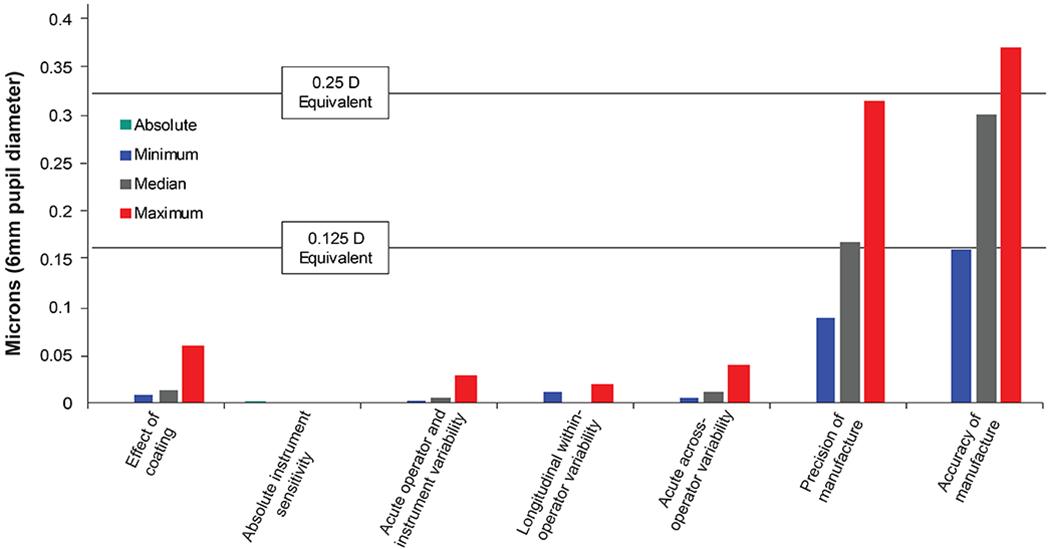
Summary of outcomes across all lenses. The Absolute instrument sensitivity category did not involve any lenses; the Effect of coating category comprised data from the 14 experimental lenses only; the Longitudinal within-operator variability category comprised data from the two control lenses only; other categories included all experimental and control lenses.
Effect of Coating
Median total RMS of the difference between uncoated and coated measurements across all lenses was 0.012 μm (range 0.008 – 0.057), which equated to less than 1% of total RMS. Median higher-order RMS difference was 0.008 μm (range 0.003 – 0.038). No systematic change (such as a signed increase or decrease in magnitude across all terms) in aberration structure was found due to coating and there were no significant correlations (all R2 = ~0.2) between aberration magnitudes and changes due to coating. Using logVSX, the maximum change in aberrations due to coating was 0.073 and was always predicted23,24 to be visually insignificant – approximately (or less than) one letter of logMAR visual acuity.
Absolute Sensitivity of Instrument
The absolute sensitivity of the Optocraft in terms of total RMS wavefront error, determined from 10 repeated measures with an empty optical path, was 0.002 μm (higher-order RMS wavefront error 0.001 μm).
Acute and Longitudinal Operator and Instrument Variability
Acute within-operator variability was taken as the term by term standard deviation of the three repeated measurements of any lens with replacement and realignment. Median standard deviation across all Zernike terms, across all lenses, and both operators was 0.005 μm (range: 0.001 – 0.027 μm). All standard deviations were less than 1% of total RMS.
Longitudinal within-operator variability was assessed using the cross-sectional control lens and taken as the difference in mean (of three measurements) total RMS between the measurements at the beginning and end of the study. These values were 0.017 and 0.010 μm for the two operators, which were not statistically significant (all P>.15); across all lenses and both operators, all differences were less than 1% of total RMS.
Acute across-operator variability across all lenses was taken as the difference in total RMS between the means of the two operators for each lens under each respective (both uncoated and coated) condition. Median total RMS of the differences between operators was 0.010 μm (range 0.004 – 0.038 μm). All differences were not statistically different (all P>.07) and all were less than 1% of total RMS.
The low levels of acute and longitudinal within- and across-operator variabilities are illustrated for the longitudinal control lens in Figure 4. Given these low variabilities and statistically insignificant differences across-operators, measurements from both operators were pooled when examining lens manufacture and coating.
Figure 4.
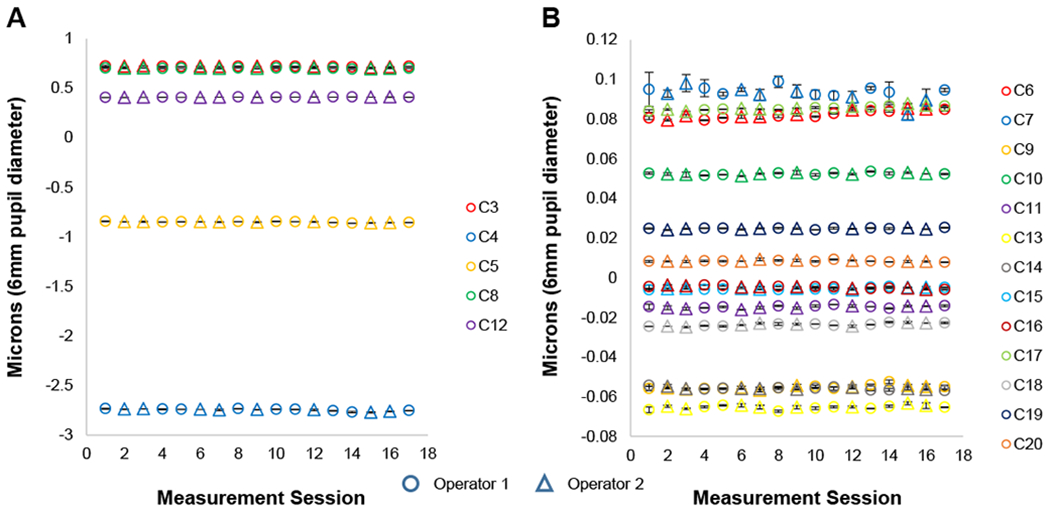
Zernike aberration coefficients (2nd through 5th radial orders, indicated by C3 through C20) of magnitude (A) greater than 0.1μm and (B) less than 0.1μm for a wavefront-guided lens which remained uncoated and served as a longitudinal control lens over the course of the entire study. Data points are the mean of three repeated measures with replacement and realignment of lenses. Error bars are one standard deviation and indicate short-term within-operator variability. The two operators are indicated by different symbols and indicate longitudinal within-operator variability as well as across-operator variability.
Precision and Accuracy of Manufacture
Precision of manufacture was evaluated as the total RMS of the difference between the two repeated builds of a lens design. Across all lenses, no differences were statistically significant (all P>0.10). Median total RMS of the difference was 0.167 μm (range: 0.088 – 0.312) and 4% of total RMS.
Accuracy of manufacture was evaluated as the total RMS of the difference between each wavefront-guided lens build and its design. Median total RMS of the differences was 0.301 μm (range 0.160 – 0.368) and 19% of total RMS. The most variable (worst) lens in terms of precision and accuracy of manufacture is shown in Figures 5 and 6, where the differences in precision and accuracy of manufacture can be compared with the relatively miniscule differences in aberrations caused by coating.
Figure 5.
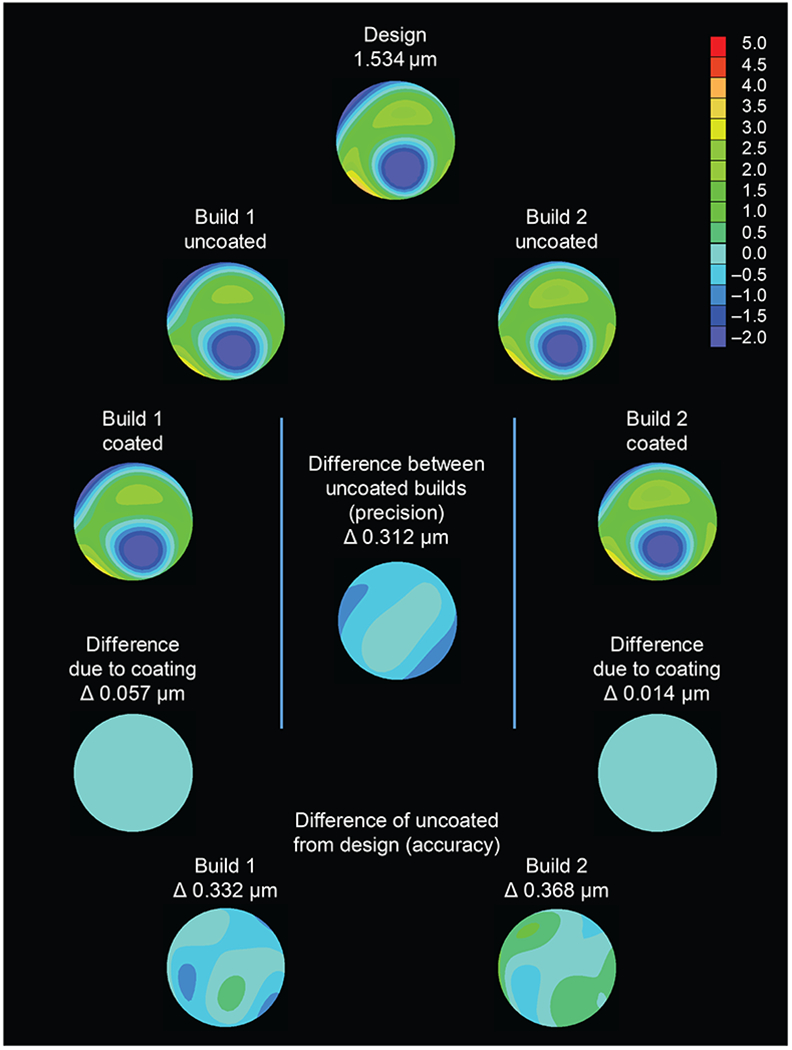
Summary of experimental design and results of the most variable (worst-case) wavefront-guided lens (aberrations designed 2nd through 5th Zernike radial orders). Two repeated builds of the lens design were manufactured, and aberrations were measured by two operators before and after coating. Wavefront error maps, designed RMS, and difference (Δ) in RMS values are for a 6mm diameter.
Figure 6.
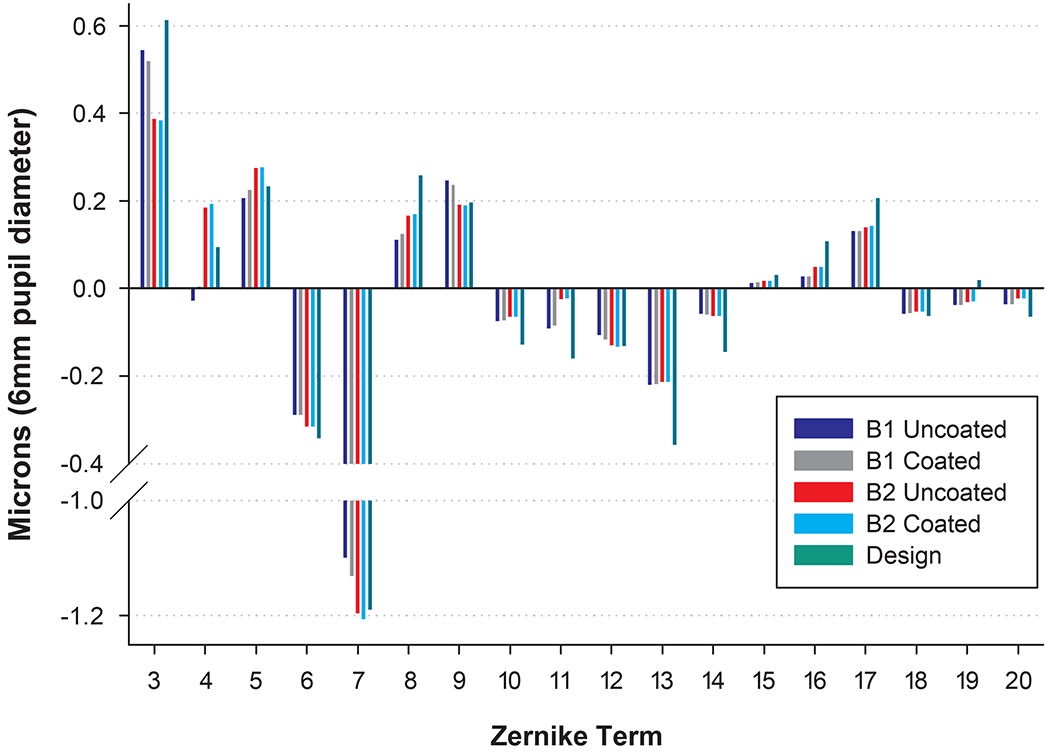
Quantitative illustration of the aberrations of the design and two repeated builds (B1 and B2) of the most variable (worst-case) lens before and after coating.
DISCUSSION
This study sought to quantify any change in aberration structure of conventional and wavefront-guided scleral lenses caused by the application of a polymer coating, and to consider these changes in the context of the variability of aberration measurement and repeated lens manufacture.
Effect of Coating
Relative to the variability of measurement and manufacture, the changes in aberrations due to coating were inconsequential and not systematic. Masking of the sub-micron-level wavefront-guided contours in the anterior lens surface by coating might have been expected to decrease the magnitude of aberration terms, however, this was not the case. Similarly, one might have expected larger aberrations to be less affected than smaller aberrations (which depend on more subtle undulations in the lens surface), however, this was also not observed. These findings suggest the deposition of the polymer coating to be sufficiently variable so as to have a relatively random – albeit miniscule – effect on the optical aberrations of the underlying lenses.
These small aberration changes were predicted23,24 to have an insignificant impact on vision by logVSX, and become even less significant when one considers potential factors such as lens movements and misalignments on eye.25–30 These dynamic attributes of lens wear typically cause much larger changes in aberrations than those due to coating and would confound any attempt to measure the change in aberrations due to coating with lenses on eyes.
Absolute Sensitivity of Instrument
The absolute sensitivity of the Optocraft was approximately 1000 times smaller than the total RMS wavefront error of all lens designs and was similar to the absolute reproducibility stated in the technical manual,31 the publication of the core Shack-Hartman technology inside the instrument,32 as well as that of other custom built13 and commercially available16 Shack-Hartman sensors for contact lens aberration profiling.
Operator and Instrument Variability
The two operators in this study were trained and practiced in the aberration profiling of scleral lenses and short- and long-term differences within and between operators were inconsequential. Training likely contributed to this repeatable agreement, however because alignment and orientation of the lens in the instrument are the primary sources of error, and the Optocraft exerted strict tolerances on these parameters, it is possible that a naïve operator might perform similarly, however, operator training was not the purpose of this study and was not tested.
Precision and Accuracy of Manufacture
The purpose of this report was not to establish tolerance benchmarks of wavefront-guided lens manufacture (neither ANSI nor ISO standards exist for wavefront-guided lenses). None of the differences between repeated lens builds were statistically significant, however, the clinical tolerance for manufacture is challenging to evaluate in a bench study because it depends on the magnitude and distribution of the intended aberration terms as well as the movement and alignment of the lens on-eye. Relatively, manufacture constituted the largest source of variability and, using literature, we sought to context it in terms of the current state of the wavefront-guided lens industry. It is worth restating that all repeated lens builds were measured as made.
The few papers2,3,8,13 that reported manufacture of wavefront-guided contact lenses (targeting the measured aberration structures of real eyes) have all only specified accuracy for a single best-case lens. We were unable to find any published report of the precision of wavefront-guided lens manufacture.
For comparison with literature, the total RMS difference (including both higher and lower orders) of our best-case lens differed from its design by 0.16 μm (6 mm; 7% of design) (higher-order RMS alone 0.13 μm); the median difference from design in this study was 0.30 μm (6 mm; 19%) (higher-order RMS alone 0.25 μm).
Jeong et al.13 and Jeong and Yoon2 each reported the higher-order RMS differences from designs of one soft wavefront-guided lens as 0.26 μm (6 mm; 21% of design) and 0.59 μm (6mm; 13%) respectively. Total and higher-order RMS differences from design for one soft wavefront-guided lens were reported by Chen et al.3 as 0.39 μm (5mm; 21%) and 0.27 μm (23%) respectively, while Sabesan et al.8 presented the higher-order RMS difference from design for one scleral wavefront-guided lens as 0.2 μm (7.5mm; 9% of design).
While manufacture was relatively the greatest source of variability in this study, accuracy of manufacture of all lenses was equivalent to, or better than, the published state of the field. This is also illustrated by the dioptric equivalents plotted in Figure 3 and emphasizes how small the changes effected by the application of coatings were on the aberration structures of all lenses.
Study Limitations
Limitations of this work include that the order of coating could not be randomized, that is, the coating could not be removed without jeopardizing the integrity of the lens surface and, therefore, uncoated lenses were always measured first. The two control lenses demonstrated excellent instrument and operator repeatability over time, deeming this lack of randomization inconsequential.
The results of this study only apply to intact coatings. Loss of coating integrity could be caused by reaction to tear components (heavy depositors), the use of incompatible cleansers or rewetting drops, vigorous rubbing during cleaning, the use of tap water, or storing the lens dry without solution. Degradation of the coating might be expected to increase scatter arising from surface imperfections, poorer wetting, and increased deposition, however, the effect on aberrations is unpredictable given the uniqueness of each wavefront-guided prescription and potential coating loss. Potential loss of coating integrity over time and any consequent effects on aberrations or vision were not investigated. Likewise, only one lens-coating combination was studied; when other coatings become available, they should be similarly tested.
While Figure 3 presented the differences in aberrations relative to the Zernike equivalents of 0.125 and 0.25 D, this is not always ideal as equivalent diopters can neglect the interaction of aberrations as well as how specific aberrations affect vision differently.33–35 While logVSX is more robust than RMS in both respects, RMS and logVSX only consider the aberrations measureable with the Shack-Hartmann wavefront profiler. Coating a lens could change other properties, such as scatter,15 which are not captured by wavefront aberrometry, or could induce aberrations that cannot be well fit with the Zernike polynomials used here.14
The effect of the coating on the visual quality of actual eyes was not studied. While most publications correlating logVSX with vision have studied normal eyes,17–22 the metric has also been applied19,24 to eyes with keratoconus or high levels of aberrations. However, in the presence of a coating, it is not known whether the metric over-predicts, under-predicts, or accurately predicts visual quality, especially when concurrent ocular surface dryness or disease is present.
Wavefront-guided lenses are designed by measuring the wavefront error of an eye wearing a best conventional scleral lens and then adding the negative of those residual aberrations to the conventional lens design. It is not possible to measure the aberrations of lenses in a situation that mimics on-eye wear, such as with air on the front surface and fluid on the back surface, because the refractive index differences result in a very high positive spherical power lens. This spherical defocus dominates all other aberrations and exceeds the dynamic range of the instrumentation used to profile other aberrations. Consequently, lenses can either be immersed (both surfaces) in fluid or can be measured with both surfaces in air. Because scleral lenses are rigid and hold their form when dry (unlike desiccated soft lenses), the lenses in this study were measured in air.
In order to isolate the wavefront-guided prescription from a measurement made in air, it is necessary to also measure the conventional scleral lens upon which the wavefront-guided lens was based, and to subtract the aberrations of that conventional lens from the measured aberrations of the wavefront-guided lens. While this calculation is conceptually and mathematically sound (as evidenced here by the reported agreement of the measured wavefront-guided lens aberrations with their designs), it unfortunately introduces the potential for noise in the data because it assumes that the back surfaces and macro properties of the front surfaces of the conventional and wavefront-guided lenses are identical. This subtraction could potentially portray the accuracy of the wavefront-guided prescription as better-or-worse than it actually is.
These limitations are, however, immaterial in the context of the question that this study sought to address, namely, could polymer coatings and current wavefront-guided scleral lenses be combined? The application of a polymer coating always caused a change in aberrations that was less than that of a repeated build of the same lens. However, this is only true of the current state of lens manufacture. If technology improves such that lens manufacture becomes more precise and yet higher orders (higher than 5th order) of aberration correction can be manufactured, the effect of coatings might need to be reconsidered. Presently, these data suggest that patients could simultaneously be offered the individualized optical correction of current wavefront-guided lenses and the superior comfort afforded by polymer coatings.
ACKNOWLEDGMENTS
The University of Houston owns patents on which JDM and RAA are listed as inventors. The authors thank Diana Tran, Drs. Matthew Kauffman, Roxana Hemmati, and Maria Walker; Sze Quan and Dr. Laura Pardon for assistance with figures; Hope Queener for lens design software; and Dr. Larry Thibos for visual image quality software. Although no financial support was provided by Tangible Sciences, they kindly coated the experimental lenses at no cost.
Funding: NIH/NEI R01EY019105; NIH/NEI R01EY008520; NIH/NEI P30EY07551.
REFERENCES
- 1.López-Gil N, Chateau N, Castejón-Monchón J, et al. Correcting Ocular Aberrations by Soft Contact Lenses. S Afr Optom 2003;62:173–7. [Google Scholar]
- 2.Jeong T, Yoon G. Customized Correction of Wavefront Aberrations in Abnormal Human Eyes by using a Phase Plate and a Customized Contact Lens. J Korean Phys Soc 2006;49:121–5. [Google Scholar]
- 3.Chen M, Sabesan R, Ahmad K, Yoon G. Correcting Anterior Corneal Aberration and Variability of Lens Movements in Keratoconic Eyes with Back-Surface Customized Soft Contact Lenses. Optics Letters 2007;32:3203–5. [DOI] [PubMed] [Google Scholar]
- 4.Marsack J, Parker K, Niu Y, et al. On-Eye Performance of Custom Wavefront-Guided Soft Contact Lenses in a Habitual Soft Lens-Wearing Keratoconic Patient. J Refract Surg 2007;23:960–4. [DOI] [PubMed] [Google Scholar]
- 5.Sabesan R, Jeong T, Carvalho L, et al. Vision Improvement by Correcting Higher-Order Aberrations with Customized Soft Contact Lenses in Keratoconic Eyes. Optics Letters 2007;32:1000–2. [DOI] [PubMed] [Google Scholar]
- 6.Marsack J, Parker K, Applegate R. Performance of Wavefront-Guided Soft Lenses in Three Keratoconus Subjects. Optom Vis Sci 2008;85:E1172–8. [DOI] [PMC free article] [PubMed] [Google Scholar]
- 7.Katsoulos C, Karageorgiadis L, Vasileiou N, et al. Customized Hydrogel Contact Lenses for Keratoconus Incorporating Correction for Vertical Coma Aberration. Ophthalmic Physiol Opt 2009;29:321–9. [DOI] [PubMed] [Google Scholar]
- 8.Sabesan R, Johns L, Tomashevskaya O, et al. Wavefront-Guided Scleral Lens Prosthetic Device for Keratoconus. Optom Vis Sci 2013;90:314–23. [DOI] [PMC free article] [PubMed] [Google Scholar]
- 9.Jinabhai A, O’Donnell C, Tromans C, Radhakrishnan H. Optical Quality and Visual Performance with Customised Soft Contact Lenses for Keratoconus. Ophthalmic Physiol Opt 2014;34:528–39. [DOI] [PubMed] [Google Scholar]
- 10.Marsack J, Ravikumar A, Nguyen C, et al. Wavefront-Guided Scleral Lens Correction in Keratoconus. Optom Vis Sci 2014;91:1221–30. [DOI] [PMC free article] [PubMed] [Google Scholar]
- 11.Hastings G, Applegate R, Nguyen L, et al. Comparison of Wavefront-Guided and Best Conventional Scleral Lenses after Habituation in Eyes with Corneal Ectasia. Optom Vis Sci 2019;96:238–47. [DOI] [PMC free article] [PubMed] [Google Scholar]
- 12.American National Standards Institute (ANSI). Methods for Reporting Optical Aberrations of Eyes: ANSI Z80.28. Merrifield, VA: ANSI; 2004. [Google Scholar]
- 13.Jeong T, Menon M, Yoon G. Measurement of Wave-front Aberration in Soft Contact Lenses by use of a Shack–Hartmann Wave-front Sensor. Appl Opt 2005;44:4523–7. [DOI] [PubMed] [Google Scholar]
- 14.Marsack J, Pesudovs K, Sarver E, Applegate R. Impact of Zernike-Fit Error on Simulated High- and Low-Contrast Acuity in Keratoconus: implications for using Zernike-Based Corrections. J Opt Soc Am (A) 2006;23:769–76. [DOI] [PMC free article] [PubMed] [Google Scholar]
- 15.van den Berg T The (Lack of) Relation between Straylight and Visual Acuity. Two Domains of the Point-Spread-Function. Ophthalmic Physiol Opt 2017;37:333–41. [DOI] [PubMed] [Google Scholar]
- 16.Kollbaum P, Jansen M, Thibos L, Bradley A. Validation of an Off-Eye Contact Lens Shack-Hartmann Wavefront Aberrometer: Optom Vis Sci 2008;85:E817–28. [DOI] [PMC free article] [PubMed] [Google Scholar]
- 17.Thibos L, Hong X, Bradley A, Applegate R. Accuracy and Precision of Objective Refraction from Wavefront Aberrations. J Vis 2004;4:329–51. [DOI] [PubMed] [Google Scholar]
- 18.Marsack J, Thibos L, Applegate R. Metrics of Optical Quality derived from Wave Aberrations predict Visual Performance. J Vis 2004;4:322–8. [DOI] [PubMed] [Google Scholar]
- 19.Schoneveld P, Pesudovs K, Coster D. Predicting Visual Performance from Optical Quality Metrics in Keratoconus. Clin Exp Optom 2009;92:289–96. [DOI] [PubMed] [Google Scholar]
- 20.Ravikumar A, Sarver E, Applegate R. Change in Visual Acuity is Highly Correlated with Change in Six Image Quality Metrics Independent of Wavefront Error and/or Pupil Diameter. J Vis 2012;12:1–13. [DOI] [PMC free article] [PubMed] [Google Scholar]
- 21.Cheng X, Bradley A, Thibos L. Predicting Subjective Judgment of Best Focus with Objective Image Quality Metrics. J Vis 2004;4:310–21. [DOI] [PubMed] [Google Scholar]
- 22.Hastings G, Marsack J, Nguyen L, et al. Is an Objective Refraction Optimised using the Visual Strehl Ratio better than a Subjective Refraction? Ophthalmic Physiol Opt 2017;37:317–25. [DOI] [PMC free article] [PubMed] [Google Scholar]
- 23.Ravikumar A, Applegate R, Shi Y, Bedell H. Six Just-Noticeable Differences in Retinal Image Quality in 1 line of Visual Acuity: Toward Quantification of Happy versus Unhappy Patients with 20/20 Acuity. J Cataract Refract Surg 2011;37:1523–9. [DOI] [PMC free article] [PubMed] [Google Scholar]
- 24.Ravikumar A, Marsack J, Bedell H, et al. Change in Visual Acuity is Well Correlated with Change in Image-Quality Metrics for Both Normal and Keratoconic Wavefront Errors. J Vis 2013;13:1–16. [DOI] [PMC free article] [PubMed] [Google Scholar]
- 25.Guirao A, Williams D, Cox I. Effect of Rotation and Translation on the Expected Benefit of an Ideal Method to Correct the Eye’s Higher-Order Aberrations. J Opt Soc Am (A) 2001;18:1003–15. [DOI] [PubMed] [Google Scholar]
- 26.Guirao A, Cox I, Williams D. Method for Optimizing the Correction of the Eye’s Higher-Order Aberrations in the Presence of Decentrations. J Opt Soc Am (A) 2002;19:126–8. [DOI] [PubMed] [Google Scholar]
- 27.Thibos L, Cheng X, Bradley A. Design Principles and Limitations of Wave-front Guided Contact Lenses. Eye & Contact Lens 2003;29:S167–70. [DOI] [PubMed] [Google Scholar]
- 28.López-Gil N, Castejón-Mochón J, Fernández-Sánchez V. Limitations of the Ocular Wavefront Correction with Contact Lenses. Vis Res 2009;49:1729–37. [DOI] [PubMed] [Google Scholar]
- 29.Shi Y, Applegate RA, Wei X, et al. Registration Tolerance of a Custom Correction to Maintain Visual Acuity. Optom Vis Sci 2013;90:1370–84. [DOI] [PubMed] [Google Scholar]
- 30.Shi Y, Queener HM, Marsack JD, et al. Optimizing Wavefront-Guided Corrections for Highly Aberrated Eyes in the Presence of Registration Uncertainty. J Vis 2013;13:1–15. [DOI] [PMC free article] [PubMed] [Google Scholar]
- 31.Optocraft GmbH. SHSLab Technical Manual, January 2016 release. Erlangen, Germany: Optocraft GmbH; 2016. [Google Scholar]
- 32.Pfund J, Lindlein N, Schwider J, et al. Absolute Sphericity Measurement: A Comparative Study of the use of Interferometry and a Shack–Hartmann Sensor. Optics Lett 1998;23:742–4. [DOI] [PubMed] [Google Scholar]
- 33.Applegate R, Sarver E, Khemsara V. Are All Aberrations Equal? J Refract Surg 2002;18:S556–62. [DOI] [PubMed] [Google Scholar]
- 34.Applegate R, Ballentine C, Gross H, et al. Visual Acuity as a function of Zernike Mode and Level of Root Mean Square Error. Optom Vis Sci 2003;80:97–105. [DOI] [PubMed] [Google Scholar]
- 35.Applegate R, Marsack J, Ramos R, Sarver E. Interaction between Aberrations to Improve or Reduce Visual Performance. J Cataract Refract Surg 2003;29:1487–95. [DOI] [PubMed] [Google Scholar]


