Abstract
The high expression of human equilibrative nucleoside transporter‐1 (hENT1) and the low expression of dihydropyrimidine dehydrogenase (DPD) are reported to predict a favorable prognosis in patients treated with gemcitabine (GEM) and 5‐fluorouracil (5FU) as the adjuvant setting, respectively. The expression of hENT1 and DPD were analyzed in patients registered in the JASPAC 01 trial, which showed a better survival of S‐1 over GEM as adjuvant chemotherapy after resection for pancreatic cancer, and their possible roles for predicting treatment outcomes and selecting a chemotherapeutic agent were investigated. Intensity of hENT1 and DPD expression was categorized into no, weak, moderate or strong by immunohistochemistry staining, and the patients were classified into high (strong/moderate) and low (no/weak) groups. Specimens were available for 326 of 377 (86.5%) patients. High expression of hENT1 and DPD was detected in 100 (30.7%) and 63 (19.3%) of 326 patients, respectively. In the S‐1 arm, the median overall survival (OS) with low hENT1, 58.0 months, was significantly better than that with high hENT1, 30.9 months (hazard ratio 1.75, P = 0.007). In contrast, there were no significant differences in OS between DPD low and high groups in the S‐1 arm and neither the expression levels of hENT1 nor DPD revealed a relationship with treatment outcomes in the GEM arm. The present study did not show that the DPD and hENT1 are useful biomarkers for choosing S‐1 or GEM as adjuvant chemotherapy. However, hENT1 expression is a significant prognostic factor for survival in the S‐1 arm.
Keywords: biomarker, dihydropyrimidine dehydrogenase, human equilibrative nucleoside transporter‐1, JASPAC 01, pancreatic cancer
In the S‐1 arm, the median overall survival (OS) with low hENT1, 58.0 months, was significantly better than that with high hENT1, 30.9 months (hazard ratio 1.75, P = .007). In contrast, there were no significant differences in OS between DPD low and high groups in the S‐1 arm and neither the expression levels of hENT1 nor DPD revealed a relationship with treatment outcomes in the GEM arm.
1. INTRODUCTION
Pancreatic cancer is one of the most aggressive and devastating malignant solid tumors, and the mortality rate is rising.1 Most patients have unresectable status with distant metastases, and surgical resection is possible in approximately 10% of all pancreatic cancer patients.2 Introducing adjuvant chemotherapy leads to more than a doubling of the 5‐year survival rate, from approximately 10% with surgery alone to approximately 44%, in patients with resectable disease.3, 4, 5 Disease‐free and overall survival rates could be improved by adjuvant chemotherapy with 5‐fluorouracil (5‐FU) and folinic acid (FA), or gemcitabine (GEM) monotherapy for 6 months following pancreatectomy.3, 4
Japan Adjuvant Study Group of Pancreatic Cancer (JASPAC) 01 was a randomized, controlled phase III trial. Comparing S‐1 with GEM as adjuvant chemotherapy for patients with pancreatic cancer, the study confirmed the superiority of S‐1 (TS‐1; Taiho Pharmaceutical) to GEM.5 Long‐term survival was obtained in some patients of the GEM group, while some patients had early recurrence in the S‐1 group, despite the fact that the prognosis of the S‐1 group, on the whole, was better than for the GEM group in the JASPAC 01 study. Although more targeted therapies may be possible with improved understanding of the molecular pathology of pancreatic cancer,6, 7 there is the potential for improved outcomes based on current therapies using appropriate biomarkers.2 The JASPAC 01 study is an ideal tool for biomarker analyses to predict the efficacy of GEM and S‐1 for pancreatic cancer because it provides not only prospectively collected data but also more than 5 years of follow‐up data.
The human equilibrative nucleoside transporter 1 (hENT1), which controls the bidirectional passage into cells of pyrimidine nucleosides such as GEM, capecitabine and 5‐FU, is a promising biomarker.8, 9 Dihydropyrimidine dehydrogenase (DPD), which is a rate‐limiting enzyme in 5‐FU catabolism, is another candidate.10 The correlations between the expression levels of these biomarkers in tumor specimens and clinical outcomes have been shown. Many studies have suggested that their expression level could accurately predict the clinical outcome in patients receiving fluoropyrimidine‐based chemotherapy11 or GEM.12, 13, 14, 15, 16, 17, 18 However, there is no consensus about the clinical importance of the expressions of these genes, as each study has different results,19, 20, 21, 22 and most published reports concern relatively small randomized studies or retrospective analyses.
We assessed the expression of hENT1 and DPD genes by immunohistochemistry staining using specimens obtained from patients registered in the JASPAC 01 study. The main aim of the present study was to determine whether hENT1 and/or DPD expressions in tumor tissue would help predict the outcomes for the patients treated with S‐1 or GEM.
2. MATERIALS AND METHODS
2.1. Study population and design
We retrospectively designed this biomarker study, after the completion of the final analysis of the JASPAC 01, to investigate whether hENT1 and/or DPD could predict a prognostic benefit of S‐1 and/or GEM, and collected the tumor tissue from patients registered in the JASPAC 01.5 Unstained slides made by formalin‐fixed, paraffin‐embedded (FFPE) surgical resection specimens stocked at each of the 24 collaborating institution were collected for 326 of all 377 (86.5%) patients enrolled in the JASPAC 01 and the biomarker study population comprised 326 patients (Figure 1). The protocol of this biomarker study was approved by the ethics committee of the Shizuoka Cancer Center “27‐22‐27‐1‐5” and each collaborating institutional review board.
Figure 1.
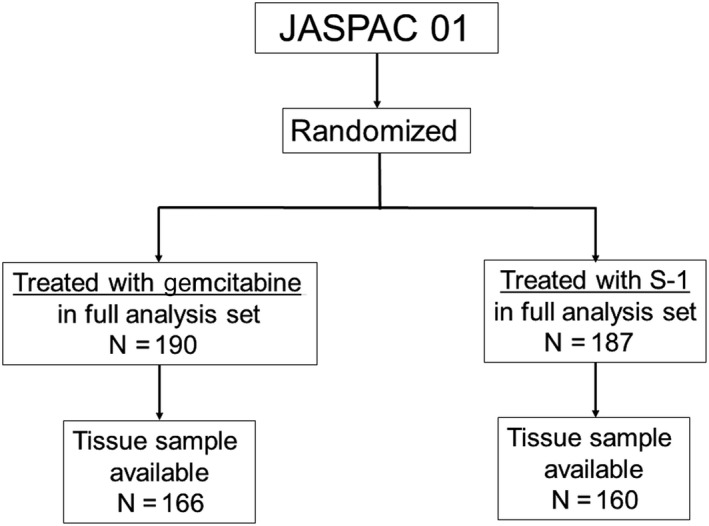
Patient flow diagram
2.2. Immunohistochemistry
Immunohistochemistry (IHC) for hENT1 was carried out on the unstained slides (thickness: 3‐5‐μm) according to the standard protocol (anti–hENT1 rabbit monoclonal antibody SP120, Roche Tissue Diagnostics; already diluted antibody) and IHC for DPD was also performed (anti–DPD mouse monoclonal antibody ADPYDMAB, Immune‐Biological Laboratories; 1:50). These antibodies were tested for specific binding in vitro using western blotting.
Two independent pathologists (SY and AY), who were blinded to all clinical information, evaluated the intensity of staining using light microscopy. The intensity of the DPD and hENT1 expression was evaluated as previously reported.16, 20 Pancreatic islet cells were used as an internal positive control for anti–DPD and anti–hENT1 staining because DPD and hENT1 are strongly expressed in islet cells.15 The intensity of tumor cell immunostaining was classified into four groups as follows: no, not stained; weak, <50% of the tumor cells were weakly stained in comparison to positive control; moderate, <50% of the tumor cells were strongly stained in comparison to positive control or weakly stained compared to positive control in 50% or ≥ 50% of the tumor cells were weakly stained in comparison to positive control; strong, ≥50% of the tumor cells were strongly stained in comparison to positive control. The high and low expression of hENT1 and DPD was defined as strong/moderate staining and no/weak staining, respectively. Ambiguous cases were discussed to obtain agreement each other.
2.3. Baseline data
JASPAC 01 was a randomized phase 3 trial comparing adjuvant S‐1 versus adjuvant GEM in patients who underwent curative resection for pancreatic cancer.5 One cycle treatment with GEM (1000 mg/m2 on days 1, 8 and 15) followed by a 1‐week rest period was repeated every 4 weeks for 24 weeks in an outpatient setting, and patients assigned to the S‐1 group received S‐1 (40 mg for a body surface area less than 1.25 m2, 50 mg for a body surface area of 1.25 m2 to 1.5 m2, or 60 mg for a body surface area ≥ 1.5 m2), twice oral intake per day for 28 consecutive days followed by a 14‐day rest (one cycle). This administration of S‐1 was repeated every 6 weeks for up to four cycles.5 In both groups, subsequent follow‐up examinations were performed at 3‐month intervals. In this study, a total of 377 patients who underwent macroscopic curative resection for pancreatic cancer (R0 and R1 resection) were finally recruited between April 2007 and June 2010.
2.4. Statistical analysis
The χ 2‐test or Fisher’s exact test was used for comparisons between the categorical variables. Continuous variables are compared using the Mann‐Whitney U‐test and are shown as the median and range. The survival rate was calculated using the Kaplan‐Meier method and compared using the log‐rank test. A Cox proportional hazards model was used for the univariate and multivariate analyses, and all factors found to be significant predictors (P < .05) in the univariate analysis were entered into the multivariate analysis. The multivariate analysis was performed according to the logistic regression method using a backward stepwise selection model. All statistical analyses were performed using the SPSS 26.0 software package (SPSS). Two‐tailed P‐values of < 0.05 were considered to indicate statistical significance.
We estimated the minimum difference in survival that would be required to show a significant difference in survival between patients with tumors in which gene expression was high or low in each treatment arm. Given a tertile or median cutoff point, demonstrating a statistically significant difference in survival between patients with tumors with high and low gene expression levels would require hazard ratios of at least 0.51 and 0.57, respectively, assuming a two‐sided α value of 0.05 and a power of 80% in a proportional hazards model. Thus, we determined that each arm should include approximately 150 patients.
3. RESULTS
3.1. Patient characteristics
No statistical difference was identified between the population used in the present study and the total population of the JAPAC 01 study (Table 1).5 The gene expression levels and other factors in enrolled patients were well balanced between the S‐1‐treated and GEM‐treated groups.
Table 1.
Baseline characteristics of the patients in the study
| Characteristics | Overall | hENT1 expression | P | DPD expression | P | ||
|---|---|---|---|---|---|---|---|
| High | Low | High | Low | ||||
| N = 326 | N = 100 (30.7%) | N = 226 (69.3%) | N = 63 (19.3) | N = 263 (80.7%) | |||
| Sex (number, %) | |||||||
| Male | 181 (55.5) | 58 (58.0) | 123 (54.4) | .549 | 38 (60.3) | 143 (64.4) | .349 |
| Female | 145 (44.5) | 42 (42.0) | 103 (45.6) | 25 (39.7) | 120 (45.6) | ||
| Agea | 66 (34‐86) | 65 (44‐82) | 67 (34‐86) | .218 | 66 (37‐83) | 66 (34‐86) | .432 |
| ECOG performance status (number, %) | |||||||
| 0 | 220 (67.5) | 62 (62.0) | 158 (69.9) | .160 | 32 (50.8) | 188 (71.5) | .002 |
| 1 | 106 (32.5) | 38 (38.0) | 68 (30.1) | 31 (49.2) | 75 (28.5) | ||
| Survival time (years) | |||||||
| Median RFS (95% CI) | 1.29 (1.08‐1.54) | 1.18 (0.97‐1.39) | 1.51 (1.08‐1.94) | .092 | 1.27 (0.80‐1.73) | 1.43 (1.08‐1.78) | .702 |
| Median OS (95% CI) | 2.85 (2.46‐3.49) | 2.43 (1.59‐3.28) | 3.42 (2.67‐4.17) | .091 | 3.31 (1.64‐4.99) | 2.90 (2.30‐3.50) | .525 |
| Treatment arm (number, %) | |||||||
| Gemcitabine | 166 (50.9) | 51 (51.0) | 115 (50.9) | .985 | 31 (49.2) | 135 (51.3) | .762 |
| S‐1 | 160 (49.1) | 49 (49.0) | 111 (49.1) | 32 (50.8) | 128 (48.7) | ||
| Residual tumor status (number, %) | |||||||
| R0 | 283 (86.8) | 87 (87.0) | 196 (86.7) | .946 | 54 (85.7) | 229 (87.1) | 0.775 |
| R1 | 43 (13.2) | 13 (13.0) | 30 (13.3) | 9 (14.3) | 34 (12.9) | ||
| Primary tumor status (number, %)b | |||||||
| T1‐T2 | 36 (11.0) | 10 (10.0) | 26 (11.5) | .689 | 5 (7.6) | 31 (11.8) | .381 |
| T3‐T4 | 290 (89.0) | 90 (90.0) | 200 (88.5) | 58 (92.4) | 232 (88.2) | ||
| Regional lymph node status (number, %)b | |||||||
| N0 | 114 (35.0) | 28 (28.0) | 86 (38.1) | .079 | 23 (36.5) | 91 (34.6) | .776 |
| N1 | 212 (65.0) | 72 (72.0) | 140 (61.9) | 40 (63.5) | 172 (65.4) | ||
| CA19‐9 (median, IQR) | |||||||
| ≤37 U/mL | 257 (78.8) | 75 (75.0) | 182 (80.5) | .330 | 48 (76.2) | 209 (79.5) | 0.721 |
| >37 U/mL | 68 (20.9) | 24 (24.0) | 44 (19.5) | 14 (22.2) | 54 (20.5) | ||
| Pathological stage (number, %)b | |||||||
| IA | 17 (75.0) | 2 (2.0) | 15 (6.6) | .203 | 2 (3.2) | 15 (5.7) | .803 |
| IB | 8 (24.0) | 3 (3.0) | 5 (2.2) | 1 (1.6) | 7 (2.7) | ||
| IIA | 88 (75.0) | 23 (23.0) | 65 (28.8) | 19 (30.2) | 69 (26.2) | ||
| IIB | 211 (24.0) | 72 (72.0) | 139 (61.5) | 41 (65.1) | 170 (64.6) | ||
| III | 2 (75.0) | 0 | 2 (0.9) | 0 | 2 (0.8) | ||
The values in parentheses are percentages unless indicated otherwise.
DPD, dihydropyrimidine dehydrogenase; ECOG, Eastern Cooperative Oncology Group; hENT1, human equilibrative nucleoside transporter‐1; IQR, interquartile range.
Value is median (range).
Primary tumor status, regional lymph node status and pathological stage were described according to the TNM Classification of Malignant Tumours, 6th edition.
3.2. Expression of human equilibrative nucleoside transporter‐1 and dihydropyrimidine dehydrogenase according to immunohistochemistry
The strong, moderate and weak immunohistochemical expressions of hENT1 in the tumor were identified in 31, 69 and 146 patients, respectively; no expression was detected in 80 patients (Figure 2A‐D). The strong, moderate and weak immunohistochemical expressions of DPD in the tumor were identified in 9, 54 and 168 patients, respectively; no expression was detected in 95 patients (Figure 3A‐D). As a result, the high expression of hENT1 and DPD was identified in 100 and 63 of 319 patients (30.7% and 19.3%), respectively.
Figure 2.
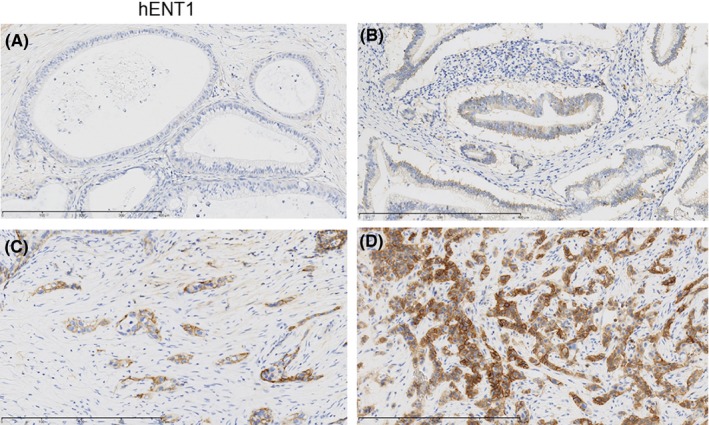
Examples of cases with the intensity of immunohistochemistry staining of cytoplasmic human equilibrative nucleoside transporter‐1 (hENT1) expression. A, no; B, weak; C, moderate; D, strong
Figure 3.
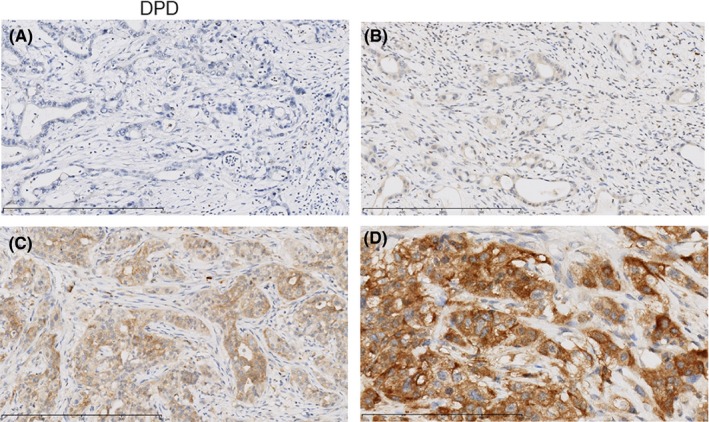
Examples of cases with the intensity of immunohistochemistry staining of cytoplasmic dihydropyrimidine dehydrogenase (DPD) expression. A, no; B, weak; C, moderate; D, strong
3.3. Correlation between the cytoplasmic human equilibrative nucleoside transporter‐1 and dihydropyrimidine dehydrogenase expression and survival
The median overall survival was 25.9 months in the GEM‐treated patients (95% confidence interval [CI] 20.6‐31.2), while the median overall survival was 44.6 months (95% CI 31.5‐57.7) in the S‐1‐treated patients (hazard ratio [HR] 0.62, 95% CI 0.47‐0.80, P < 0.001).
The median relapse‐free survival of the GEM‐treated patients was 13.4 months (95% CI 10.4‐16.4), while that of the S‐1‐treated patients was 22.6 months (95% CI 31.5‐57.7; HR 0.68, 95% CI 0.52‐0.87, P = 0.003).
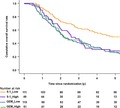
According to the hENT1 expression (Figure 4), the median overall survival in the GEM‐treated patients with low hENT1 was 26.1 months (95% CI 19.7‐32.5), while that with high hENT1 patients was 25.5 months (95% CI 19.3‐31.7). The HR was 1.05 (95% CI 0.72‐1.53, P = .786), with no significant difference (Figure 5A). Unexpectedly, the median overall survival in the S‐1‐treated patients with low hENT1 was 58.0 months (95% CI 30.9‐85.0), which was significantly better than that with high hENT1 (30.9 months: 95% CI 21.4‐40.4). The HR was 1.75 (95% CI 1.16‐2.64, P = 0.007) for high hENT1 to low hENT1 (Figure 5B).
Figure 4.
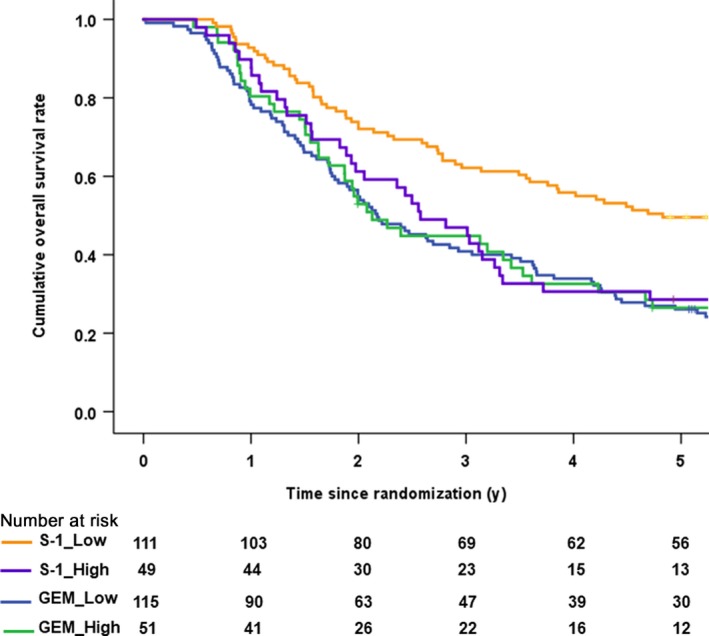
Kaplan‐Meier survival curves for overall survival after the stratification by human equilibrative nucleoside transporter‐1 (hENT1) expression and treatment arm
Figure 5.
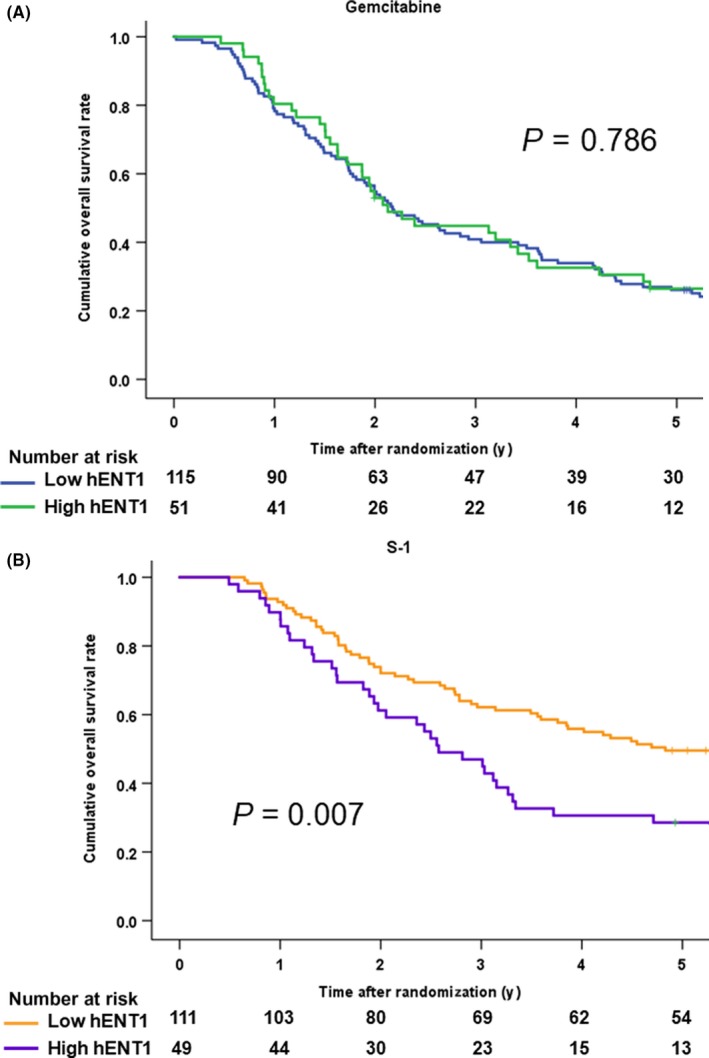
A, Kaplan‐Meier survival curves for overall survival in the gemcitabine arm after the stratification by human equilibrative nucleoside transporter‐1 (hENT1) expression. B, Kaplan‐Meier survival curves for overall survival in the S‐1 arm after the stratification by human equilibrative nucleoside transporter‐1 (hENT1) expression
The median relapse‐free survival of the GEM‐treated patients with low hENT1 was 12.6 months (95% CI 8.5‐16.7), while that of the patients with high hENT1 was 13.5 months (95% CI 8.1‐19.0). The HR was 1.01 (95% CI 0.69‐1.46, P = .979). The median relapse‐free survival of the S‐1‐treated patients with low hENT1 was 28.4 months (95% CI 19.2‐37.6), which was significantly better than that of the patients with high hENT1 (15.1 months: 95% CI 8.2‐21.9). The HR for high hENT1 to low hENT1 was 1.60 (95% CI 1.07‐2.38, P = 0.022).
According to the DPD expressions (Figure 6A), the median overall survival of the GEM‐treated patients with low DPD was 26.1 months (95% CI 21.9‐30.3) while that of the high DPD patients was 25.5 months (95% CI 0.4‐50.6). The HR was 0.85 (95% CI 0.56‐1.30, P = .445) (Figure 6B). The median overall survival in the S‐1‐treated patients with low DPD was 44.6 months (95% CI 31.6‐57.7) while that of the high DPD patients was 42.7 months (95% CI 0.4‐50.6). The HR was 1.05 (95% CI 0.65‐1.72, P = 0.833) (Figure 6C).
Figure 6.
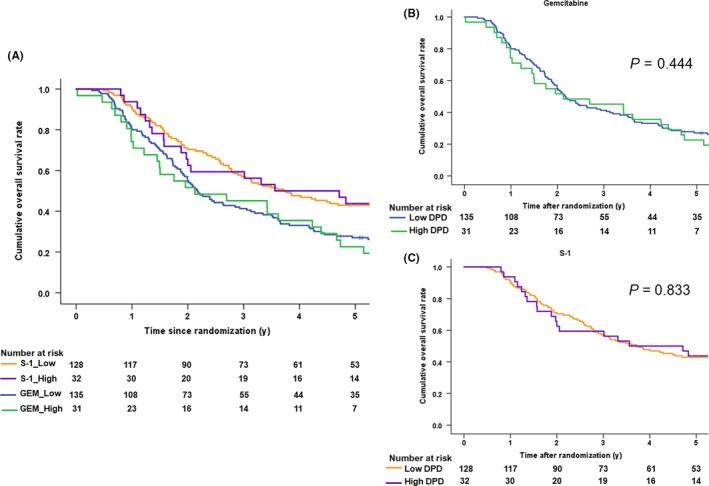
A, Kaplan‐Meier survival curves for overall survival after the stratification by dihydropyrimidine dehydrogenase (DPD) expression and treatment arm. B, Kaplan‐Meier survival curves for overall survival in the gemcitabine arm after the stratification by dihydropyrimidine dehydrogenase (DPD) expression. C, Kaplan‐Meier survival curves for overall survival in the S‐1 arm after the stratification by dihydropyrimidine dehydrogenase (DPD) expression
The median relapse‐free survival of the GEM‐treated patients with low DPD was 12.9 months (95% CI 8.8‐16.9), while that of the patients with high DPD was 14.7 months (95% CI 9.35‐20.0). The HR was 0.94 (95% CI 0.61‐1.45, P = 0.794). The median relapse‐free survival of the S‐1‐treated patients with low DPD was 23.2 months (95% CI 14.3‐32.1), while that the patients with high DPD was 17.9 months (95% CI 5.9‐29.9). The HR was 1.08 (95% CI 0.68‐1.71, P = 0.744).
3.4. The forest plot analysis for overall survival
The forest plot analysis revealed that HR were higher than 1.0 in the subgroups of patients with strong expression of hENT1 and histological types other than tubular adenocarcinoma. However, there were small numbers of patients in these subgroups (Figure 7). Although we defined the high and low expression of hENT1 and DPD as strong/moderate staining and no/weak staining in the current study, there was no cutoff point of IHC staining that could identify the patients who should receive GEM therapy rather than S‐1 therapy based on the hENT1 and DPD expression.
Figure 7.
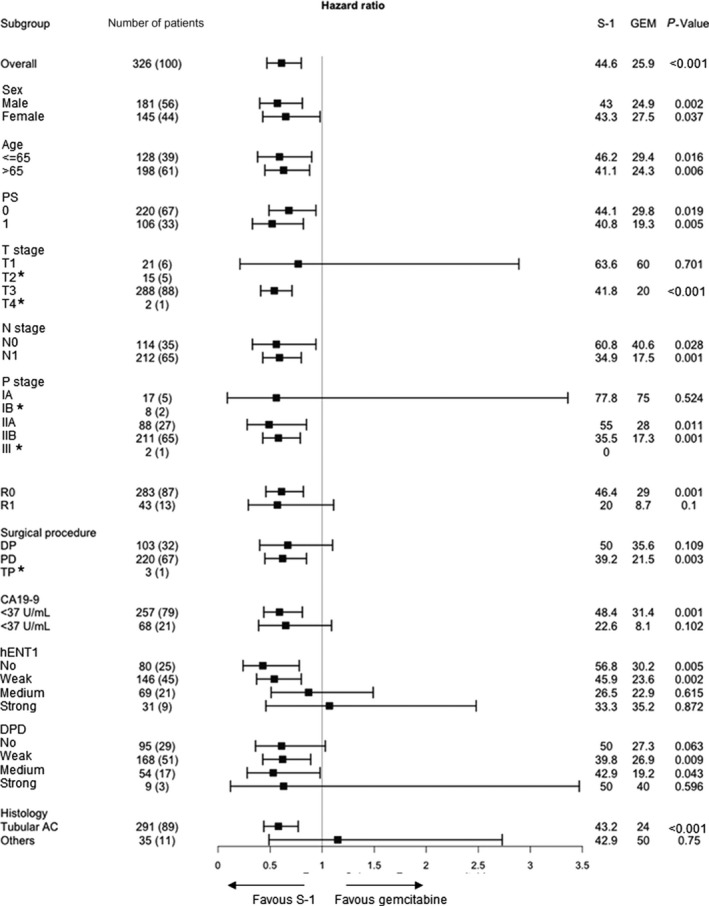
Forest plot analyses for overall survival. AC, adenocarcinoma; DP, distal pancreatectomy; HR, hazard ratio; PD, pancreatoduodenectomy; PS, Eastern Cooperative Oncology Group performance status; R0, no residual tumor; R1, microscopic presence of tumor cells at the surface of the resection margin; T stage and N stage, TNM classification of malignant tumors
3.5. Predictors for overall survival in S‐1‐treated patients
The multivariate analysis showed that CA19‐9 level > 37 U/mL, lymph node metastasis positivity, residual tumor status R1, and a moderate or strong hENT1 expression on IHC were significant predictors for overall survival (Table 2). The multivariate analysis showed that lymph node metastasis, residual tumor status R1 and positive staining (intensity, moderate or strong) of hENT1 on IHC were significant predictors of relapse‐free survival (Table 2).
Table 2.
Prognostic factors for the overall and relapse‐free survival in the patients who received S‐1 therapy by univariate and multivariate analyses
| Variables | Overall survival | Relapse‐free survival | ||||||
|---|---|---|---|---|---|---|---|---|
| Univariate | Multivariate | Univariate | Multivariate | |||||
| Hazard ratio (95% confidence interval) | P | Hazard ratio (95% confidence interval) | P | Hazard ratio (95% confidence interval) | P | Hazard ratio (95% confidence interval) | P | |
| Sex (male/female) | 1.07 (0.72‐1.61) | .728 | 0.98 (0.67‐1.44) | .932 | ||||
| Age (≥65 years/<65 years) | 1.19 (0.79‐1.79) | .404 | 1.15 (0.78‐1.70) | .478 | ||||
| ECOG performance status (1/0) | 1.08 (0.70‐1.67) | .716 | 1.02 (0.67‐1.54) | .939 | ||||
| Residual tumor status (R1/R0) | 1.89 (1.10‐3.23) | .020 | 1.90 (1.11‐3.27) | .020 | 1.90 (1.13‐3.21) | .016 | ||
| Primary tumor status (T3‐T4/T1‐2) | 1.50 (0.73‐3.10) | .269 | 1.49 (0.75‐2.94) | .257 | ||||
| Regional lymph node status (N1/N0) | 2.02 (1.26‐3.25) | .004 | 1.83 (1.13‐2.97) | .014 | 1.92 (1.23‐2.99) | .004 | 1.91 (1.22‐2.98) | .005 |
| CA19‐9 (>37 U/mL/≤37 U/mL) | 2.11 (1.35‐3.29) | .001 | 2.02 (1.29‐3.17) | .002 | 1.94 (1.25‐3.03) | .003 | 2.04 (1.30‐3.20) | .002 |
| hENT1 expressions of IHC | ||||||||
| Weak or more/No | 1.65 (0.98‐2.78) | .061 | 1.83 (1.10‐3.05) | .019 | 1.84 (1.10‐3.07) | .021 | ||
| Moderate or strong (positive)/No or weak (negative) | 1.75 (1.16‐2.64) | .008 | 1.61 (1.06‐2.45) | .027 | 1.60 (1.07‐2.38) | .022 | ||
| Strong/Moderate or less | 1.51 (0.81‐2.83) | .200 | 1.67 (0.93‐2.98) | .084 | ||||
| DPD expressions of IHC | ||||||||
| Weak or more/No | 1.13 (0.71‐1.83) | .603 | 1.04 (0.67‐1.61) | .852 | ||||
| Moderate or strong (positive)/No or weak (negative) | 1.05 (0.65‐1.72) | .833 | 1.08 (0.68‐1.71) | .744 | ||||
| Strong/Moderate or less | 0.92 (0.23‐3.73) | .905 | 0.76 (0.19‐3.06) | .694 | ||||
DPD, dihydropyrimidine dehydrogenase; ECOG, Eastern Cooperative Oncology Group; hENT1, human equilibrative nucleoside transporter‐1; IHC, immunohistochemistry.
3.6. Predictors of overall and relapse‐free survival in gemcitabine‐treated patients
The multivariate analysis showed that T factor (T3‐4) was a significant predictor of overall and relapse‐free survival and the regional lymph node status being positive was a significant predictor of relapse‐free survival (Table 3).
Table 3.
Prognostic factors for the overall and relapse‐free survival in the patients who received GEM therapy by univariate and multivariate analyses
| Variables | Overall survival | Relapse‐free survival | ||||||
|---|---|---|---|---|---|---|---|---|
| Univariate | Multivariate | Univariate | Multivariate | |||||
| Hazard ratio (95% confidence interval) | P | Hazard ratio (95% confidence interval) | P | Hazard ratio (95% confidence interval) | P | Hazard ratio (95% confidence interval) | P | |
| Sex (male/female) | 1.24 (0.88‐1.75) | .219 | 1.14 (0.81‐1.62) | .447 | ||||
| Age (≥65 years/<65 years) | 1.00 (0.98‐1.02) | .404 | 0.91 (0.64‐1.30) | .912 | ||||
| ECOG performance status (1/0) | 1.46 (1.02‐2.09) | .037 | 1.41 (0.98‐2.02) | .066 | ||||
| Residual tumor status (R1/R0) | 1.99 (1.24‐3.20) | .004 | 1.73 (1.07‐2.81) | .025 | ||||
| Primary tumor status (T3‐T4/T1‐2) | 4.22 (1.97‐9.07) | <.001 | 3.39 (1.55‐7.39) | .002 | 3.95 (1.93‐8.11) | <.001 | 3.26 (1.57‐6.77) | .002 |
| Regional lymph node status (N1/N0) | 1.89 (1.30‐2.75) | .001 | 1.98 (1.36‐2.88) | <.001 | 1.59 (1.08‐2.34) | .019 | ||
| CA19‐9 (>37 U/mL/≤37 U/mL) | 1.84 (1.24‐2.73) | .003 | 1.76 (1.17‐2.64) | .007 | ||||
| hENT1 expressions of IHC | ||||||||
| Weak or more/No | 1.01 (0.68‐1.50) | .952 | 1.24 (0.82‐1.86) | .308 | ||||
| Moderate or strong (positive)/No or weak (negative) | 0.78 (0.42‐1.45) | .430 | 1.01 (0.69‐1.46) | .979 | ||||
| Strong/Moderate or less | 1.51 (0.81‐2.83) | .200 | 0.89 (0.49‐1.62) | .704 | ||||
| DPD expressions of IHC | ||||||||
| Weak or more/No | 1.13 (0.78‐1.86) | .530 | 1.27 (0.87‐1.86) | .207 | ||||
| Moderate or strong (positive)/No or weak (negative) | 0.85 (0.56‐1.30) | .445 | 0.94 (0.61‐1.45) | .794 | ||||
| Strong/Moderate or less | 0.86 (0.32‐2.33) | .765 | 0.54 (0.17‐1.71) | .296 | ||||
DPD, dihydropyrimidine dehydrogenase; ECOG, Eastern Cooperative Oncology Group; GEM, gemcitabine; hENT1, human equilibrative nucleoside transporter‐1; IHC, immunohistochemistry.
4. DISCUSSION
The present study was performed based on the hypothesis that hENT is a useful biomarker for efficacy of GEM and that DPD is a useful biomarker for S‐1. However, we failed to prove the hypothesis and unexpectedly found that hENT1 is a candidate biomarker for S‐1.
The JASPAC 01 study showed that the HR for mortality in S‐1‐treated patients, in comparison to GEM‐treated patients, was 0.57 (the estimated 5‐year overall survival rate in the S‐1 group was 44.1%, while that in the GEM group was 24.4%);5 however, there may be some patients for whom GEM is more effective than S‐1. From the previous paper’s results,11, 12, 13, 14, 15, 16, 17, 18 the high expression of hENT1 is considered to be a favorable predictor in GEM‐treated patients and a low DPD expression is considered to be a favorable predictor for S‐1‐treated patients. Thus, it can be hypothesized that patients with high hENT1 and DPD expression levels may have high response to GEM rather than S‐1. If we could select such patients before adjuvant therapy, the 5‐year overall survival rate after surgery for pancreatic cancer might reach over 50%. The final goal of the present study was to establish the appropriate use of individualized adjuvant chemotherapy with S‐1 or GEM.
Unexpectedly, the present study showed that hENT1 is a candidate biomarker for S‐1. Although the hENT1 expression has been known as a biomarker of GEM, researchers have paid little attention to the relationship between hENT1 expression and other anti–cancer drugs. Tsujie et al showed that hENT1 mRNA levels might predict the 5‐FU sensitivity for pancreatic cancer.23 Although the results of the present study used immunohistochemistry rather than mRNA levels, they were consistent with the result of Tsujie et al. However, its mechanism has not been clarified, which should be investigated in the future. Because the present study showed no advantage, in terms of survival, in patients with high hENT1 expression levels who were treated with S‐1 (in comparison to GEM), GEM may also be the first choice for such patients. In contrast, the 5‐year overall survival rate in the S‐1‐treated patients with low hENT1 exceeded 50% and S‐1 was the best treatment for such patients.
Regarding hENT1, some studies have shown that hENT1 can predict the treatment outcomes in patients treated with GEM but not those treated with S‐1 for pancreatic ductal adenocarcinoma.12, 13, 14, 15 Notably, all studies were performed using the mouse monoclonal antibody 10D7G2, which is not commercially available. Moreover, the scoring systems to assign patients to high or low hENT1 expression subgroups were different among these investigations, despite using the same antibody. Several retrospective studies with small cohorts have shown that the hENT1 expression, which was assessed using a rabbit polyclonal antibody, is useful for predicting the survival of pancreatic cancer patients who were treated with GEM.16, 17, 18 In contrast, Sinn et al showed that the hENT1 expression using the monoclonal rabbit antibody SP120 does not predict the survival of pancreatic cancer patients who receive GEM as adjuvant treatment.19 The results of the present study were consistent with Sinn’s results and were in contrast to those of the abovementioned studies.
In addition to Sinn’s report, which was based on the CONKO‐001 study,20 the results of the present study are in line with those of other studies using SP120 for the evaluation of hENT1 expression.21, 22 In the GEM‐treated patients of both the AIO‐PK study21 and the CO‐101 study,22 which used the SP120 antibody, no relationship was demonstrated between the expression of hENT1 and survival. Although the review article related to this issue concluded that the expression of hENT1 is an appropriate biomarker for predicting the outcomes of patients undergoing adjuvant GEM‐based chemotherapy,24 the hENT1 expression level has no clinical utility in any studies in which SP120 was used to evaluate the expression of hENT1. The present study is the fifth study using specimens from a prospective, randomized controlled study. A reproducible standard procedure in which the antibody and cutoff points are standardized is urgently needed before the implementation of hENT1 as a predictive biomarker in pancreatic cancer treatment. If 10D7G2 is a promising antibody for detecting the expression of hENT1, surgeons and physicians who treat pancreatic cancer would want it to be commercially obtained.
S‐1, an oral 5‐FU prodrug, which has been developed in Japan, consists of tegaful (a prodrug of 5‐FU), gimeracil (a potent DPD inhibitor) and oteracil (an inhibitor of 5‐FU phosphorylation in the gastrointestinal tract) in a 1:0.4:1 molar concentration ratio.25 As mentioned above, some papers have shown that DPD is a useful biomarker for S‐1.16 However, S‐1 is used in East Asia, mainly in Japan, and is not widely used elsewhere in the world due to its side effects. Thus, most published reports have involved relatively small randomized or retrospective analyses from nonrandomized studies, and no report has shown the utility of the hENT1 and DPD expression for predicting the therapeutic effect of S‐1 using a large‐scale randomized clinical trial in the field of pancreatic cancer.
Elander et al revealed that high DPD expression was related to poor survival in a 5‐FU/FA arm. They concluded that the high DPD expression in tumors was a negative prognostic biomarker and that hENT1 and DPD expressions might be useful to select either postoperative 5‐FU/FA or GEM.26 These results were consistent with those of most published reports.16, 25 In contrast, Sasako et al showed that the high DPD expression in tumors was associated with substantial benefit from adjuvant S‐1 treatment in a large biomarker study in the field of gastric cancer.19 These inconsistent results between S‐1 and 5‐FU/FA may be caused by inhibition of DPD by gimeracil contained in S‐1. In addition, thymidylate synthase (TS) is known as the primary target of fluoropyrimidines27 and has been shown to be a favorable biomarker related to prognosis in S‐1‐treated patients with gastric cancer.19 Further study is necessary to explore the role of TS expression in predicting the effects of adjuvant drugs with pancreatic cancer.
We used immunohistochemistry to evaluate the expression of hENT1 and DPD in the present study. Most studies using large‐scale clinical test specimens evaluate gene expression using a tissue microarray (TMA).12, 13, 14, 15, 20 It remains possible that results were affected by the parts of the tumors that we evaluated tumor because pancreatic cancer tumors are very heterogeneous. In this regard, the use of immunohistochemistry in the present study allowed us to evaluate a broader range of tumors than TMA.
The present study has several limitations. We retrospectively designed this biomarker study after the completion of the final analysis of the JASPAC 01 study. Thus, not all patients permitted the examination of tumor samples; however, the collection rate was very high (86.5%) compared to similar studies using large‐scale clinical test specimens. Moreover, the subset data were equivalent to the overall study population data of the JASPAC 01 study. All patients who enrolled in the JASPAC 01 study were East Asian. The pharmacokinetics and pharmacodynamics of anti–cancer drugs in European and North American patients and East Asian patients might differ due to genetic differences. A further prospective study is therefore needed to objectively validate the results of the present study because the hENT1 expression is not used in actual clinical practice, even following the publication of several studies that have shown that hENT1 is a useful biomarker in patients treated with GEM.12, 13, 14, 15, 16, 17, 18
In conclusion, the present study did not show the utility of the hENT1 and DPD expression levels as biomarkers for GEM and S‐1, respectively, contrary to the hypothesis, which was based on the previous studies. In contrast, the median overall survival in the S‐1‐treated patients with low hENT1 expression was significantly better than that with high hENT1 expression and the low expression of hENT1 (weak or negative IHC staining) was a significant predictor for overall survival in the S‐1 arm.
CONFLICT OF INTEREST
KU received honoraria from Taiho. HN received research funding from Chugai Pharmaceutical. NB received honoraria from Taiho and Eli Lilly. AF received honoraria from Taiho, Eli Lilly Japan, Yakult Honsha and Daiichi Sankyo, and received rewards for an advisory role from Yakult Honsha. SN received research funding from Eisai. SH received a scholarship donation from Taiho. All remaining authors have declared no conflict of interest.
ACKNOWLEDGEMENTS
This work was supported by the Pharma‐Valley Center, Shizuoka Industrial Foundation with funding from Taiho Pharmaceutical under a research contract, Daiwa Securities Health Foundation, Takeda Science Foundation and the Japan Society for the Promotion of Science KAKENHI, Grant Numbers 26870919 and 17H04288. The authors thank all the patients and their families who participated in the study, and the institutions for supporting this study. We also thank Ryota Saigusa and Tokihiro Hikida, who work in the administrative office of the Pharma‐Valley Center, Shizuoka Industrial Foundation and Brian Quiin, from Japan Medical Communication, for editing a draft of this manuscript.
Okamura Y, Yasukawa S, Narimatsu H, et al. Human equilibrative nucleoside transporter‐1 expression is a predictor in patients with resected pancreatic cancer treated with adjuvant S‐1 chemotherapy. Cancer Sci. 2020;111:548–560. 10.1111/cas.14258
REFERENCES
- 1. Malvezzi M, Beruccio P, Levi F, La Vecchia C, Negri E. European cancer mortality predictions for the year 2014. Ann Oncol. 2014;25:1650‐1656. [DOI] [PubMed] [Google Scholar]
- 2. Van Laethem JL, Verslype C, Iovanna JL, et al. New strategies and designs in pancreatic cancer research: consensus guidelines report from a European expert panel. Ann Oncol. 2012;23:570‐576. [DOI] [PubMed] [Google Scholar]
- 3. Oettle H, Neuhaus P, Hochhaus A, et al. Adjuvant chemotherapy with gemcitabine and long‐term outcomes among patients with resected pancreatic cancer: the CONKO‐001 randomized trial. JAMA. 2013;310:1473‐1481. [DOI] [PubMed] [Google Scholar]
- 4. Neoptolemos JP, Stocken DD, Bassi C, et al. Adjuvant chemotherapy with fluorouracil plus folinic acid vs gemcitabine following pancreatic cancer resection: a randomized controlled trial. JAMA. 2010;304:1073‐1081. [DOI] [PubMed] [Google Scholar]
- 5. Uesaka K, Boku N, Fukutomi A, et al. Adjuvant chemotherapy of S‐1 versus gemcitabine for resected pancreatic cancer: a phase 3, open‐label, randomised, non‐inferiority trial (JASPAC 01). Lancet. 2016;388:248‐257. [DOI] [PubMed] [Google Scholar]
- 6. Li D, Abbruzzese JL. New strategies in pancreatic cancer: emerging epidemiologic and therapeutic concepts. Clin Cancer Res. 2010;16:4313‐4318. [DOI] [PMC free article] [PubMed] [Google Scholar]
- 7. Costello E, Greenhalf W, Neoptolemos JP. New biomarkers and targets in pancreatic cancer and their application to treatment. Nat Rev Gastroenterol Hepatol. 2012;9:435‐444. [DOI] [PubMed] [Google Scholar]
- 8. Yao SY, Ng AM, Cass CE. Nucleobase transport by human equilibrative nucleoside transporter 1 (hENT1). J Biol Chem. 2009;284:17266‐17280. [DOI] [PMC free article] [PubMed] [Google Scholar]
- 9. Spratlin J, Sangha R, Glubrecht D, et al. The absence of human equilibrative nucleoside transporter 1 is associated with reduced survival in patients with gemcitabine‐treated pancreas adenocarcinoma. Clin Cancer Res. 2004;10:6956‐6961. [DOI] [PubMed] [Google Scholar]
- 10. Diasio RB, Johnson MR. Dihydropyrimidine dehydrogenase: its role in 5‐fluorouracil clinical toxicity and tumor resistance. Clin Cancer Res. 1999;5:2672‐2673. [PubMed] [Google Scholar]
- 11. Ichikawa W. Prediction of clinical outcome of fluoropyrimidine‐based chemotherapy for gastric cancer patients, in terms of the 5‐fluorouracil metabolic pathway. Gastric Cancer. 2006;9:145‐155. [DOI] [PubMed] [Google Scholar]
- 12. Maréchal R, Bachet JB, Mackey JR, et al. Levels of gemcitabine transport and metabolism proteins predict survival times of patients treated with gemcitabine for pancreatic adenocarcinoma. Gastroenterology. 2012;143:664‐674. [DOI] [PubMed] [Google Scholar]
- 13. Maréchal R, Mackey JR, Lai R, et al. Human equilibrative nucleoside transporter 1 and human concentrative nucleoside transporter 3 predict survival after adjuvant gemcitabine therapy in resected pancreatic adenocarcinoma. Clin Cancer Res. 2009;15:2913‐2919. [DOI] [PubMed] [Google Scholar]
- 14. Greenhalf W, Ghaneh P, Neoptolemos JP, et al. Pancreatic cancer hENT1 expression and survival from gemcitabine in patients from the ESPAC‐3 trial. J Natl Cancer Inst. 2014;106:djt347. [DOI] [PubMed] [Google Scholar]
- 15. Farrel JJ, Elsaleh H, Garcia M, et al. Human equilibrative nucleoside transporter 1 levels predict response to gemcitabine in patients with pancreatic cancer. Gastroenterology. 2009;136:187‐195. [DOI] [PubMed] [Google Scholar]
- 16. Kondo N, Murakami Y, Uemura K, et al. Combined analysis of dihydropyrimidine dehydrogenase and human equilibrative nucleoside transporter 1 expression predicts survival of pancreatic carcinoma patients treated with adjuvant gemcitabine plus S‐1 chemotherapy after surgical resection. Ann Surg Oncol. 2012;19(Suppl 3):S646‐655. [DOI] [PubMed] [Google Scholar]
- 17. Nakagawa N, Murakami Y, Uemura K, et al. Combined analysis of intratumoral human equilibrative nucleoside transporter 1 (hENT1) and ribonucleotide reductase regulatory subunit M1 (RRM1) expression is a powerful predictor of survival in patients with pancreatic carcinoma treated with adjuvant gemcitabine‐based chemotherapy after operative resection. Surgery. 2013;153:565‐575. [DOI] [PubMed] [Google Scholar]
- 18. Morinaga S, Nakamura Y, Watanabe T, et al. Immunohistochemical analysis of human equilibrative nucleoside transporter‐1 (hENT1) predicts survival in resected pancreatic cancer patients treated with adjuvant gemcitabine monotherapy. Ann Surg Oncol. 2012;19(Suppl 3):S558‐564. [DOI] [PubMed] [Google Scholar]
- 19. Sasako M, Terashima M, Ichikawa W, et al. Impact of the expression of thymidylate synthase and dihydropyrimidine dehydrogenase genes on survival in stage II/III gastric cancer. Gastric Cancer. 2015;18:538‐548. [DOI] [PMC free article] [PubMed] [Google Scholar]
- 20. Sinn M, Riess H, Sinn BV, et al. Human equilibrative nucleoside transporter 1 expression analysed by the clone SP 120 rabbit antibody is not predictive in patients with pancreatic cancer treated with adjuvant gemcitabine ‐ Results from the CONKO‐001 trial. Eur J Cancer. 2015;51:1546‐1554. [DOI] [PubMed] [Google Scholar]
- 21. Poplin E, Wasan H, Rolfe L, et al. Randomized, multicenter, phase II study of CO‐101 versus gemcitabine in patients with metastatic pancreatic ductal adenocarcinoma: including a prospective evaluation of the role of hENT1 in gemcitabine or CO‐101 sensitivity. J Clin Oncol. 2013;31:4453‐4461. [DOI] [PubMed] [Google Scholar]
- 22. Ormanns S, Heinemann V, Raponi M, et al. Human equilibrative nucleoside transporter 1 is not predictive for gemcitabine efficacy in advanced pancreatic cancer: translational results from the AIO‐PK0104 phase III study with the clone SP120 rabbit antibody. Eur J Cancer. 2014;50:1891‐1899. [DOI] [PubMed] [Google Scholar]
- 23. Tsujie M, Nakamori S, Nakahira S, et al. Human equilibrative nucleoside transporter 1, as a predictor of 5‐fluorouracil resistance in human pancreatic cancer. Anticancer Res. 2007;27:2241‐2249. [PubMed] [Google Scholar]
- 24. Bird NT, Elmasry M, Jones R, et al. Immunohistochemical hENT1 expression as a prognostic biomarker in patients with resected pancreatic ductal adenocarcinoma undergoing adjuvant gemcitabine‐based chemotherapy. Br J Surg. 2017;104:328‐336. [DOI] [PubMed] [Google Scholar]
- 25. Shirasaka T, Shimamato Y, Ohshimo H, et al. Development of a novel form of an oral 5‐fluorouracil derivative (S‐1) directed to the potentiation of the tumor selective cytotoxicity of 5‐fluorouracil by two biochemical modulators. Anticancer Drugs. 1996;7:548‐557. [DOI] [PubMed] [Google Scholar]
- 26. Elander NO, Aughton K, Ghaneh P, et al. Expression of dihydropyrimidine dehydrogenase (DPD) and hENT1 predicts survival in pancreatic cancer. Br J Cancer. 2018;118:947‐954. [DOI] [PMC free article] [PubMed] [Google Scholar]
- 27. Danenberg PV. Thymidylate synthetase ‐ a target enzyme in cancer chemotherapy. Biochim Biophys Acta. 1977;473:73‐92. [DOI] [PubMed] [Google Scholar]


