

Abstract
Patients with triple‐negative breast cancer (TNBC) lack molecular targets and have an unfavorable outcome. CD155 is overexpressed in human cancers, but whether it plays a role in TNBC is unexplored. Here we found that CD155 was enriched in both TNBC cell lines and tumor tissues. High CD155 expression was related to poor prognosis of breast cancer patients. CD155 was associated with a mesenchymal phenotype. CD155 knockdown induced a mesenchymal‐epithelial transition in TNBC cells, and suppressed TNBC cell migration, invasion and metastasis in vitro and in vivo. Mechanistically, CD155 cross‐talked with oncogenic IL‐6/Stat3 and TGF‐β/Smad3 pathways. Moreover, CD155 knockdown inhibited TNBC cell growth and survival. Taken together, these data indicate that CD155 contributes to the aggressive behavior of TNBC; targeting CD155 may be beneficial to these patients.
Keywords: CD155, invasion, mesenchymal‐epithelial transition, metastasis
Our study identified for the first time that CD155 is overexpressed in TNBC, is associated with poor prognosis and contributes to the aggressive phenotype. Mechanistically, IL‐6/Stat3 and TGF‐β/Smad3 pathways may be involved in CD155‐associated TNBC EMT and metastasis. CD155 knockdown suppressed TNBC cell in vitro motility and in vivo metastasis, suggesting that CD155 is a potential molecular target for TNBC.
1. INTRODUCTION
Triple‐negative breast cancer (TNBC) lacks expression of estrogen receptor (ER), progesterone receptor (PR) and human epidermal growth factor receptor 2 (HER2). As TNBC patients have no established molecular targets at present, chemotherapy is still the standard treatment approach.1 In contrast to patients with other subtypes, TNBC patients usually demonstrate aggressive clinical behavior and have an unfavorable prognosis.2 Notably, TNBC is a heterogeneous disease consisting of different subgroups according to protein expression, mRNA signatures and genomic alterations.3 Some TNBC tumors display a mesenchymal or mesenchymal stem‐like phenotype.4
Epithelial‐to‐mesenchymal transition (EMT) means a shift from the epithelial state toward the mesenchymal state. This process allows epithelial cells to acquire mesenchymal traits and metastatic potentiality. Cancer cells during EMT demonstrate increased expression of vimentin but decreased expression of E‐cadherin (E‐cad). Mechanistically, transcription factors (TF) such as Zeb1, Slug, Twist1 and Snail are involved in EMT. Increasing evidence has indicated that EMT promotes breast cancer progression. Oncogenic pathways such as IL‐6/Stat3,5, 6, 7 TGF‐β/Smad3,8, 9, 10 Wnt11, 12 and Notch13, 14 are implicated in EMT‐associated breast cancer metastasis.
CD155, also called poliovirus receptor (PVR) or necl‐5, harbors conserved amino acids and domain structure similar to the immunoglobulin superfamily.15 CD155 belongs to the nectin‐like molecule family. Functionally, CD155 interacts with nectin‐3 to regulate cell adhesion and migration.16, 17 CD155 is overexpressed in human cancers.18 It has been reported that CD155 overexpression promotes cell migration and proliferation.17, 19, 20 Recently, our group revealed that CD155 was related to cancer cell apoptosis.21, 22 On the basis of in silico analysis, our present study identified a novel role of CD155 in breast cancer. We found that CD155 was enriched in TNBC and was associated with a mesenchymal phenotype. CD155 knockdown significantly suppressed TNBC cell migration, invasion and metastasis. Therefore, CD155 may be a potential molecular target for TNBC.
2. MATERIALS AND METHODS
2.1. In silico analysis
Patients negative for expression of ER and PR and amplification of HER2 were considered TNBC patients. The mRNA expression data in tissues were extracted from TCGA and Curtis23 within Oncomine (https://www.oncomine.org/) and GEPIA (http://gepia.cancer-pku.cn/index.html).24 The correlation of CD155 expression with survival was analyzed by GEPIA and Kaplan‐Meier plotter (http://kmplot.com/analysis/).25 Expression of CD155 and some other genes in breast cancer cell lines was investigated in http://www.ncbi.nlm.nih.gov/geo/query/acc.cgi?acc=GSE12777 26 and Cancer Cell Line Encyclopedia (CCLE) databases (https://portals.broadinstitute.org/ccle). Correlation analysis was performed using the Pearson correlation coefficient. DAVID tool (Version 6.8; https://david.ncifcrf.gov/) was used to predict pathways27 and gene ontology (GO). GO is commonly used to annotate genes from high‐throughput genome or transcriptome data.28 Functional analysis revealed their associated GO molecular processes, biological processes and cellular components. To expand differentially expressed genes (DEGs) into whole transcriptomes, the gene set enrichment analysis (GSEA) analysis was used to test the tendency of all genes in a given pathway for expression profiles.29 The 311 cases were categorized into a CD155 high expression group and a CD155 low expression group. GSEA analysis was performed using GSEA v2.0 software (http://software.broadinstitute.org/gsea/index.jsp). Statistical significance was assessed by comparing the enrichment score with the enrichment results generated from 1000 random permutations of the gene set to obtain P‐values.
2.2. Cell culture and breast cancer tissues
MDA‐MB‐231 (ER−PR−HER2−) and MCF‐7 (ER+PR+HER2−) cells were cultured in DMEM (Gibco), and BT549 (ER−PR−HER2−), T47D (ER+PR+HER2−) and 4T1 (ER−PR−HER2−) cells were cultured in RPMI1640 (Gibco). The culture media were supplemented with 10% FBS. All cells were cultured at 37°C in a humidified incubator with 5% CO2. The cells were digested using 0.25% trypsin and 0.02 mol/L EDTA in PBS and seeded in 6‐well and 12‐well plates for the experiments.
Human breast cancer tissues (TNBC 17 cases and non–TNBC 28 cases) and normal breast tissues (15 cases, at least 5 cm away from a tumor) were collected from patients at the First Affiliated Hospital of China Medical University. None of the patients had previously undergone radiotherapy or chemotherapy or any other therapy before the surgery. Approval was obtained for the use of clinical materials for research purposes by the Institutional Research Ethics Committee of China Medical University. All samples were collected and analyzed with the prior written informed consent of the patients. All samples were immediately frozen in liquid nitrogen and stored at −80°C. Then, total RNA and protein from these tissues were isolated. The rest of the tissues were fixed with formalin and embedded in paraffin.
2.3. Lentiviral shRNA transfection
CD155 shRNA lentivirus (shCD155) and control shRNA lentivirus (scramble) were constructed by Obio Technology. The shRNA sequence for shCD155‐1 is 5′‐CCTAGGCTACATCTTTCTT‐3′, for shCD155‐2 is 5′‐GGGCCAAGTGCACATCATT‐3′ and for scramble is 5′‐TTCTCCGAACGTGTCACGT‐3′. For stable knockdown, shRNA were cloned into pLKD‐CMV‐Puro‐U6‐shRNA vector. MDA‐MB‐231 and 4T1 cells were transfected with 25 MOI of scramble or shCD155 lentivirus. After 48 hours of infection, infected cells were selected by 5 μg/mL puromycin (Sigma) and confirmed as successfully established by using western blot.
2.4. Reagents and antibodies
The rabbit anti–CD155 polyclonal antibody (ab103630) and the mouse anti–α‐SMA monoclonal antibody (ab7817) were obtained from Abcam. The rabbit anti–ZO‐1 polyclonal antibody (#8193), the rabbit anti–MMP‐9 polyclonal antibody (#15561), the rabbit anti–Slug polyclonal antibody (#9585), the rabbit anti‐E‐cadherin polyclonal antibody (#3195), the rabbit anti–vimentin polyclonal antibody (#5741), the rabbit anti–ZEB1 polyclonal antibody (#3396), the rabbit anti–TGF‐β polyclonal antibody (#3711), the rabbit anti‐Smad3 polyclonal antibody (#9523), the rabbit anti‐IL‐6 polyclonal antibody (#12153), the rabbit anti‐Stat3 polyclonal antibody (#30835), the rabbit anti–phospho‐Stat3(Tyr705) polyclonal antibody (#9145), the rabbit anti‐Caspase3 polyclonal antibody (#9662), the rabbit anti‐Cleaved‐Caspase3 polyclonal antibody (#9664), the anti–rabbit IgG HRP‐linked antibody (#7074) and anti–mouse IgG HRP‐linked antibody (#7076), were purchased from Cell Signaling Technology. The mouse anti–GAPDH monoclonal antibody was purchased from Beyotime Biotechnology. The Alexa Fluor 488 and 594 fluorescent second antibodies were purchased from ThermoFisher Scientific.
2.5. RNA isolation and quantitative real‐time PCR
Total RNA was extracted from tissues with TRIzol Reagent (TaKaRa) according to the manufacturer’s instructions. Reverse transcription was carried out in a 25‐μL reaction volume with 2 μg of total RNA according to the manufacturer’s protocol for M‐MLV reverse transcriptase (Promega). The primers for CD155 are 5′‐GCTAGAAGGACTCACTAGACTCAGGAA‐3′ (forward) and 5′‐GTCGCCTCATCTGTCGTGGAAC‐3′ (reverse), and for 18S are 5′‐GCAGAATCCACGCCAGTACAAGAT‐3′ (forward) and 5′‐TCTTCTTCAGTCGCTCCAGGTCTT‐3′ (reverse). Relative quantities (Δ cycle threshold (Ct) value) were obtained by subtracting the Ct value of CD155 from 18 seconds. The fold change was calculated according to the formula 2−ΔΔCt. Each reaction was performed in triplicate.
2.6. Western blot
Total protein was lysed in a modified RIPA buffer containing 1 mmol/L DTT, 1 mmol/L PMSF and complete protease inhibitor cocktail (1 tablet/10 mL; Invitrogen). A total of 30 µg protein was separated on 10% SDS‐PAGE gel and transferred to a PVDF membrane. After blocking with 5% skimmed milk, western blots were performed with specific antibodies to detect the corresponding proteins and incubated at 4°C overnight. Then the membrane was washed and incubated with HRP‐conjugated secondary antibody (1:5000) for 2 hours at room temperature. To control sampling error, the same blot was also probed for GAPDH as an internal loading control. The specific protein bands were visualized using the enhanced chemiluminescence (ECL) method through the DNR Imaging System. The integral optical density of each band was analyzed using the Image‐J software and the ratio of band intensities of target protein over associated control was obtained. Data were expressed as the mean ± SD of at least three independent experiments.
2.7. Immunohistochemistry and image analysis
The tumor tissues were fixed with 4% paraformaldehyde for 72 hours, embedded in paraffin for preparation as H&E or immunostained sections. Briefly, the tissue sections were consecutively deparaffinized in xylene (I, II and III) and rehydrated using a graded series of alcohol (100% alcohol, 95% alcohol, 85% alcohol and 75% alcohol). For H&E, sections were stained with H&E. For immunohistochemistry, endogenous peroxidase was blocked with 3% hydrogen peroxide. Antigen retrieval process was performed in 0.01 mol/L sodium citrate solution (pH 6.0) in a high‐pressure steam boiler for 10 minutes. Sections were incubated with first antibody overnight at 4°C. Then, sections were incubated with goat anti–rabbit IgG and streptavidin peroxidase (SP) complex at 37°C for 30 minutes, and developed with the DAB reagent. The sections were observed under an Olympus BX61 microscope. Immunoreactivity was evaluated separately by two experienced pathologists who were blinded to the clinicopathological data of the participants.
Five randomly chosen fields of view were assessed. We used a staining index (SI; values 0‐12) with the following formula: SI = staining intensity × staining area, where intensities were scored semiquantitatively as follows: 0 (negative staining), 1 (mild staining), 2 (moderate staining) and 3 (intense staining). The staining area was scored as follows: 0, no staining of cells; 1, <25%; 2, 25%‐50%; 3, 50%‐75%; and 4, >75%. SI was graded as follows: 0‐1, negative expression; 2‐3, mild positive expression; 4‐8, moderate positive expression and 9‐12, strongly positive expression.30 All three levels were considered positive.
2.8. Immunofluorescence and confocal imaging
Cells were seeded onto adhesion cover slips for 16 hours, fixed with 4% paraformaldehyde in PBS for 15 minutes at 25°C and permeabilized with 0.1% Triton X‐100 for 15 minutes. Subsequently, cells were blocked with 1% donkey serum for 30 minutes followed by incubation with specific primary antibodies at 4°C overnight. After washing with PBS three times for 5 minutes, each time, the slides were subjected to fluorescent secondary antibody for 1 hour at room temperature. DAPI was used for nuclear staining. Cells were mounted on glass slides and visualized using a confocal microscope (FV‐1000; Olympus).
2.9. Cell Counting Kit‐8 assay
Cells were trypsinized and seeded into 96‐well plates (1 × 10³ cells/well). Then, 10 μL Cell Counting Kit‐8 (CCK‐8; Dojindo Laboratories) was added and mixed into each well and incubated for 1 hour at 37°C, and absorbance was measured at 450 nm. Three dependent experiments were repeated. Data were presented as the mean ± SD.
2.10. Colony formation assay
A total of 300 cells/well were trypsinized and cultured on 6‐well plates in medium with 10% FBS containing 5% CO2 for 2 weeks. Then, the cells were fixed with methanol for 30 minutes and stained with 1% crystal violet for 10 minutes. Colonies of more than 50 cells were counted. All experiments were performed in triplicate. Data were presented as the mean ± SD.
2.11. Flow cytometry for the cell cycle and apoptosis assays
In brief, scramble and CD155 knockdown groups cells were harvested by exposure to trypsin/EDTA and centrifuged at 350 g for 5 minutes. Cell precipitates were washed three times with PBS. After fixation with 70% ethanol at 4°C overnight, samples were treated with 5 μL RNase A (10 μg/mL) for 1 hour at room temperature, stained with 10 μL propidium iodide (10 μg/mL) on ice for at least 30 minutes at 4°C and analyzed using the FACSCalibur Flow Cytometer (BD Company). All experiments were performed in triplicate. Data were presented as the mean ± SD.
According to the manufacturer’s protocol, the apoptotic status was analyzed using an Annexin V‐PE/7‐AAD Apoptosis Kit (559763; BD Biosciences). Cells were stained and evaluated for apoptosis by flow. The number of apoptotic cells was analyzed by flow cytometry (BD Biosciences).
2.12. Wound healing assay
Cells were seeded in 12‐well culture plates (5 × 10⁴ cells/well) and cultured for 24 hours. Then scratches were made on the monolayer cells using a sterile P200 pipette tip to mimic the wound process. The cells were washed with PBS and were incubated in DMEM containing 2% FBS. Five different zones of each well were chosen and the digital images were captured continuously (×10) from the same field at 0 and 24 hours after scratching. This wound scratch assay was carried out in triplicate. All experiments were performed three times. Data were presented as the mean ± SD.
2.13. Transwell migration and invasion assays
For migration assay, 5 × 10⁴ cells were allowed to migrate from upper to lower chambers for 14 hours. Then the migration was stopped. The chamber membranes with cells adhering to the lower surface were fixed with cold 4% paraformaldehyde (PFA) for 30 minutes and stained with 0.1% crystal violet for 30 minutes, followed by washing three times with PBS and mounting on glass slides. A representative percentage of migrated cells was used as cell migration index. The numbers of migration cells were counted to determine the index of cell migration.
For the invasion assay, 8 × 10⁴ cells were trypsinized and seeded in the upper chamber covered with Matrigel. After incubation for 24 hours, the non–invasive cells on the surface of the membranes were gently removed and the migrated cells on the lower side of the filters were fixed with cold 4% PFA and stained with 0.1% crystal violet. A representative percentage of migrated cells was used as cell invasion index. All experiments were performed in triplicate. Data were presented as the mean ± SD.
2.14. Xenograft metastasis model of triple‐negative breast cancer
Male BALB/c nude mice (5‐ to 6‐week‐old, weighting 20‐22 g) were obtained from Weitong Lihua and all animal experiments were performed according to the Guide for the Care and Use of Laboratory Animals (Ministry of Science and Technology of China, 2006), and were approved by the animal ethics committee of China Medical University. For cell metastasis analysis, 2 × 10⁵ 4T1‐scramble cells or 4T1‐shCD155 cells were washed in serum‐free DMEM and injected intravenously into mice (N = 6) to study lung metastasis. After 8 weeks, mice were killed and metastatic nodules were counted visually. Lungs were embedded in paraffin and cut into 4‐μm sections and stained with H&E. In addition, lung sections were analyzed by immunohistochemistry and TUNEL staining assay.
2.15. TUNEL staining
Tumor tissue sections were dehydrated in various concentrations of ethanol. To block endogenous peroxidase activity, the tumor samples were incubated with 3% hydrogen peroxide for 10 minutes at room temperature. The sections were then incubated with Proteinase K (Gibco BRL) in 20 μg/mL of 10 mmol/L Tris/HCl (pH 8) for 10 minutes at room temperature. Apoptotic cells were determined by the TUNEL Apoptosis Detection Kit S7110 (Millipore) according to the provided protocol. After washing with PBS, tumor samples were counterstained with DAPI. The TUNNEL positive labeled apoptotic cells were calculated and photographed using an Olympus BX61 fluorescence microscope. The number of apoptotic cells was counted in a total of 1000 cells by Image J software.
2.16. Statistical analysis
All experiments were obtained at least in three replicates. In addition, assays producing quantitative data were run in triplicate. SPSS 19.0 software (SPSS) was used. Statistical significance was determined by ANOVA or two‐tailed Student’s t test. The survival plot was generated by GEPIA and the log‐rank test was used for comparison of survival curves. *P < 0.05 was considered to indicate a statistically significant difference.
3. RESULTS
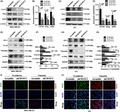
3.1. CD155 is preferentially expressed in triple‐negative breast cancer
TCGA and Curtis databases from Oncomine and GEPIA websites were investigated. CD155 mRNA expression was shown to be upregulated in TNBC (Figure 1A and Figure S1A). CD155 mRNA expression in human breast cancer specimens and adjacent non–tumorous tissues were thereafter examined by real‐time PCR. Consistently, TNBC expressed the highest level of CD155 mRNA (Figure 1B). CD155 protein expression was determined by both western blot and immunohistochemistry. These detections confirmed that CD155 protein was overexpressed in TNBC (Figure 1C‐F). Kaplan‐Meier plotter and GEPIA websites were investigated for the correlation of CD155 expression with prognosis. High CD155 expression was associated with shortened overall survival (OS) (Figure 1G and Figure S1B). Finally, GO analysis indicated that CD155 might be involved in signaling pathways related to cell adhesion and survival (Figure S1C‐E).
Figure 1.
CD155 expression is elevated in triple‐negative breast cancer (TNBC) and correlates with poor prognosis. A, CD155 expression was higher in TNBC tissues than in normal breast or non–TNBC tissues from the TCGA dataset (normal N = 244, ERBB2/ER/PR negative N = 49 and other biomarker status N = 300) and Curtis dataset (normal N = 161, ERBB2/ER/PR negative N = 250 and other biomarker status N = 1725). B, Differential mRNA expression of CD155 in adjacent tissues (N = 15), TNBC tissues (N = 17) and non–TNBC tissues (N = 28). C and D, CD155 was highly expressed in TNBC tissues (T) compared with normal tissues (N) detected by western blot. E and F, 45 breast cancer tissues (TNBC, N = 17; non–TNBC, N = 28) and adjacent tissue (N = 15) were assessed by immunohistochemistry (IHC). The level of CD155 was higher in TNBC tissues compared with non–TNBC or normal tissues. Representative images are shown (left scale bar: 100 μm, right scale bar: 50 μm) (*P < 0.05). G, Overall survival curves of patients with or without elevated CD155 levels. Patient data from a study on TNBC in the Kaplan‐Meier plotter database were analyzed
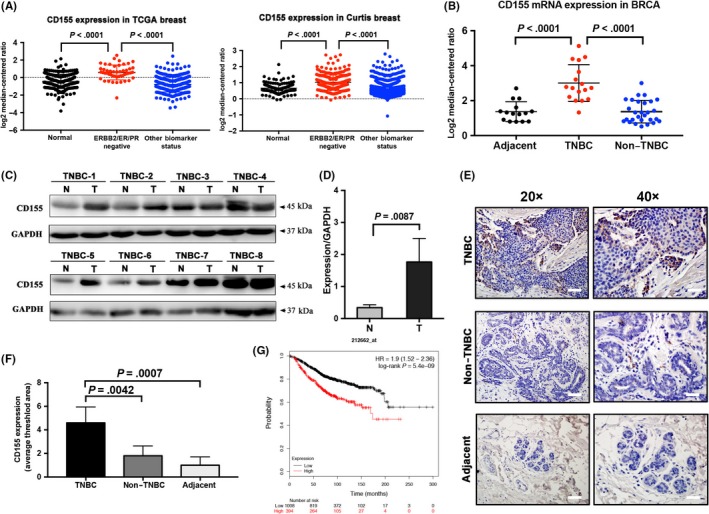
3.2. CD155 is associated with mesenchymal phenotype
CD155 expression was determined in several breast cancer cell lines. Mesenchymal/TNBC cell lines such as MDA‐MB‐231, BT549 and 4T1 expressed higher levels of CD155 than luminal‐type cell lines such as MCF7 and T47D (Figure 2A). The expression pattern of CD155 was similar to that of mesenchymal factors vimentin, Zeb1 and Slug, but differed to that of E‐cadherin (Figure 2B‐D). Using GSEA, we identified a significant enrichment of METASTASIS‐EMT high‐risk genes in the high CD155 group. (Figure 2E and Figure S2A). http://www.ncbi.nlm.nih.gov/geo/query/acc.cgi?acc=GSE12777, CCLE and TCGA databases were finally investigated for the association of CD155 with mesenchymal factors in a series of breast cancer cell lines and TNBC samples. As expected, CD155 was positively correlated with vimentin (VIM), Zeb1 (ZEB1) and Slug (SNAI2) (Figure 2F‐H and Figure S2B‐D).
Figure 2.
CD155 is overexpression in triple‐negative breast cancer (TNBC) cell lines. A, CD155 expression level in breast cancer cell lines (MDA‐MB‐231, MCF7, BT549, T47D and 4T1) was examined by western blot. B and C, The expression of epithelial marker (E‐cad) and mesenchymal markers (vimentin, ZEB1, Slug) was determined by western blot. GAPDH was used as a loading control. (E‐cad, E‐cadherin). D, Epithelial‐to‐mesenchymal transition (EMT) marker expression was detected by immunofluorescence (IF) in MDA‐MB‐231 (TNBC) and MCF7 (non–TNBC) cell lines. E, Enrichment plot showed enrichment of EMT‐metastasis‐related genes in the CD155 high expression group. The red part represents the CD155 low expression group and the blue part represents the CD155 high expression group (two groups were divided by median). The GSEA data showed EMT‐metastasis‐related gene enrichment in CD155 high expression groups. CD155 high expression was correlated with metastasis. F‐H, The correlation between the mRNA level of CD155 and that of EMT markers such as vimentin (VIM), ZEB1 and SNAI2 (Slug) in TNBC cell lines via the http://www.ncbi.nlm.nih.gov/geo/query/acc.cgi?acc=GSE12777 database and TNBC tissues via TCGA. Pearson’s correlations and P‐values were analyzed and are shown
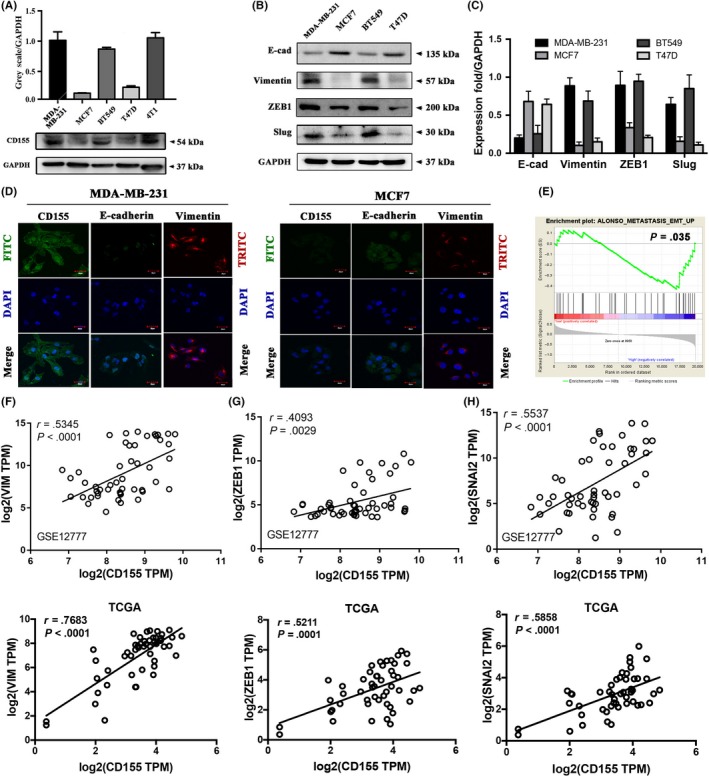
3.3. CD155 knockdown induces mesenchymal‐epithelial transition
CD155 shRNA lentiviruses were used to knockdown CD155 expression in MDA‐MB‐231 and 4T1 cells (Figure 3A‐D). The effect of CD155 knockdown on Slug and Zeb1 expression was then investigated. Both Slug and Zeb1 were significantly downregulated in cells with CD155 shRNA transfection (Figure 3A‐D). CD155 knockdown suppressed expression of mesenchymal markers vimentin, α‐SMA and MMP‐9, whereas stimulated expression of epithelial markers ZO‐1 and E‐cadherin (Figure 3E‐H). Immunofluorescent staining further confirmed that CD155 knockdown upregulated E‐cadherin expression whereas downregulated vimentin expression (Figure 3I,J). Moreover, CD155 knockdown induced a morphologic transition from mesenchymal‐like to epithelial‐like in both MDA‐MB‐231 and 4T1 cells (Figure S3).
Figure 3.
CD155 knockdown promotes mesenchymal‐epithelial transition properties. A‐D, CD155 expression was knockdowned by CD155 shRNA lentiviruses in MDA‐MB‐231 and 4T1 cells. The CD155 levels in these established cell lines were verified by western blot analysis. E‐H, The expression of epithelial marker (ZO‐1, E‐cad) and mesenchymal markers (vimentin, α‐SMA and MMP9) was determined by western blot. GAPDH was used as a loading control. I and J, EMT marker expression was detected by immunofluorescence (IF) in CD155 knockdown MDA‐MB‐231 (TNBC) and MCF7 (non–TNBC) cell lines
3.4. CD155 knockdown suppresses triple‐negative breast cancer cell migration, invasion and metastasis
The potential role of CD155 in TNBC metastasis was explored in vitro and in vivo. Wound healing test revealed that CD155 knockdown inhibited migration of both MDA‐MB‐231 and 4T1 cells (Figure 4A,B). Furthermore, a transwell assay showed that CD155 knockdown suppressed cell invasion (Figure 4C,D). 4T1 cells were injected into mouse tail veins and metastases in the lungs were observed. Consistent with in vitro results, CD155 knockdown significantly blocked lung metastasis of 4T1 cells (Figure 4E‐G). Together, these findings indicate that CD155 contributes to TNBC cell EMT and metastasis.
Figure 4.
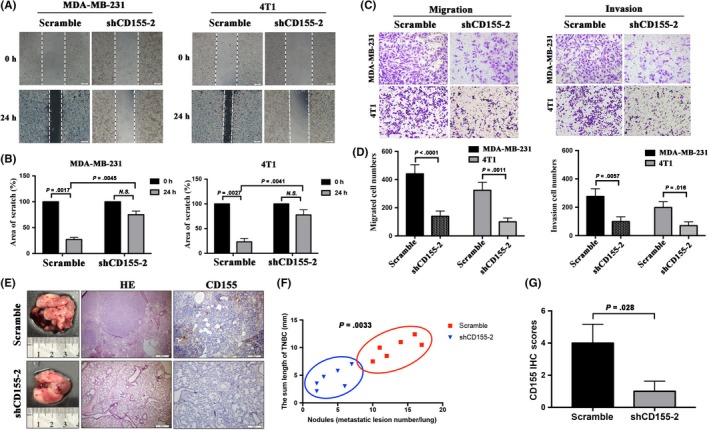
CD155 knockdown affects cellular invasion and metastasis in vitro and in vivo. A and B, Wound healing assay was performed to determine the effects of CD155 knockdown on triple‐negative breast cancer (TNBC) cell motility. Bars represent the average percentage of scratch area remained (%) by each cell line. C and D, Results of a transwell migration assay and a Matrigel Invasion assay for cellular invasion. The mean number of cells in five fields per membrane is shown. E‐G, Images of gross and H&E staining and the numbers and length of lung surface metastatic nodules detected in each group. immunohistochemistry (IHC) staining score analysis of CD155 in xenograft tumors (H&E Scale Bar: 500 μm, IHC Scale Bar: 200 μm)
3.5. CD155 cross‐talks with IL‐6/Stat3 and TGF‐β/Smad3 pathways
To investigate the molecular mechanisms underlying CD155‐induced EMT and metastasis, http://www.ncbi.nlm.nih.gov/geo/query/acc.cgi?acc=GSE12777, CCLE and TCGA were investigated for the association of CD155 with EMT‐related signaling pathways. CD155 was shown to be positively correlated with IL‐6, TGF‐β and Smad3 in these databases (Figure 5A‐C and Figure S4A‐C). GSEA analysis also indicated that CD155 was associated with IL‐6 and TGF‐β pathways (Figure S4D,E). To verify whether CD155 cross‐talked with these two pathways, CD155 expression was downregulated in MDA‐MB‐231 and 4T1 cells by CD155 shRNA transfection. As expected, CD155 knockdown reduced IL‐6, TGF‐β and Smad3 expression, and inhibited Stat3 phosphorylation (Figure 5D‐G). These findings suggest that CD155 contributes EMT and metastasis by cross‐talking with IL‐6/Stat3 and TGF‐β/Smad3 pathways.
Figure 5.
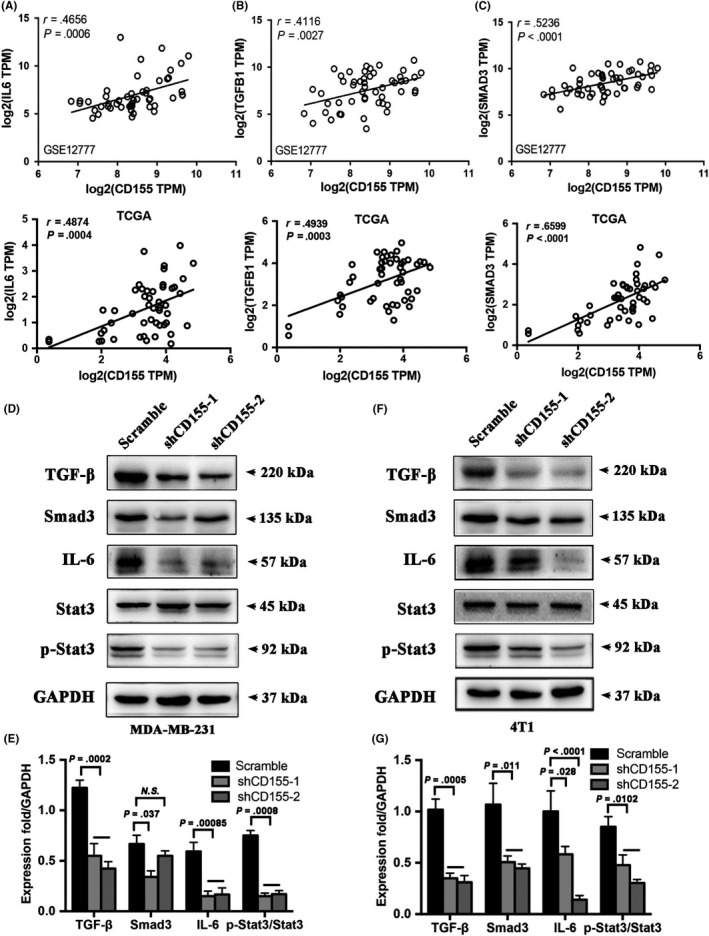
CD155 cross‐talks with IL‐6/Stat3 and TGF‐β/Smad3 pathways. A‐C, The correlation between the mRNA level of CD155 and that of different pathways such as IL6 (IL‐6), TGFB1 (TGF‐β) and SMAD3 in triple‐negative breast cancer (TNBC) cell lines via the http://www.ncbi.nlm.nih.gov/geo/query/acc.cgi?acc=GSE12777 database and TNBC tissues via TCGA. D‐G, Western blot analysis was carried out to detect the expression levels of TGF‐β, Smad3, IL‐6, Stat3, p‐Stat3 in scramble or CD155 knockdown MDA‐MB‐231 and 4T1 cell lines. GAPDH was used as a loading control. Quantitative graphs represent the ratio of phosphorylated‐/total‐proteins
3.6. CD155 knockdown suppresses breast cancer growth and survival
The role of CD155 in TNBC cell growth and survival was finally evaluated. CCK‐8 test showed that CD155 knockdown inhibited the viability of MDA‐MB‐231 and 4T1 cells (Figure 6A). Clone formation tests confirmed the inhibitory effect of CD155 knockdown on the growth of these cells (Figure 6B,C). Furthermore, flow cytometry indicated that CD155 knockdown enhanced the apoptosis of these cells (Figure 6D,E). Consistently, CD155 knockdown increased cleaved caspase‐3 expression (Figure 6F‐H). The effect of CD155 knockdown on TNBC cell apoptosis was also assessed in vivo. TUNEL staining revealed that tumor tissues derived from 4T1 cells with CD155 shRNA transfection harbored more apoptotic cells than those from 4T1 cells with control transfection (Figure S5A,B).
Figure 6.
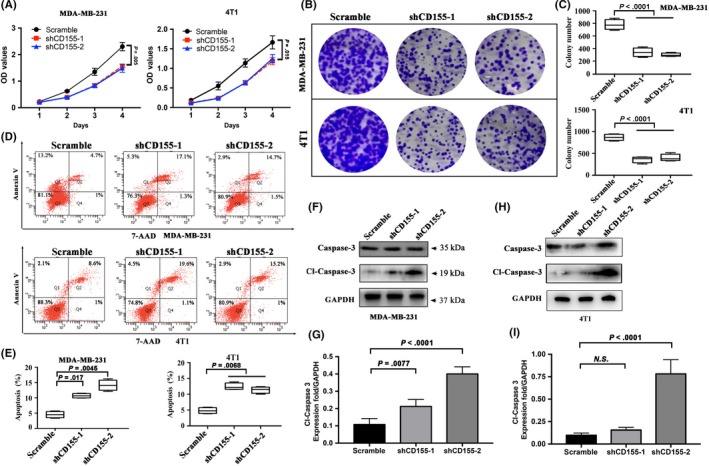
CD155 knockdown suppresses breast cancer progression. A, Cell viability rates were measured using CCK‐8 assays in MDA‐MB‐231 and 4T1 cell lines. B and C, A colony formation assay was carried out to determine the stem‐like effect of CD155 knockdown on MDA‐MB‐231 and 4T1 cell lines. The colonies were counted and captured. Representative photographs are shown at the original magnification. D and E, Early and late apoptosis assays with Annexin V/7‐AAD staining were performed with flow cytometry in MDA‐MB‐231 and 4T1 cell lines. The percentages of apoptosis cell populations have been quantified. F‐I, The expression levels of Caspase‐3 and Cleaved‐Caspase‐3 were detected by western blot in MDA‐MB‐231 and 4T1 cell lines. GAPDH was used as the loading control
4. DISCUSSION
CD155 is rarely expressed in most normal tissues. However, some human cancers such as colon cancer, pancreatic cancer and lung cancer harbor CD155 overexpression.21, 31, 32, 33 Our study showed that CD155 was overexpressed in TNBC, but not in other subtypes. As TNBC patients usually have a poor outcome, we supposed that CD155 overexpression might be associated with an aggressive phenotype. Just as expected, in combination with in silico analysis, we found that CD155 was positively correlated with some mesenchymal markers. Furthermore, CD155 knockdown induced a reverse process of EMT in mesenchymal‐like breast cancer cells. These findings indicate that CD155 is involved in the maintenance of breast cancer mesenchymal phenotype.
Mechanistically, EMT is driven by some EMT‐TF. Our study revealed that CD155 modulated Zeb1 and Slug, but had no effect on Twist1 and Snail (data not shown). Studies demonstrated that both Zeb1 and Slug played crucial roles in breast cancer cell EMT.13, 34, 35, 36 Moreover, Zeb1 and Slug were shown to induce TNBC metastasis.37, 38 Our study further indicated that CD155 knockdown induced mesenchymal‐epithelial transition, accompanied by decreased in vitro cell motility and in vivo metastasis. Together, these data suggest that Zeb1 and Slug are involved in the aggressive phenotype of CD155‐associated TNBC.
We explored the molecular mechanisms underlying CD155‐induced EMT and metastasis. The IL‐6/Stat3 pathway was identified to cross‐talk with CD155 in TNBC cells. IL‐6 was involved in TNBC cell growth, survival, migration, metastasis and stemness.39, 40, 41, 42, 43 As a downstream intracellular molecule of IL‐6, Stat3 was also overactivated in TNBC, and associated with the aggressive phenotype.44, 45 Targeting IL‐6/Stat3 was demonstrated to suppress breast cancer growth and metastasis in mouse xenograft models.39, 44, 46 Consistently, our study showed that CD155 knockdown impaired not only TNBC cell metastasis but also growth and survival.
Our study revealed that CD155 knockdown significantly weakened TGF‐β expression, indicating that CD155 also cross‐talked with TGF‐β signaling. In TNBC, TGF‐β was shown to induce EMT and metastasis.47, 48, 49 Smad family members such as Smad2, Smad3 and Smad4 mediated these processes.48, 50, 51 Our in silico analysis showed that CD155 was positively correlated with TGF‐β and Smad3 but not Smad2 and Smad4. CD155 knockdown reduced Smad3 expression, further demonstrating Smad3 to be a downstream effector molecule of CD155 in TNBC.
The mechanism underlying CD155 overexpression in TNBC is unclear. Reactive oxygen species (ROS) and reactive nitrogen species (RNS) were shown to stimulate CD155 expression.52, 53 In fact, TNBC overproduced ROS, which promoted TNBC cell stemness, chemoresistance and metastasis.54, 55 Moreover, Ras/MAPK signaling was shown to be involved in CD155 overexpression.17 Activation of Ras due to the loss of its negative regulators was a common event in TNBC.56 Suppression of Ras/MAPK signaling inhibited TNBC cell EMT and metastasis.57
In summary, our study demonstrates for the first time that CD155 is overexpressed in TNBC, which contributes to the aggressive phenotype. Mechanistically, IL‐6/Stat3 and TGF‐β/Smad3 pathways may be involved in CD155‐associated TNBC cell EMT and metastasis. Suppression of cell motility and metastasis by CD155 knockdown suggests that CD155 is a potential molecular target for TNBC.
DISCLOSURE
There is no conflict of interest.
Supporting information
ACKNOWLEDGEMENTS
This study was supported by the Department of Science and Technology of Liaoning Province (2017225028), the Educational Department of Liaoning Province (QN2019022) and the Youth Talent Support Foundation of China Medical University (QGZ2018080).
Zheng Q, Gao J, Yin P, et al. CD155 contributes to the mesenchymal phenotype of triple‐negative breast cancer. Cancer Sci. 2020;111:383–394. 10.1111/cas.14276
REFERENCES
- 1. Bianchini G, Balko JM, Mayer IA, Sanders ME, Gianni L. Triple‐negative breast cancer: challenges and opportunities of a heterogeneous disease. Nat Rev Clin Oncol. 2016;13:674‐690. [DOI] [PMC free article] [PubMed] [Google Scholar]
- 2. Jitariu AA, Cimpean AM, Ribatti D, Raica M. Triple negative breast cancer: the kiss of death. Oncotarget. 2017;8:46652‐46662. [DOI] [PMC free article] [PubMed] [Google Scholar]
- 3. Denkert C, Liedtke C, Tutt A, von Minckwitz G. Molecular alterations in triple‐negative breast cancer‐the road to new treatment strategies. Lancet. 2017;389:2430‐2442. [DOI] [PubMed] [Google Scholar]
- 4. Lehmann BD, Bauer JA, Chen XI, et al. Identification of human triple‐negative breast cancer subtypes and preclinical models for selection of targeted therapies. J Clin Invest. 2011;121:2750‐2767. [DOI] [PMC free article] [PubMed] [Google Scholar]
- 5. Sullivan NJ, Sasser AK, Axel AE, et al. Interleukin‐6 induces an epithelial‐mesenchymal transition phenotype in human breast cancer cells. Oncogene. 2009;28:2940‐2947. [DOI] [PMC free article] [PubMed] [Google Scholar]
- 6. Zhao D, Besser AH, Wander SA, et al. Cytoplasmic p27 promotes epithelial‐mesenchymal transition and tumor metastasis via STAT3‐mediated Twist1 upregulation. Oncogene. 2015;34:5447‐5459. [DOI] [PMC free article] [PubMed] [Google Scholar]
- 7. Balanis N, Wendt MK, Schiemann BJ, Wang Z, Schiemann WP, Carlin CR. Epithelial to mesenchymal transition promotes breast cancer progression via a fibronectin‐dependent STAT3 signaling pathway. J Biol Chem. 2013;288:17954‐17967. [DOI] [PMC free article] [PubMed] [Google Scholar]
- 8. Yu Y, Luo W, Yang ZJ, et al. miR‐190 suppresses breast cancer metastasis by regulation of TGF‐beta‐induced epithelial‐mesenchymal transition. Mol Cancer. 2018;17:70. [DOI] [PMC free article] [PubMed] [Google Scholar]
- 9. Tang X, Shi L, Xie N, et al. SIRT7 antagonizes TGF‐beta signaling and inhibits breast cancer metastasis. Nat Commun. 2017;8:318. [DOI] [PMC free article] [PubMed] [Google Scholar]
- 10. Fenizia C, Bottino C, Corbetta S, et al. SMYD3 promotes the epithelial‐mesenchymal transition in breast cancer. Nucleic Acids Res. 2019;47:1278‐1293. [DOI] [PMC free article] [PubMed] [Google Scholar]
- 11. Gujral TS, Chan M, Peshkin L, Sorger PK, Kirschner MW, MacBeath G. A noncanonical Frizzled2 pathway regulates epithelial‐mesenchymal transition and metastasis. Cell. 2014;159:844‐856. [DOI] [PMC free article] [PubMed] [Google Scholar]
- 12. Cai J, Guan H, Fang L, et al. MicroRNA‐374a activates Wnt/beta‐catenin signaling to promote breast cancer metastasis. J Clin Invest. 2013;123:566‐579. [DOI] [PMC free article] [PubMed] [Google Scholar]
- 13. Shao S, Zhao X, Zhang X, et al. Notch1 signaling regulates the epithelial‐mesenchymal transition and invasion of breast cancer in a Slug‐dependent manner. Mol Cancer. 2015;14:28. [DOI] [PMC free article] [PubMed] [Google Scholar]
- 14. Leontovich AA, Jalalirad M, Salisbury JL, et al. NOTCH3 expression is linked to breast cancer seeding and distant metastasis. Breast Cancer Res. 2018;20:105. [DOI] [PMC free article] [PubMed] [Google Scholar]
- 15. Mendelsohn CL, Wimmer E, Racaniello VR. Cellular receptor for poliovirus: molecular cloning, nucleotide sequence, and expression of a new member of the immunoglobulin superfamily. Cell. 1989;56:855‐865. [DOI] [PubMed] [Google Scholar]
- 16. Mueller S, Wimmer E. Recruitment of nectin‐3 to cell‐cell junctions through trans‐heterophilic interaction with CD155, a vitronectin and poliovirus receptor that localizes to alpha(v)beta3 integrin‐containing membrane microdomains. J Biol Chem. 2003;278:31251‐31260. [DOI] [PubMed] [Google Scholar]
- 17. Ikeda W, Kakunaga S, Itoh S, et al. Tage4/Nectin‐like molecule‐5 heterophilically trans‐interacts with cell adhesion molecule Nectin‐3 and enhances cell migration. J Biol Chem. 2003;278:28167‐28172. [DOI] [PubMed] [Google Scholar]
- 18. Gao J, Zheng Q, Xin N, Wang W, Zhao C. CD155, an onco‐immunologic molecule in human tumors. Cancer Sci. 2017;108:1934‐1938. [DOI] [PMC free article] [PubMed] [Google Scholar]
- 19. Ikeda W, Kakunaga S, Takekuni K, et al. Nectin‐like molecule‐5/Tage4 enhances cell migration in an integrin‐dependent, Nectin‐3‐independent manner. J Biol Chem. 2004;279:18015‐18025. [DOI] [PubMed] [Google Scholar]
- 20. Kakunaga S, Ikeda W, Shingai T, et al. Enhancement of serum‐ and platelet‐derived growth factor‐induced cell proliferation by Necl‐5/Tage4/poliovirus receptor/CD155 through the Ras‐Raf‐MEK‐ERK signaling. J Biol Chem. 2004;279:36419‐36425. [DOI] [PubMed] [Google Scholar]
- 21. Zheng Q, Wang B, Gao J, et al. CD155 knockdown promotes apoptosis via AKT/Bcl‐2/Bax in colon cancer cells. J Cell Mol Med. 2018;22:131‐140. [DOI] [PMC free article] [PubMed] [Google Scholar]
- 22. Gao J, Zheng Q, Shao Y, Wang W, Zhao C. CD155 downregulation synergizes with adriamycin to induce breast cancer cell apoptosis. Apoptosis. 2018;23:512‐520. [DOI] [PMC free article] [PubMed] [Google Scholar]
- 23. Curtis C, Shah SP, Chin S‐F, et al. The genomic and transcriptomic architecture of 2,000 breast tumours reveals novel subgroups. Nature. 2012;486:346‐352. [DOI] [PMC free article] [PubMed] [Google Scholar]
- 24. Tang Z, Li C, Kang B, Gao G, Li C, Zhang Z. GEPIA: a web server for cancer and normal gene expression profiling and interactive analyses. Nucleic Acids Res. 2017;45:W98‐W102. [DOI] [PMC free article] [PubMed] [Google Scholar]
- 25. Nagy A, Lanczky A, Menyhart O, Gyorffy B. Validation of miRNA prognostic power in hepatocellular carcinoma using expression data of independent datasets. Sci Rep. 2018;8:9227. [DOI] [PMC free article] [PubMed] [Google Scholar]
- 26. Stinson S, Lackner MR, Adai AT, et al. TRPS1 targeting by miR‐221/222 promotes the epithelial‐to‐mesenchymal transition in breast cancer. Sci Signal. 2011;4:ra41. [DOI] [PubMed] [Google Scholar]
- 27. da Huang W, Sherman BT, Lempicki RA. Systematic and integrative analysis of large gene lists using DAVID bioinformatics resources. Nat Protoc. 2009;4:44‐57. [DOI] [PubMed] [Google Scholar]
- 28. Ashburner M, Ball CA, Blake JA, et al. Gene ontology: tool for the unification of biology. The Gene Ontology Consortium. Nat Genet. 2000;25:25‐29. [DOI] [PMC free article] [PubMed] [Google Scholar]
- 29. Subramanian A, Kuehn H, Gould J, Tamayo P, Mesirov JP. GSEA‐P: a desktop application for gene set enrichment analysis. Bioinformatics. 2007;23:3251‐3253. [DOI] [PubMed] [Google Scholar]
- 30. Fedchenko N, Reifenrath J. Different approaches for interpretation and reporting of immunohistochemistry analysis results in the bone tissue – a review. Diagn Pathol. 2014;9:221. [DOI] [PMC free article] [PubMed] [Google Scholar]
- 31. Masson D, Jarry A, Baury B, et al. Overexpression of the CD155 gene in human colorectal carcinoma. Gut. 2001;49:236‐240. [DOI] [PMC free article] [PubMed] [Google Scholar]
- 32. Nishiwada S, Sho M, Yasuda S, et al. Clinical significance of CD155 expression in human pancreatic cancer. Anticancer Res. 2015;35:2287‐2297. [PubMed] [Google Scholar]
- 33. Nakai R, Maniwa Y, Tanaka Y, et al. Overexpression of Necl‐5 correlates with unfavorable prognosis in patients with lung adenocarcinoma. Cancer Sci. 2010;101:1326‐1330. [DOI] [PMC free article] [PubMed] [Google Scholar]
- 34. Shao P, Liu QI, Maina PK, et al. Histone demethylase PHF8 promotes epithelial to mesenchymal transition and breast tumorigenesis. Nucleic Acids Res. 2017;45:1687‐1702. [DOI] [PMC free article] [PubMed] [Google Scholar]
- 35. Hou P, Li L, Chen F, et al. PTBP3‐mediated regulation of ZEB1 mRNA stability promotes epithelial‐mesenchymal transition in breast cancer. Cancer Res. 2018;78:387‐398. [DOI] [PubMed] [Google Scholar]
- 36. Dang TT, Esparza MA, Maine EA, Westcott JM, Pearson GW. DeltaNp63alpha promotes breast cancer cell motility through the selective activation of components of the epithelial‐to‐mesenchymal transition program. Cancer Res. 2015;75:3925‐3935. [DOI] [PMC free article] [PubMed] [Google Scholar]
- 37. Wang P‐S, Chou C‐H, Lin C‐H, et al. A novel long non–coding RNA linc‐ZNF469‐3 promotes lung metastasis through miR‐574‐5p‐ZEB1 axis in triple negative breast cancer. Oncogene. 2018;37:4662‐4678. [DOI] [PubMed] [Google Scholar]
- 38. Bailey CK, Mittal MK, Misra S, Chaudhuri G. High motility of triple‐negative breast cancer cells is due to repression of plakoglobin gene by metastasis modulator protein SLUG. J Biol Chem. 2012;287:19472‐19486. [DOI] [PMC free article] [PubMed] [Google Scholar]
- 39. Hartman ZC, Poage GM, den Hollander P, et al. Growth of triple‐negative breast cancer cells relies upon coordinate autocrine expression of the proinflammatory cytokines IL‐6 and IL‐8. Cancer Res. 2013;73:3470‐3480. [DOI] [PMC free article] [PubMed] [Google Scholar]
- 40. Barbie TU, Alexe G, Aref AR, et al. Targeting an IKBKE cytokine network impairs triple‐negative breast cancer growth. J Clin Invest. 2014;124:5411‐5423. [DOI] [PMC free article] [PubMed] [Google Scholar]
- 41. Liang S, Chen Z, Jiang G, et al. Activation of GPER suppresses migration and angiogenesis of triple negative breast cancer via inhibition of NF‐kappaB/IL‐6 signals. Cancer Lett. 2017;386:12‐23. [DOI] [PubMed] [Google Scholar]
- 42. Jin K, Pandey NB, Popel AS. Simultaneous blockade of IL‐6 and CCL5 signaling for synergistic inhibition of triple‐negative breast cancer growth and metastasis. Breast Cancer Res. 2018;20:54. [DOI] [PMC free article] [PubMed] [Google Scholar]
- 43. Weng Y‐S, Tseng H‐Y, Chen Y‐A, et al. MCT‐1/miR‐34a/IL‐6/IL‐6R signaling axis promotes EMT progression, cancer stemness and M2 macrophage polarization in triple‐negative breast cancer. Mol Cancer. 2019;18:42. [DOI] [PMC free article] [PubMed] [Google Scholar]
- 44. Qin JJ, Yan L, Zhang J, Zhang WD. STAT3 as a potential therapeutic target in triple negative breast cancer: a systematic review. J Exp Clin Cancer Res. 2019;38:195. [DOI] [PMC free article] [PubMed] [Google Scholar]
- 45. Moreira MP, da Conceicao BL, Cassali GD, Silva LM. STAT3 as a promising chemoresistance biomarker associated with the CD44(+/high)/CD24(‐/low)/ALDH(+) BCSCs‐like subset of the triple‐negative breast cancer (TNBC) cell line. Exp Cell Res. 2018;363:283‐290. [DOI] [PubMed] [Google Scholar]
- 46. Kim G, Ouzounova M, Quraishi AA, et al. SOCS3‐mediated regulation of inflammatory cytokines in PTEN and p53 inactivated triple negative breast cancer model. Oncogene. 2015;34:671‐680. [DOI] [PMC free article] [PubMed] [Google Scholar]
- 47. Jiang HL, Sun HF, Gao SP, et al. SSBP1 suppresses TGFbeta‐driven epithelial‐to‐mesenchymal transition and metastasis in triple‐negative breast cancer by regulating mitochondrial retrograde signaling. Cancer Res. 2016;76:952‐964. [DOI] [PubMed] [Google Scholar]
- 48. Wahdan‐Alaswad R, Harrell JC, Fan Z, Edgerton SM, Liu B, Thor AD. Metformin attenuates transforming growth factor beta (TGF‐beta) mediated oncogenesis in mesenchymal stem‐like/claudin‐low triple negative breast cancer. Cell Cycle. 2016;15:1046‐1059. [DOI] [PMC free article] [PubMed] [Google Scholar]
- 49. Bassey‐Archibong BI, Kwiecien JM, Milosavljevic SB, et al. Kaiso depletion attenuates transforming growth factor‐beta signaling and metastatic activity of triple‐negative breast cancer cells. Oncogenesis. 2016;5:e208. [DOI] [PMC free article] [PubMed] [Google Scholar]
- 50. Thomas AL, Lind H, Hong A, et al. Inhibition of CDK‐mediated Smad3 phosphorylation reduces the Pin1‐Smad3 interaction and aggressiveness of triple negative breast cancer cells. Cell Cycle. 2017;16:1453‐1464. [DOI] [PMC free article] [PubMed] [Google Scholar]
- 51. Bhola NE, Balko JM, Dugger TC, et al. TGF‐beta inhibition enhances chemotherapy action against triple‐negative breast cancer. J Clin Invest. 2013;123:1348‐1358. [DOI] [PMC free article] [PubMed] [Google Scholar]
- 52. Fionda C, Abruzzese MP, Zingoni A, et al. Nitric oxide donors increase PVR/CD155 DNAM‐1 ligand expression in multiple myeloma cells: role of DNA damage response activation. BMC Cancer. 2015;15:17. [DOI] [PMC free article] [PubMed] [Google Scholar]
- 53. Ardolino M, Zingoni A, Cerboni C, et al. DNAM‐1 ligand expression on Ag‐stimulated T lymphocytes is mediated by ROS‐dependent activation of DNA‐damage response: relevance for NK‐T cell interaction. Blood. 2011;117:4778‐4786. [DOI] [PubMed] [Google Scholar]
- 54. Lee KM, Giltnane JM, Balko JM, et al. MYC and MCL1 cooperatively promote chemotherapy‐resistant breast cancer stem cells via regulation of mitochondrial oxidative phosphorylation. Cell Metab. 2017;26:633‐647 e7. [DOI] [PMC free article] [PubMed] [Google Scholar]
- 55. Chourasia AH, Tracy K, Frankenberger C, et al. Mitophagy defects arising from BNip3 loss promote mammary tumor progression to metastasis. EMBO Rep. 2015;16:1145‐1163. [DOI] [PMC free article] [PubMed] [Google Scholar]
- 56. Suarez‐Cabrera C, Quintana RM, Bravo A, et al. A transposon‐based analysis reveals RASA1 is involved in triple‐negative breast cancer. Cancer Res. 2017;77:1357‐1368. [DOI] [PubMed] [Google Scholar]
- 57. Okada T, Sinha S, Esposito I, et al. The Rho GTPase Rnd1 suppresses mammary tumorigenesis and EMT by restraining Ras‐MAPK signalling. Nat Cell Biol. 2015;17:81‐94. [DOI] [PMC free article] [PubMed] [Google Scholar]
Associated Data
This section collects any data citations, data availability statements, or supplementary materials included in this article.
Supplementary Materials