Abstract
ATP6L, the C subunit of the V‐ATPase V0 domain, is involved in regulating the acidic tumor micro‐environment and may promote tumor progression. However, the expression and functional role of ATP6L in tumors have not yet been well explored. In this study, we found that ATP6L protein overexpression was related to colorectal cancer histological differentiation (P < 0.001), presence of metastasis (P < 0.001) and recurrence (P = 0.02). ATP6L expression in the liver metastatic foci was higher than in the primary foci (P = 0.04). ATP6L expression was notably concomitant with epithelial‐mesenchymal transition (EMT) immunohistochemical features, such as reduced expression of the epithelial marker E‐cadherin (P = 0.021) and increased expression of the mesenchymal marker vimentin (P = 0.004). Results of in vitro and in vivo experiments showed that ATP6L expression could alter cell morphology, regulate EMT‐associated protein expression, and enhance migration and invasion. The effect of ATP6L on metastasis was further demonstrated in a tail vein injection mice model. In addition, the mouse xenograft model showed that ATP6L‐overexpressing HCT116 cells grew into larger tumor masses, showed less necrosis and formed more micro‐vessels than the control cells. Taken together, our results suggest that ATP6L promotes metastasis of colorectal cancer by inducing EMT and angiogenesis, and is a potential target for tumor therapy.
Keywords: angiogenesis, ATP6L, colorectal cancer, epithelial‐mesenchymal transition, metastasis
ATP6L is markedly overexpressed in the poorly differentiated colorectal cancer tissues evidently located in the invasive front and metastatic foci. More importantly, in vitro and in vivo data demonstrated that ATP6L can induce the EMT program in CRC cells. Ectopic ATP6L expression can promote microvessel density in animal xenograft tissue.
1. INTRODUCTION
Colorectal carcinoma (CRC) is the third most common cancer worldwide.1 The incidence and mortality rate of CRC are rapidly increasing, especially in developing countries.2 According to 2015 cancer statistics, the incidence of CRC will increase by 60% by 2030.1 Despite the overall increase in the survival of CRC patients due to chemotherapy and targeted therapy over the past two decades, metastasis remains the major obstacle in CRC treatment and prognosis.2, 3
Paget first proposed the “seed and soil” theory, emphasizing the importance of the tumor microenvironment (TME) with hypoxia, elevated interstitial fluid pressure, low glucose level and acidic extracellular pH.4, 5 Extensive evidence has shown that the interaction between tumor cells and TME contributes to the malignant progression of tumor cells; therefore, studies on the molecular mechanisms underlying TME may help people to develop more effective treatment modalities.6 One of the hallmarks of TME is the existence of an unusual acidic microenvironment. Most malignant lesions produce energy by glycolysis at a vastly higher rate than normal tissues even in oxygenated environments; this process is known as the Warburg effect.7 Coupled with abnormal blood perfusion, the infinite proliferation cycle of cancer cells sharply increases oxygen consumption and leads to the accumulation of lactic acid, the product of glycolysis, thereby creating a high acid load in tumor tissues.7 Acidic gradients are toxic to normal cells because cellular acidosis is a trigger for apoptosis.8 In contrast, low extracellular pH confers multiple advantages to the process of tumorigenesis and metastasis by promoting cancer cell proliferation, degrading the extracellular matrix, suppressing the host immune system and promoting angiogenesis.8, 9, 10 Clinical investigations have shown that acidic environments are associated with increased mutation rate, enhanced metastatic incidence and poor prognosis of patients with malignant tumors.11, 12 In addition, anticancer agents are usually sensitive to pH alteration. Acidic environments may reduce the uptake and cytotoxicity of anticancer agents, further aiding tumor chemoresistance.13 To stay alive, cancer cells must pump excess protons into the extracellular environment and maintain a relatively neutral intracellular pH. Vacuolar H+‐ATPase (V‐ATPase) uses the energy produced by ATP hydrolysis to pump protons into the lumina of acidic vacuoles or to the extracellular environment.14 Accumulating clinical evidence has revealed that V‐ATPase is overexpressed in various types of cancers, including melanoma, prostate, breast and pancreatic cancer cells.15, 16, 17, 18 V‐ATPase has been implicated in many aspects of tumor development, particularly in the proliferation, resistance to apoptosis and senescence of cancer stem cells (CSC) and invasion and metastasis.14 ATP6L, the C subunit of the V‐ATPase V0 domain, presents in multiple copies per V‐ATPase, making it the most critical subunit of V‐ATPase.19 This subunit is highly hydrophobic and responsible for transmembrane proton transport.14 ATP6L expression is markedly increased in pancreatic cancer and hepatocellular carcinoma.15, 20 However, the expression and functional role of ATP6L in other types of cancer is still poorly understood.
In this study, the clinicopathological significance of ATP6L and the correlation between ATP6L expression and EMT immunohistochemical features were analyzed in tissue specimens from 193 colorectal cancer patients. The expression of ATP6L was also detected in 20 sets of matched CRC primary foci and liver metastatic foci. The effects of ATP6L expression in HT29 and HCT116 cells on the expression of epithelial and mesenchymal markers and EMT transcription factors were detected. The proliferation, migration and invasion in cell cultures and a mouse xenograft model with ATP6L overexpression were investigated. A tail vein injection mice model was established to investigate metastasis promoting effect of ATP6L. In addition, the effects of the ectopic expression of ATP6L in colorectal cancer cell line HCT116 on the EMT‐associated proteins and angiogenesis in an animal xenograft model were studied.
2. MATERIALS AND METHODS
2.1. Clinical samples
We collected 193 formalin‐fixed, paraffin‐embedded colorectal cancer tissue samples and 20 sets of matched CRC primary foci and liver metastatic foci from Tianjin Medical University Cancer Institute and Hospital (Tianjin, China) from January 2002 to December 2004. None of the patients had received any chemotherapy or radiotherapy before their operation. Data of clinicopathological parameters were obtained from patients’ clinical records and pathological reports. All the samples underwent a uniform protocol for fixation/dissection. All sections were evaluated by two senior pathologists. The use of the tissue samples in this study was approved by the Institutional Research Committee.
2.2. Cell culture reagents and animals
The human colorectal cancer cell lines HCT116 and HT29 were obtained from the Cell Resource Center at the Institute of Basic Medical Sciences, Chinese Academy of Medical Sciences/Peking Union Medical College (Beijing, China). HCT116 cell lines were cultured in Iscove modified Dulbecco medium with 10% FBS. HT29 cells were cultured in DMEM with 5% FBS. Both cell lines were cultured at 37°C in 5% CO2 incubator. ATP6L recombinant protein was obtained from R&D Systems. The micro‐Boyden chambers used were from NeuroProbe. Antibodies to ATP6L, Snail, Slug and Twist were from Abcam. The antibody to E‐cadharin was from BD Biosciences. The antibody to vimentin was from Epitomics. Phalloidin was from Invitrogen. The antibody to CD34 was from Santa Cruz Biotechnology. Alexa Fluor 488 was from Molecular Probes. BALB/C nude mice (4‐5 weeks old) were obtained from Wei Tong Li Hua Experimental Animal Company.
2.3. Immunohistochemical staining
Streptavidin‐biotin‐peroxidase staining was performed as previously described.21 In a typical procedure, the sections were pretreated with microwaves, blocked and incubated with a series of antibodies overnight at 4°C. Then, they were immunostained with HRP‐conjugated antibody and signals were revealed, with 3,3‐diaminobenzidine buffer used as substrate. In place of primary antibodies for the negative control, PBS was used.
The expression of ATP6L, E‐cadherin and vimentin was analyzed only histologically in normal and neoplastic epithelial cells and not in stromal tissues. ATP6L staining was considered immunoreactive when brown granules were identified in the cytoplasm. The staining intensity of ATP6L was graded on a scale from 0 to 2 (0 for no staining, 1 for weak immunoreactivity and 2 for strong immunoreactivity). Percentage immunoreactivity was scored on a scale from 0 to 3 (0 for <10% of cells being positive, 1 for <30% of cells being positive, 2 for 30%–60% of cells being positive and 3 for >50% of cells being positive). We multiplied the two scores to obtain a composite ATP6L expression score. ATP6L expression was classified as negative (−) (score = 0), weakly positive (+) score = (1, 2, or 3) or strongly positive (++) (score = 4, 5 or 6). E‐cadherin expression was considered to be positive if >90% of cancer cells exhibited a staining pattern similar to that in normal epithelial cells. Vimentin expression was classified as positive when >10% tumor cells were stained.
2.4. Plasmid transfection
Transfection with plasmid carrying ATP6L (forward primer 5′‐ACCCGAATTCATGTCCGAGTCCAAGAGCGGC‐3′, reverse primer 5′‐CGGACTCGAGCTACTTTGTGGAGAGGATGAG‐3′) ATP6L siRNA (5′‐CGCCCTCATCCTCTCCACAAA‐3′) and controlled scrambled plasmid (Genechem) was performed with Lipofectamine 2000 (Invitrogen) according to the manufacturer’s instructions. To establish stable HCT116 and HT29 cells that overexpressed ATP6L, G418‐resistant cells were screened.
2.5. Western blot analysis
Protein (30‐50 μg/lane) was separated by 10% SDS‐PAGE and transferred to polyvinylidene difluoride membranes. Blots were blocked and incubated with primary antibodies overnight at 4°C, incubated with secondary antibody, and detected with ECL western blot substrate (Millipore) according to the manufacturer’s instructions.
2.6. Cell proliferation assay
Cells were separately seeded into 96‐well plates at 1 × 10³/well and incubated for different periods (1, 2, 3, 4 or 5 days). After 4 hours of incubation at 37°C, MTT (Sigma‐Aldrich) solution was added. The purple crystals were dissolved by DMSO. The optical density was determined at 490 nm using a Spectra Max M2 (Molecular Devices).
2.7. Migration/invasion assay
Cell motility was examined in a transwell assay using 24‐well plates with uncoated inserts (8‐μm pore, BD Biosciences) to examine migration or Matrigel‐coated inserts to assess invasiveness. Briefly, 200 μL of cell suspension (5 × 10⁵ cells/mL) contained in serum‐free medium was added to the upper part, and 300 μL of culture medium supplemented with 20% FBS was added to the lower chamber. After incubation at 37°C with 5% CO2 for 24 hours, the cells were fixed and stained. The entire membrane was counted by light microscopy in six random fields.
2.8. Immunofluorescence confocal microscopy
Cells were cultured on sterile glass cover slips on the day before staining. Cells were fixed with 4% paraformaldehyde, quenched with 50 mmol/L NH4Cl, permeabilized in 0.2% Triton X‐100, and blocked in 3% BSA. The slips were incubated with the primary antibodies overnight at 4°C, labeled with the specific secondary antibodies for 1 hour in the dark, mounted, and visualized with a confocal laser scanning microscope (Leica TCS SP5, Leica Microsystems).
2.9. In vivo assay
To generate murine subcutaneous tumors, 20 mice were randomly and evenly divided into two groups and given either 3 × 10⁶ control or HCT116 cells overexpressing ATP6L by subcutaneous injection in the right groin. Tumor size was measured every 5 days for 30 days. Tumor volumes were calculated using the following formula: volume = (length [in millimeters] × width2 [in square millimeters])/2. To generate lung metastasis models, the control and HCT116 cells overexpressing ATP6L cells (10 mice/group, 3 × 10⁶/mL; 0.15 mL per mice) were injected into the tail vein. After 3 weeks, the mice were killed, and viscera (lung, liver, kidney and spleen) were harvested. Tumor samples or harvested viscera tissue were formalin‐fixed and paraffin‐embedded. The tissues were then subjected to H&E and immunohistochemical staining.
2.10. H&E staining and the evaluation of the non–necrosis area and microvessel density
H&E staining was performed to examine the necrosis of the tumor mass of xenograft mice. Tissue samples were sectioned (thickness, 4 μm) and deparaffinized in xylene. Tissue sections were stained with H&E, cleared in xylene and mounted on slides using neutral balsam. The photos were captured using the software Image‐Pro Plus (Media Cybernetics). Based on the different color of the necrotic and non–necrotic areas, the software calculated the level of non–necrosis (as a percentage of the total area relative to the entire histological section). The results were presented as mean and SD. Microvessel density (MVD) was determined by immunohistochemical staining of CD34. Ten separate areas with the highest density of discrete microvessels within each section were selected for vessel quantification at ×200 magnification. The results were presented as mean and SD.
2.11. Statistical analysis
SPSS v.16.0 software (SPSS, Chicago, IL, USA) was used for data analysis. The associations between ATP6L and clinicopathologic parameters and the differential expression of E‐cadherin and vimentin between different ATP6L expression‐level groups were assessed with Fisher’s exact test and the χ2 test. Differences or correlations between groups were assessed using the Mann‐Whitney U test, Student’s t test and Pearson’s correlation test. Significance was set at P < 0.05.
3. RESULTS
3.1. Association of ATP6L expression with clinico‐pathological features of colorectal carcinoma
A total of 167 (86.5%) patients showed positive ATP6L expression, whereas the remaining 26 (13.5%) showed negative ATP6L expression. Tumors were categorized as strong (++), weak (+) or negative (−) for ATP6L expression (Figure 1A). The relationship of ATP6L level in CRC with each clinicopathological parameter was analyzed (Table 1). ATP6L expression level in CRC increases as differentiation grade decreases. Positive ATP6L expression was observed in 10 of 14 (71.4%) well‐differentiated patient samples, in 81 of 95 (85.3%) moderately differentiated patient samples and 76 of 84 (90.5%) poorly differentiated patient samples. ATP6L was strongly expressed in samples with the presence of metastasis and recurrence. A total of 66 (34.2%) patients experienced metastasis. Patients with strong ATP6L expression had a higher rate of metastasis (35/66, 53.0%) than those with weak (25/66, 37.9%) or negative ATP6L expression (6/66, 9.1%). Strong ATP6L expression was detected in 6 of 10 (60%) colorectal cancer specimens from patients that experienced recurrence and in 60 of 183 (32.8%) specimens from patients that did not experience recurrence. Significant correlation between ATP6L expression and gender, age, tumor size or clinical stage were not observed.
Figure 1.
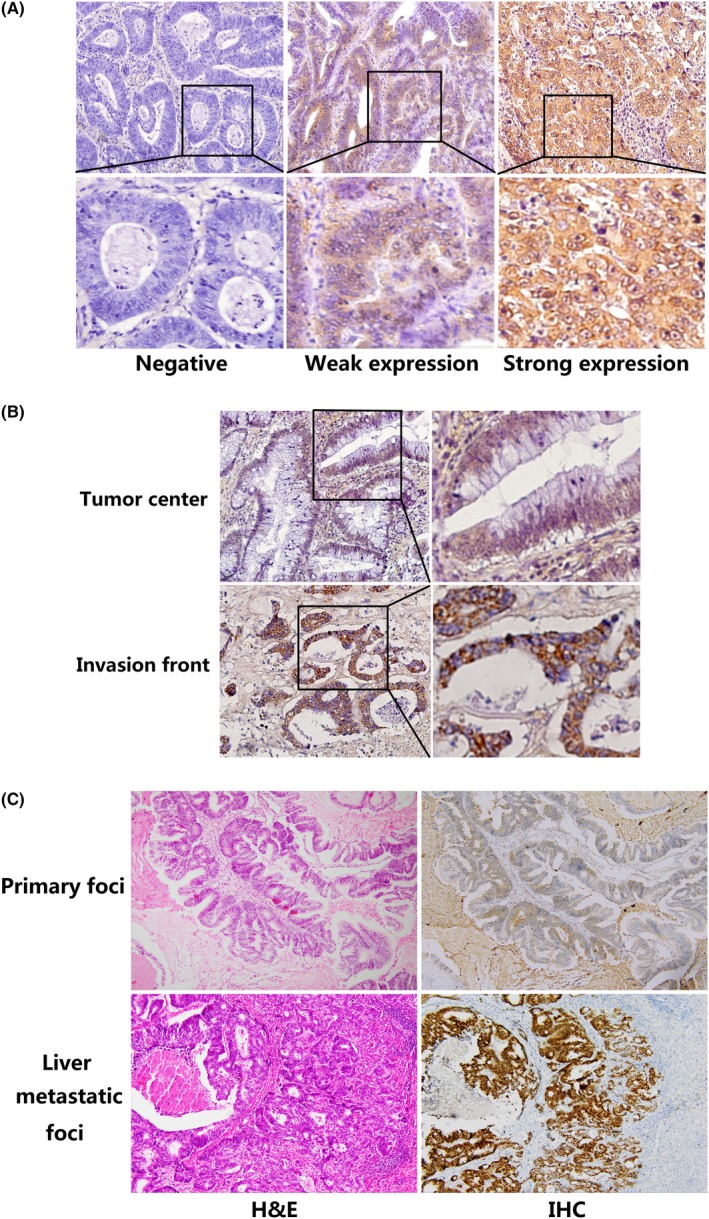
Expression of ATP6L by immunohistochemical staining in human colorectal carcinoma (CRC) tissue samples and in matched CRC primary foci and liver metastatic foci. A, Representative CRC samples with ATP6L negative (left), weak (middle) and strong (right) expression, 400×. Strong expression of ATP6L was observed in (B) invasive front and (C) liver metastatic foci, 200×. IHC, Immunohistochemical staining
Table 1.
Correlation between ATP6L and clinicopathologic characteristics of colorectal cancer
| Variable | Total | ATP6L expression n (%) | χ 2 | P‐value | ||
|---|---|---|---|---|---|---|
| − | + | ++ | ||||
| Age | ||||||
| <45 | 26 | 6 (23.1) | 12 (46.2) | 8 (30.8) | 2.380 | 0.304 |
| ≥45 | 167 | 20 (12.0) | 89 (53.3) | 58 (34.7) | ||
| Sex | ||||||
| Male | 88 | 10 (11.4) | 45 (51.1) | 33 (37.5) | 1.094 | 0.579 |
| Female | 105 | 16 (15.2) | 56 (53.3) | 33 (31.4) | ||
| Size | ||||||
| <5 cm | 134 | 19 (14.2) | 70 (52.2) | 45 (33.6) | 0.212 | 0.899 |
| ≥5 cm | 59 | 7 (11.9) | 31 (52.5) | 21 (35.6) | ||
| Differentiation | ||||||
| Well | 14 | 4 (28.6) | 8 (57.1) | 2 (14.3) | 33.343 | <0.001* |
| Mediate | 95 | 14 (14.7) | 64 (67.4) | 17 (17.9) | ||
| Poor | 84 | 8 (9.5) | 29 (34.5) | 47 (56.0) | ||
| Clinical stage | ||||||
| I | 7 | 1 (14.3) | 4 (57.1) | 2 (28.6) | 8.480 | 0.205 |
| II | 124 | 19 (15.3) | 71 (57.3) | 34 (27.4) | ||
| III | 51 | 5 (9.8) | 22 (43.1) | 24 (47.1) | ||
| IV | 11 | 1 (9.1) | 4 (36.4) | 6 (54.5) | ||
| Metastasis | ||||||
| Present | 66 | 6 (9.1) | 25 (37.9) | 35 (53.0) | 15.835 | <0.001* |
| Absent | 127 | 20 (15.7) | 76 (59.8) | 31 (24.4) | ||
| Recurrence | ||||||
| Present | 10 | 3 (30.0) | 1 (10.0) | 6 (60.0) | 7.803 | 0.020* |
| Absent | 183 | 23 (12.6) | 100 (54.6) | 60 (32.8) | ||
Significantly different (P < 0.05).
Differences in ATP6L expression levels within tumors were found. Tumor cells close to the adjacent interstitial component showed higher ATP6L expression than those at the cancer center (Figure 1B).
ATP6L expression was also analyzed in the 20 sets of matched specimens (including primary foci and liver metastatic foci) obtained from each patient. Table 2 and Figure 1C show the upregulated ATP6L expression in liver metastatic foci as compared with that in the primary cancer in each patient. These data indicate that ATP6L is involved in tumor progression in CRC.
Table 2.
ATP6L expression in matched colorectal cancer primary foci and metastatic foci in liver
| ATP6L expression n (%) | χ 2 | P value | ||||
|---|---|---|---|---|---|---|
| Total | − | + | ++ | |||
| Primary foci | 20 | 1 (5.0) | 11 (55.0) | 8 (40.0) | 6.433 | 0.040* |
| Metastatic foci | 20 | 0 (0.0) | 4 (20.0) | 16 (80.0) | ||
| Total | 40 | 1 (2.5) | 15 (75.0) | 24 (52.5) | ||
Significantly different.
3.2. ATP6L expression is concomitant with epithelial‐mesenchymal transition immunohistochemical features
To assess the relationship between ATP6L and EMT in CRC, we investigated the expression of the EMT‐associated markers E‐cadherin and vimentin. As shown in Table 3 and Figure 2, the ATP6L‐negative/weak expression group showed higher E‐cadherin expression and lower vimentin expression than the group with ATP6L strong expression. The expression of ATP6L was correlated with the expression of E‐cadherin (P = 0.021) and vimentin (P = 0.004) (Table 3). These findings confirm the role of ATP6L in activating the EMT program.
Table 3.
Correlation between expression of ATP6L and E‐cadherin and vimentin
| ATP6L expression n (%) | χ 2 | P‐value | ||||
|---|---|---|---|---|---|---|
| Total | − | + | ++ | |||
| E‐cadherin | ||||||
| Absent | 16 | 0 (0.0) | 5 (31.3) | 11 (68.8) | 7.768 | 0.021* |
| Present | 187 | 26 (13.9) | 96 (51.3) | 55 (29.4) | ||
| Vimentin | ||||||
| Absent | 187 | 26 (13.9) | 98 (52.4) | 53 (28.3) | 11.179 | 0.004* |
| Present | 16 | 0 (0.0) | 3 (18.8) | 13 (81.3) | ||
Significantly different.
Figure 2.
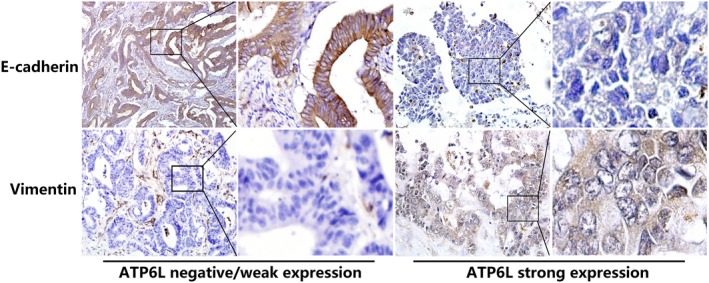
Expression of ATP6L is concomitant with epithelial‐mesenchymal transition (EMT) immunohistochemical features in human colorectal carcinoma (CRC) tissue samples. E‐cadherin expression was higher in ATP6L negative (−) or weak expression (+) samples than in strong‐expression (++) samples. Tumor cells in the ATP6L (−)/(+) samples did not express vimentin, whereas some tumor cells in the ATP6L (++) samples expressed vimentin
3.3. ATP6L overexpression induces epithelial‐mesenchymal transition and changes the morphology of HCT116 and HT29 cells
We established ATP6L‐overexpressed and ATP6L knockdown HCT116 and HT29 cells to study the EMT‐promoting effect of ATP6L on CRC. The EMT process refers to a molecular transition with the decreased expression of the epithelial marker E‐cadherin and increased expression of the mesenchymal markers, such as vimentin. Western blot and immunofluorescence assays demonstrated that both HCT116 and HT29 cells with ATP6L overexpression had decreased expression of E‐cadherin and increased expression of vimentin compared with control cells, while cells with downregulated ATP6L had increased expression of E‐cadherin and decreased expression of vimentin compared with control cells (Figure 3A,B). In addition to classical EMT markers, we examined the expression of a set of EMT transcription factors, namely, Snail, Slug and Twist, which can repress E‐cadherin expression by binding to the E‐boxes of E‐cadherin promoter directly. Among them, Snail was upregulated in both HCT116 and HT29 cells that overexpressed ATP6L, whereas the expression levels of Slug showed no significant change (Figure 3B). Twist was upregulated in ATP6L‐overexpressed HCT 116 cells, but its expression in ATP6L‐overexpressed HT29 cells showed no obvious change (Figure 3B). Expression of Snail and Twist was decreased in both the ATP6L knockdown HCT116 and HT29 cells, whereas the expression levels of Slug showed no significant change (Figure 3B).
Figure 3.
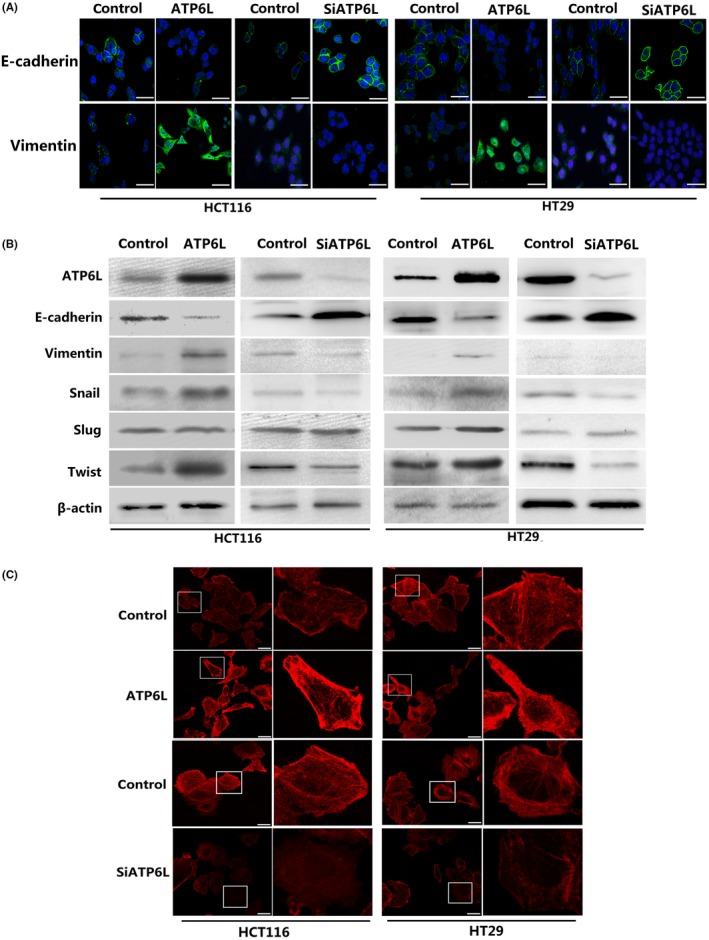
ATP6L expression induced a mesenchymal phenotype and changed the morphology of HCT116 and HT29 cells. A, Immunofluorescent staining of E‐cadherin and vimentin. A green signal represents staining for the corresponding protein, while a blue signal represents nuclear DNA staining by DAPI. Scale bar: 50 μm. B, Expression of epithelial‐mesenchymal transition (EMT) regulatory proteins, including E‐cadherin, vimentin, Snail, Slug and Twist, were examined by immunoblotting. C, Cell morphology was analyzed by confocal laser scanning microscopy according to the immunolocalization of F‐actin. Scale bar: 25 μm
We also observed alterations in cellular morphology and functional phenotypes other than in epithelial and mesenchymal protein expression. A portion of the cytoskeleton was observed by using phalloidin to dye fibrous actin (F‐actin). This observation revealed that ATP6L overexpression caused HCT116 and HT29 cells to exhibit a scattered, spindle, mesenchymal‐like shape, whereas control cells showed a tightly, uniform, cuboid‐like appearance (Figure 3C). As we expected, knockdown of ATP6L resulted in restoration of epithelial phenotypes (Figure 3C). These findings suggested that cells overexpressing ATP6L are susceptible to mesenchymal differentiation.
3.4. ATP6L expression promotes migration and invasion ability of HCT116 and HT29 cells in vivo
The proliferation rate of cells with either increased or decreased ATP6L expression showed no significant differences from that of control cells when an MTT assay was used (Figure 4A). During the EMT process, polarized epithelial cells reorganize the cytoskeleton, resolve the cell‐cell junction and cell‐ECM interaction, which are accompanied by increased invasiveness and metastasis.22 Migration and invasion assays revealed that more cells overexpressing ATP6L passed through the transwell membrane than control cells (Figure 4B,C, HCT116: migration: 33.0 ± 8.75 vs 17.6 ± 4.72, t = 3.654, P = 0.001; invasion:34.6 ± 6.88 vs 20.4 ± 4.88, t = 3.766, P = 0.0078; HT29: migration: 33.0 ± 5.54 vs 21.2 ± 1.58, t = 4.579, P = 0.007; invasion: 37.8 + 5.83 vs 25 ± 3.49, t = 4.211, P = 0.005), whereas downregulation of ATP6L expression suppressed the migration and invasion abilities of HCT116 and HT29 cells, respectively (Figure 4B,C, HCT116: migration: 22.0 ± 1.58 vs 11.6 ± 0.92, t = 5.674, P = 0.0005; invasion:16.0 ± 2.47 vs 9.2 ± 1.02, t = 2.545, P = 0.0345; HT29: migration: 27.0 ± 2.92 vs 17.0 ± 2.03, t = 2.817, P = 0.0226; invasion: 18.0 ± 1.58 vs 12.0 ± 1.58, t = 2.683, P = 0.0278). Our findings suggest that ATP6L expression increased the migratory, invasive and metastatic potential of HCT116 and HT29 cells.
Figure 4.
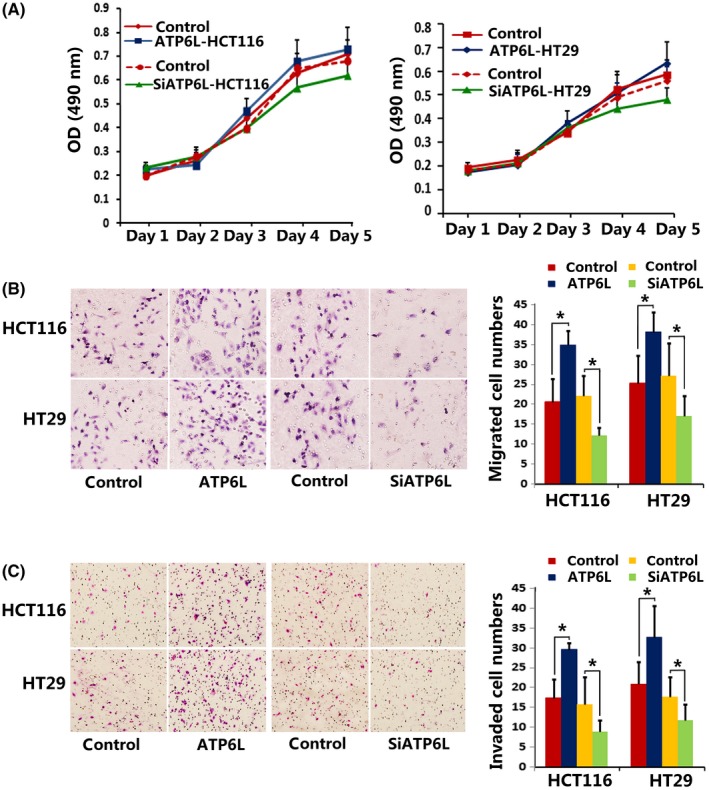
Effect of ATP6L expression on proliferation, migration and invasion ability of HCT116 and HT29 cells. A, MTT assay showed no significant differences between the proliferation rate of ATP6L‐overexpressed cells and control cells. B and C, Transwell assays showing migration/invasion of cells. Cells invading through uncoated inserts and Matrigel‐coated inserts were stained, 400×. *P < 0.05
3.5. Overexpression of ATP6L promotes tumor growth and metastasis of HCT116 cells in vivo
In agreement with in vitro analyses, HCT116 cells with overexpressed levels of ATP6L grew into larger tumor masses, as shown in Figure 5A,B (Day 25:310 ± 81 mm3 vs 186 ± 45 mm3, t = 2.702, P = 0.027; Day 30:400 ± 49.4 mm3 vs 220 ± 29.5 mm3, t = 3.138, P = 0.0138). Among the 10 mice injected with ATP6L‐overexpressed HCT116 cells, 1 showed tumor invasion into the surrounding adipose tissue and another exhibited the formation of intravascular tumor thrombus, whereas no metastasis sites were detected in mice injected with control cells (Figure 5C). We further established lung metastasis mouse models by tail vein injection and found that ATP6L overexpressing HCT116 cells formed more lung metastatic nodules (Figure 5D, 1.6 ± 0.43 vs 0.5 ± 0.22, t = 2.283, P = 0.0348). To assess the EMT activity in xenografts, we performed E‐cadherin and vimentin immunohistochemical staining on the sections of the xenograft tissues. The respective decrease of E‐cadherin and increase of vimentin expression levels were observed in ATP6L tumors, as shown in Figure 5E.
Figure 5.
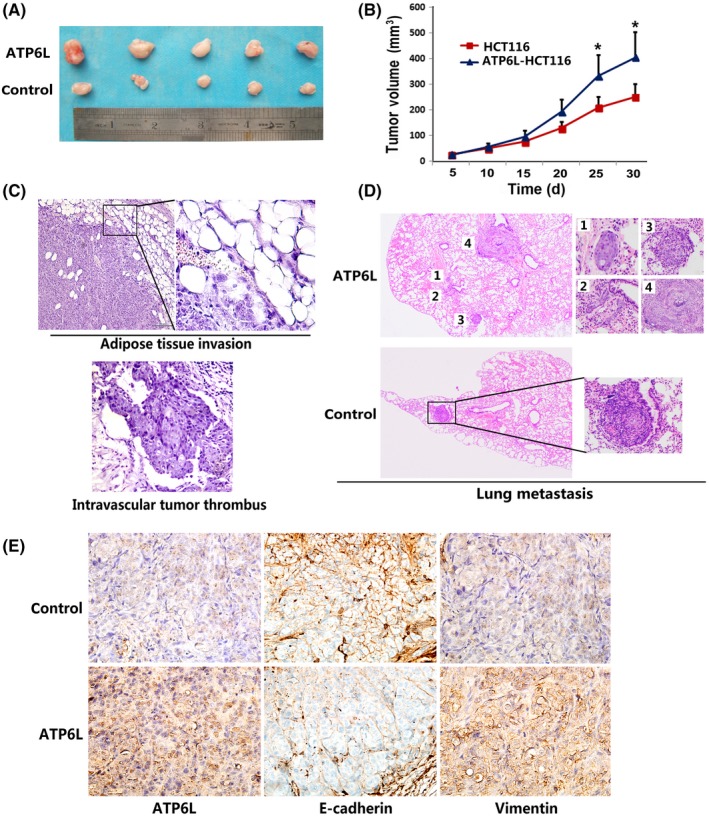
Effect of ATP6L expression on tumor growth, metastasis and epithelial‐mesenchymal transition (EMT) in vivo. A, Photograph of representative tumors from mice injected with control or ATP6L‐transfected HCT116 cells. B, ATP6L‐overexpressing cells produced larger tumor masses than control cells. C, H&E staining of adipose tissue and intravascular thrombus, 200×. D, H&E staining of lung tissues of tail vein injected mice, 40×. E, Immunohistochemical staining of ATP6L, E‐cadherin and vimentin expression in harvested mouse tumor samples, 200×. *P < 0.05
3.6. ATP6L expression is correlated with decreased necrotic area and increased microvessel density in the sections of xenograft tissues
H&E photographs illustrate a decrease in the percentage of the necrotic area in mice tumor tissues derived from ATP6L‐transfected HCT116 cells (Figure 6A,B, 4.07 ± 4.88% vs 21.9 ± 10.03%, t = 2.22, P = 0.045). MVD counts were higher in the tumor sections of HCT116 cells with overexpressed ATP6L than those in the control cases (Figure 6C, 13.7 ± 1.14 vs 18.1 ± 1.64, t = 2.209, P = 0.0404). These results indicate the angiogenesis‐promoting effect of ATP6L on CRC.
Figure 6.
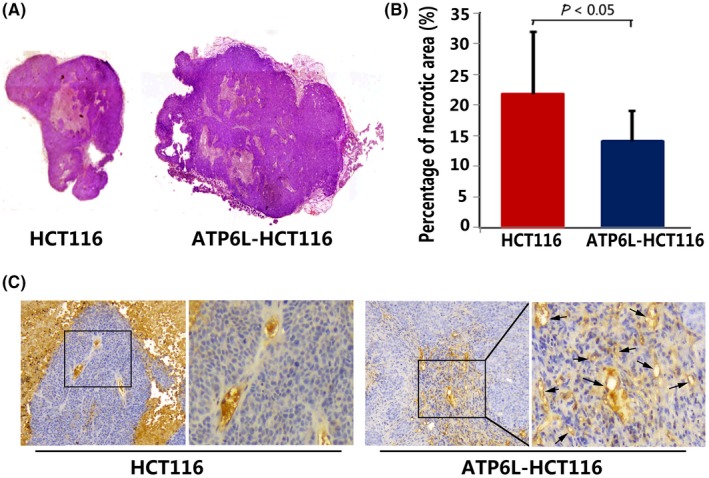
Effect of ATP6L overexpression on necrosis and angiogenesis of harvested mouse tumor. A, H&E photographs illustrating necrosis in mice tumor tissues derived from ATP6L‐transfected HCT116 cells and control cells, 40×. B, Quantitative analysis of the proportions of necrotic tissue in the largest section of tumor masses is shown as mean ± SD. C, Immunohistochemical staining for CD34 expression in harvested mouse tumor samples, 200×. Black arrows point to the microvessels in the tumor
4. DISCUSSION
ATP6L has an array of functions in physical as well as pathological processes. The overexpression of ATP6L enhances the invasion activity of fibroblasts and inhibits integrin β1‐mediated HEK293 cell motility through the glycosylation of integrin β1.23, 24 ATP6L has a protective role against sodium nitroprusside‐induced autophagic apoptosis through inhibition of c‐Jun N‐terminal kinase (JNK) and p38 in glutathione‐depleted glial cells.25 However, only a few previous literature mention the correlation between ATP6L expression and tumor progression. Xu et al20 reported that the messenger RNA and gene expression levels of ATP6L in human hepatocellular carcinoma tissues were markedly increased compared with those in normal liver tissues. Ohta et al15 reported that increased ATP6L expression correlates with increasing invasive potential in pancreatic cancer, and Cotter et al26 showed that the inhibition of ATP6L activity reduces invasion and migration of breast cancer cells in vitro. Here, we initially analyzed ATP6L expression in a large array of colorectal cancer tissues and observed that the correlation of ATP6L expression with histological differentiation, metastasis and recurrence was significant. In addition, ATP6L expression in the liver metastasis foci was markedly higher than that in colorectal primary foci. These results indicate the possible role of ATP6L in inducing CRC progression.
The EMT phenomenon refers to the conversion of epithelial cells into mesenchymal phenotype cells.27 In the EMT process, epithelial cancer cells lose their apical‐basal polarity and cell‐cell and cell‐ECM adhesion, accompanied with cytoskeleton reorganization, thus facilitating cancer cell invasion and metastasis.22 In addition, EMT also endows tumor cells with cancer stem cell‐like features and resistance to senescence and apoptosis.28 For decades, studies have elucidated the essential role of the microenvironment on phenotype conversion exhibited by cancer cells. Some studies have shown that ATP6L promotes migration based on the observation that it induces the activation of matrix metalloproteinase (MMP)‐2, matrix metalloproteinase (MMP)‐9 and cathepsin, which take part in ECM degradation and facilitate the escape of tumor cells from the primary site.24, 29, 30 In the present study, the tumor tissue with strong ATP6L expression showed lower levels of E‐cadherin and higher levels of vimentin expression than the tumor tissues with weak or negative expression, indicating a mesenchymal‐like characteristic similar to that in the EMT process. Similar results were also demonstrated both in vitro and in mouse model tests, accompanied by actin cytoskeleton reprogramming and enhanced motility, further confirming that ATP6L can advance the EMT program in CRC. Thus, except in ECM degradation, the EMT of cancer cells induced by ATP6L overexpression may also contribute to the enhanced migratory and invasive abilities of CRC.
In this study, change of proliferation in HT29 and HCT116 cells with ectopic ATP6L expression in MTT experiment was not observed. Inconsistent with our results, Ohta et al31 observed that bafilomycin A1, a specific inhibitor of ATP6L, could inhibit the growth of a variety of cultured pancreatic cancer cells in a dose‐dependent manner. We propose that the effects of ATP6L on the proliferation of tumors may be type‐dependent and influenced by multiple mechanisms.
In the in vitro MTT analysis the proliferation of ATP6L‐overexpressing cells showed no significant differences from the control cells, whereas our result in the animal experiment showed that ATP6L‐overexpressing cells produced larger tumor masses than control cells. It has been reported that an acidic extracellular microenvironment could induce cancer cells to secrete pro–angiogenesis factors, such as interleukin‐8 and vascular endothelial growth factor; thus, it is beneficial to tumor angiogenesis and growth.32, 33 Our result that mice tumor tissues derived from ATP6L‐transfected HCT116 cells illustrated decreased necrosis and increased angiogenesis may explain the inconsistency between in vitro and in vivo experiments and point out more possible mechanisms of the tumor‐promoting effect of ATP6L. A similar result was observed in the study of Lu (2005), who found that small RNA interference of ATP6L can reduce blood supply in hepatocellular carcinoma mouse xenografts.34 Moreover, tumor neovessels formed by loosely and irregularly arranged immature endothelial cells increase the chances of the entry of tumor cells into the microcirculation and subsequently contribute to distant dissemination. Thus, ATP6L may exert its metastasis‐promoting effect by inducing EMT of CRC cells and promoting angiogenesis.
Cruciat et al35 reported that treating HEK293T cells with siRNA targeting ATP6L inhibited Wnt signaling by blocking the phosphorylation and endocytosis of the LRP6 receptor and β‐catenin activation following ligand binding. George et al36 showed that bafilomycin A blocks the activation of canonical Wnt signaling. Although these studies were performed in nonmalignant cells, all the results suggested that ATP6L is required for the activation of Wnt/β‐catenin signaling. Especially in CRC, Wnt/β‐catenin signaling is simultaneously involved in regulating EMT and tumor angiogenesis and is crucial in tumorigenesis and progression. Future studies designed to elucidate ATP6L expression on other tumor types and its effects on canonical Wnt signal pathway are currently in progress.
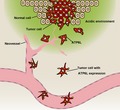
Collectively, we demonstrated that ATP6L is markedly overexpressed in the poorly differentiated CRC tissues evidently located in the invasive front and metastatic foci. More importantly, in vitro and in vivo data demonstrated that ATP6L can induce the EMT program and promote tumor progression in CRC cells. Furthermore, ectopic ATP6L expression can promote MVD in animal xenograft tissue. These results demonstrate that ATP6L advances the malignant progression of human CRC intrinsically and externally (Figure 7). The co–evolution of cancer cells with the adjacent microenvironment determines every step of malignant progression. Thus, eliminating cancer cells and manipulating TME should be considered in developing antitumor therapies. The results of the current study reveal the potential of targeting ATP6L for cancer treatment.
Figure 7.
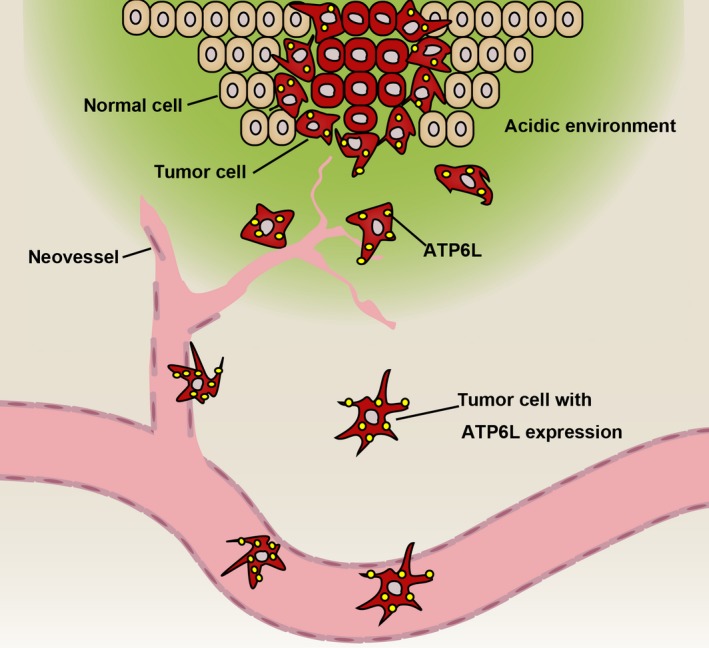
Graphical abstract illustrating that ATP6L exert a metastasis‐promoting effect by inducing epithelial‐mesenchymal transition (EMT) of human colorectal carcinoma (CRC) cells
DISCLOSURE
The authors have no conflict of interest to declare.
ACKNOWLEDGMENTS
This research was funded by the National Natural Science Foundation of China (Nos. 81402420, 380 81702161 and 81801781), the Project of Tianjin Natural Science Foundation (Nos. 15JCQNJC12400 and 381 15JCQNJC14500) and the Top talent training program of the first affiliated hospital of PLA Army Medical 382 University (SWH2018BJKJ‐12).
Wang J, Chen D, Song W, et al. ATP6L promotes metastasis of colorectal cancer by inducing epithelial‐mesenchymal transition. Cancer Sci. 2020;111:477–488. 10.1111/cas.14283
REFERENCES
- 1. Torre LA, Bray F, Siegel RL, Ferlay J, Lortet‐Tieulent J, Jemal A. Global cancer statistics, 2012. CA Cancer J Clin. 2015;65:87‐108. [DOI] [PubMed] [Google Scholar]
- 2. Arnold M, Sierra MS, Laversanne M, Soerjomataram I, Jemal A, Bray F. Global patterns and trends in colorectal cancer incidence and mortality. Gut. 2017;66:683‐691. [DOI] [PubMed] [Google Scholar]
- 3. Fakih MG. Metastatic colorectal cancer: current state and future directions. J Clin Oncol. 2015;33:1809‐1824. [DOI] [PubMed] [Google Scholar]
- 4. Paget S. The distribution of secondary growths in cancer of the breast 1889. Cancer Metastasis Rev. 1989;8:98‐101. [PubMed] [Google Scholar]
- 5. Chen Q, Liu G, Liu S, et al. Remodeling the tumor microenvironment with emerging nanotherapeutics. Trends Pharmacol Sci. 2018;39:59‐74. [DOI] [PubMed] [Google Scholar]
- 6. Maman S, Witz IP. A history of exploring cancer in context. Nat Rev Cancer. 2018;18:359‐376. [DOI] [PubMed] [Google Scholar]
- 7. Liberti MV, Locasale JW. The Warburg effect: how does it benefit cancer cells? Trends Biochem Sci. 2016;41:211‐218. [DOI] [PMC free article] [PubMed] [Google Scholar]
- 8. Gatenby RA, Gawlinski ET. The glycolytic phenotype in carcinogenesis and tumor invasion: insights through mathematical models. Cancer Res. 2003;63:3847‐3854. [PubMed] [Google Scholar]
- 9. Tian XP, Wang CY, Jin XH, et al. Acidic microenvironment up‐regulates exosomal miR‐21 and miR‐10b in early‐stage hepatocellular carcinoma to promote cancer cell proliferation and metastasis. Theranostics. 2019;9:1965‐1979. [DOI] [PMC free article] [PubMed] [Google Scholar]
- 10. Huber V, Camisaschi C, Berzi A, et al. Cancer acidity: an ultimate frontier of tumor immune escape and a novel target of immunomodulation. Semin Cancer Biol. 2017;43:74‐89. [DOI] [PubMed] [Google Scholar]
- 11. Walenta S, Wetterling M, Lehrke M, et al. High lactate levels predict likelihood of metastases, tumor recurrence, and restricted patient survival in human cervical cancers. Cancer Res. 2000;60:916‐921. [PubMed] [Google Scholar]
- 12. Morita T, Nagaki T, Fukuda I, Okumura K. Clastogenicity of low pH to various cultured mammalian cells. Mutat Res. 1992;268:297‐305. [DOI] [PubMed] [Google Scholar]
- 13. Kolosenko I, Avnet S, Baldini N, Viklund J, De Milito A. Therapeutic implications of tumor interstitial acidification. Semin Cancer Biol. 2017;43:119‐133. [DOI] [PubMed] [Google Scholar]
- 14. Stransky L, Cotter K, Forgac M. The function of V‐ATPases in cancer. Physiol Rev. 2016;96:1071‐1091. [DOI] [PMC free article] [PubMed] [Google Scholar]
- 15. Ohta T, Numata M, Yagishita H, et al. Expression of 16 kDa proteolipid of vacuolar‐type H(+)‐ATPase in human pancreatic cancer. Br J Cancer. 1996;73:1511‐1517. [DOI] [PMC free article] [PubMed] [Google Scholar]
- 16. Nishisho T, Hata K, Nakanishi M, et al. The a3 isoform vacuolar type H⁺‐ATPase promotes distant metastasis in the mouse B16 melanoma cells. Mol Cancer Res. 2011;9:845‐855. [DOI] [PubMed] [Google Scholar]
- 17. Michel V, Licon‐Munoz Y, Trujillo K, Bisoffi M, Parra KJ. Inhibitors of vacuolar ATPase proton pumps inhibit human prostate cancer cell invasion and prostate‐specific antigen expression and secretion. Int J Cancer. 2013;132:E1‐E10. [DOI] [PMC free article] [PubMed] [Google Scholar]
- 18. Hendrix A, Sormunen R, Westbroek W, et al. Vacuolar H+ ATPase expression and activity is required for Rab27B‐dependent invasive growth and metastasis of breast cancer. Int J Cancer. 2013;133:843‐854. [DOI] [PubMed] [Google Scholar]
- 19. Forgac M. Vacuolar ATPases: rotary proton pumps in physiology and pathophysiology. Nat Rev Mol Cell Biol. 2007;8:917‐929. [DOI] [PubMed] [Google Scholar]
- 20. Xu J, Xie R, Liu X, et al. Expression and functional role of vacuolar H(+)‐ATPase in human hepatocellular carcinoma. Carcinogenesis. 2012;33:2432‐2440. [DOI] [PubMed] [Google Scholar]
- 21. Zhang S, Qi L, Li M, et al. Chemokine CXCL12 and its receptor CXCR4 expression are associated with perineural invasion of prostate cancer. J Exp Clin Cancer Res. 2008;27:62. [DOI] [PMC free article] [PubMed] [Google Scholar]
- 22. Yilmaz M, Christofori G. EMT, the cytoskeleton, and cancer cell invasion. Cancer Metastasis Rev. 2009;28:15‐33. [DOI] [PubMed] [Google Scholar]
- 23. Lee I, Skinner MA, Guo HB, Sujan A, Pierce M. Expression of the vacuolar H+‐ATPase 16‐kDa subunit results in the Triton X‐100‐insoluble aggregation of beta1 integrin and reduction of its cell surface expression. J Biol Chem. 2004;279:53007‐53014. [DOI] [PubMed] [Google Scholar]
- 24. Kubota S, Seyama Y. Overexpression of vacuolar ATPase 16‐kDa subunit in 10T1/2 fibroblasts enhances invasion with concomitant induction of matrix metalloproteinase‐2. Biochem Biophys Res Commun. 2000;278:390‐394. [DOI] [PubMed] [Google Scholar]
- 25. Byun YJ, Lee SB, Lee HO, et al. Vacuolar H+ ‐ATPase c protects glial cell death induced by sodium nitroprusside under glutathione‐depleted condition. J Cell Biochem. 2011;112:1985‐1996. [DOI] [PubMed] [Google Scholar]
- 26. Cotter K, Capecci J, Sennoune S, et al. Activity of plasma membrane V‐ATPases is critical for the invasion of MDA‐MB231 breast cancer cells. J Biol Chem. 2015;290:3680‐3692. [DOI] [PMC free article] [PubMed] [Google Scholar]
- 27. Nieto MA, Huang RY, Jackson RA, Thiery JP. EMT: 2016. Cell. 2016;166(1):21‐45. [DOI] [PubMed] [Google Scholar]
- 28. Shibue T, Weinberg RA. EMT, CSCs, and drug resistance: the mechanistic link and clinical implications. Nat Rev Clin Oncol. 2017;14:611‐629. [DOI] [PMC free article] [PubMed] [Google Scholar]
- 29. Chung C, Mader CC, Schmitz JC, et al. The vacuolar‐ATPase modulates matrix metalloproteinase isoforms in human pancreatic cancer. Lab Invest. 2011;91:732‐743. [DOI] [PMC free article] [PubMed] [Google Scholar]
- 30. Kubisch R, Fröhlich T, Arnold GJ, et al. V‐ATPase inhibition by archazolid leads to lysosomal dysfunction resulting in impaired cathepsin B activation in vivo. Int J Cancer. 2014;134:2478‐2488. [DOI] [PubMed] [Google Scholar]
- 31. Ohta T, Arakawa H, Futagami F, et al. Bafilomycin A1 induces apoptosis in the human pancreatic cancer cell line Capan‐1. J Pathol. 1998;185:324‐330. [DOI] [PubMed] [Google Scholar]
- 32. Nakanishi M, Morita Y, Hata K, Muragaki Y. Acidic microenvironments induce lymphangiogenesis and IL‐8 production via TRPV1 activation in human lymphatic endothelial cells. Exp Cell Res. 2016;345:180‐189. [DOI] [PubMed] [Google Scholar]
- 33. Fukumura D, Xu L, Chen Y, Gohongi T, Seed B, Jain RK. Hypoxia and acidosis independently up‐regulate vascular endothelial growth factor transcription in brain tumors in vivo. Cancer Res. 2001;61:6020‐6024. [PubMed] [Google Scholar]
- 34. Lu X, Qin W, Li J, et al. The growth and metastasis of human hepatocellular carcinoma xenografts are inhibited by small interfering RNA targeting to the subunit ATP6L of proton pump. Cancer Res. 2005;65:6843‐6849. [DOI] [PubMed] [Google Scholar]
- 35. Cruciat CM, Ohkawara B, Acebron SP, et al. Requirement of prorenin receptor and vacuolar H+‐ATPase‐mediated acidification for Wnt signaling. Science. 2010;327:459‐463. [DOI] [PubMed] [Google Scholar]
- 36. George A, Leahy H, Zhou J, Morin PJ. The vacuolar‐ATPase inhibitor bafilomycin and mutant VPS35 inhibit canonical Wnt signaling. Neurobiol Dis. 2007;26:125‐133. [DOI] [PubMed] [Google Scholar]


